Logging architecture
Architecture overview
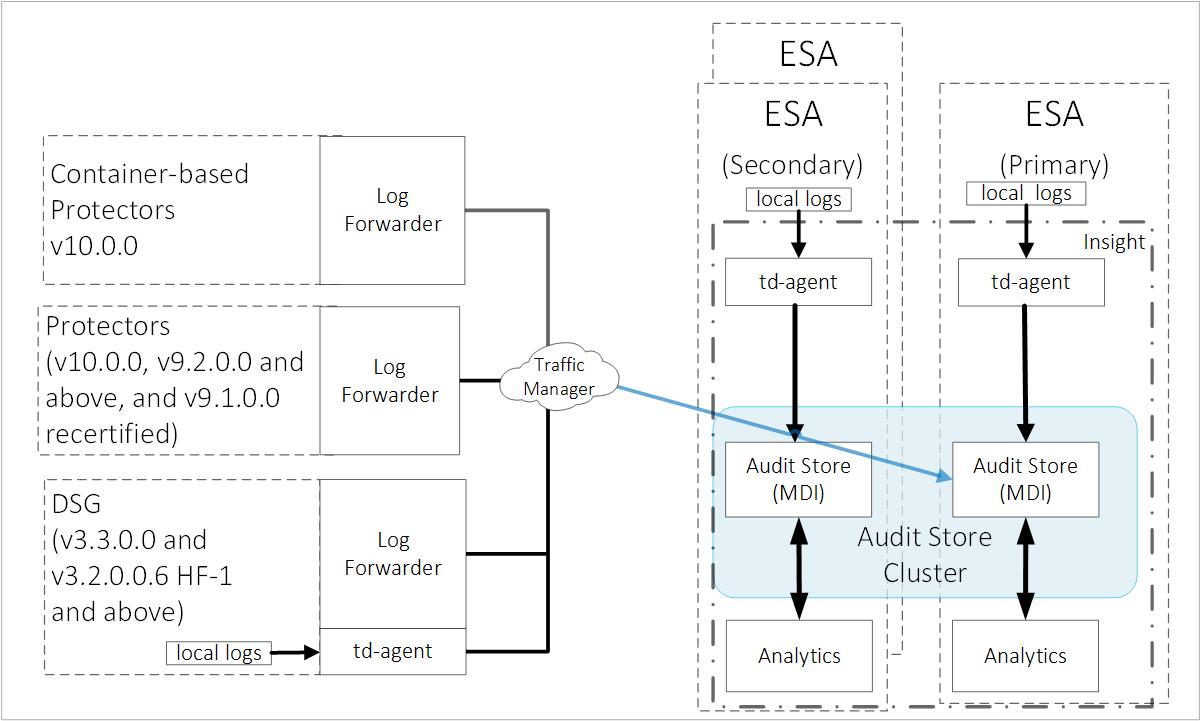
Logging follows a fixed routine. The system generates logs, which are collected and then forwarded to Insight. Insight stores the logs in the Audit Store. The Audit Store holds the logs and these log records are used in various areas, such as, forensics, alerts, reports, dashboards, and so on. This section explains the logging architecture.

The ESA v10.0.x only supports protectors having the PEP server version 1.2.2+42 and later.
ESA:
The ESA has the td-agent service installed for receiving and sending logs to Insight. Insight stores the logs in the Audit Store that is installed on the ESA. From here, the logs are analyzed by Insight and used in various areas, such as, forensics, alerts, reports, dashboards, visualizations, and so on. Additionally, logs are collected from the log files generated by the Hub Controller and Membersource services and sent to Insight. By default, all Audit Store nodes have all node roles, that is, Master-eligible, Data, and Ingest. A minimum of three ESAs are required for creating a dependable Audit Store cluster to protect it from system crashes. The architecture diagram shows three ESAs.
Protectors:
The logging system is configured on the protectors to send logs to Insight on the ESA using the Log Forwarder.
DSG:
The DSG has the td-agent service installed. The td-agent forwards the appliance logs to Insight on the ESA. The Log Forwarder service forwards the data security operations-related logs, namely protect, unprotect, and reprotect, and the PEP server logs to Insight on the ESA.
Important: The gateway logs are not forwarded to Insight.
Container-based protectors
The container-based protectors are the Immutable Java Application Protector Container and REST containers. They Immutable Java Application Protector Container represents a new form factor for the Java Application Protector. The container is intended to be deployed on the Kubernetes environment.
The REST container represents a new form factor that is being developed for the Application Protector REST. The REST container is deployed on Kubernetes, residing on any of the Cloud setups.
Components of Insight
The solution for collecting and forwarding the logs to Insight composes the logging architecture. The various components of Insight are installed on an appliance or an ESA.
A brief overview of the Insight components is provided in the following figure.

Understanding Analytics
Analytics is a component that is configured when setting up the ESA. After it is installed, the tools, such as, the scheduler, reports, rollover tasks, and signature verification tasks are available. These tools are used to maintain the Insight indexes.
Understanding the Audit Store Dashboards
The logs stored in the Audit Store hold valuable data. This information is very useful when used effectively. To view the information in an effective way, Insight provides tools such as dashboards and visualization. These tools are used to view and analyze the data in the Audit Store. The ESA logs are displayed on the Discover screen of the Audit Store Dashboards.
Understanding the Audit Store
The Audit Store is the database of the logging ecosystem. The main task of the Audit Store is to receive all the logs, store them, and provide the information when log-related data is requested. It is very versatile and processes data fast.
The Audit Store is a component that is installed on the ESA during the installation. The Audit Store is scalable, hence, additional nodes can be added to the Audit Store cluster.
Understanding the td-agent
The td-agent forms an integral part of the Insight ecosystem. It is responsible for sending logs from the appliance to Insight. It is the td-agent service that is configured to send and receive logs. The service is installed, by default, on the ESA and DSG.
Based on the installation, the following configurations are performed for the td-agent:
- Insight on the local system: In this case, the td-agent is configured to collect the logs and send it to Insight on the local system.
- Insight on a remote system: In this case, Insight is not installed locally, such as the DSG, but it is installed on the ESA. The td-agent is configured to forward logs securely to Insight in the ESA.
Understanding the Log Forwarder
The Log Forwarder is responsible for forwarding data security operation logs to Insight in the ESA. In cases when the ESA is unreachable, the Log Forwarder handles the logs until the ESA is available.
For Linux-based protectors, such as the Oracle Database Protector for Linux, if the connection to the ESA is lost, then the Log Forwarder starts collecting the logs in the memory cache. If the ESA is still unreachable after the cache is full, then the Log Forwarder continues collecting the logs and stores in the disk. When the connection to the ESA is restored, the logs in the cache are forwarded to Insight. The default memory cache for collecting logs is 256 MB. If the filesystem for Linux protectors is not EXT4 or XFS, then the logs will not be saved to the disk after the cache is full.
For information about updating the cache limit, refer here.
The following table provides information about how the Log Forwarder handles logs in different situations.
| If.. | then the Log Forwarder… |
|---|---|
| Connection to ESA is lost | Starts collecting logs in the in-memory cache based on the cache limit defined. |
| Connection to ESA is lost and the cache is full | In case of Linux-based protectors, the Log Forwarder continues to collect the logs and stores in disk. If the disk space is full, then all the cache files are emptied and the Log Forwarder continues to run. For Windows-based protectors, the Log Forwarder starts throwing away the logs. |
| Connection to ESA is restored | Forwards logs to Insight on the ESA. |
Understanding the log aggregation
The architecture, the configurations, and the workflow provided here describes the log aggregation feature.
Log aggregation happens within the protector.
- Protector flushes all security audits once every second, by default. If a different user, data elements, or operations are involved, the number of security logs generated every second varies. The operations include protect, unprotect, or reprotect. Also, the generation rate of security logs depends on the number of users, data elements, and operations involved.
- FluentBit, by default, sends one batch every 10 second and when this occurs it will take all security and application logs.
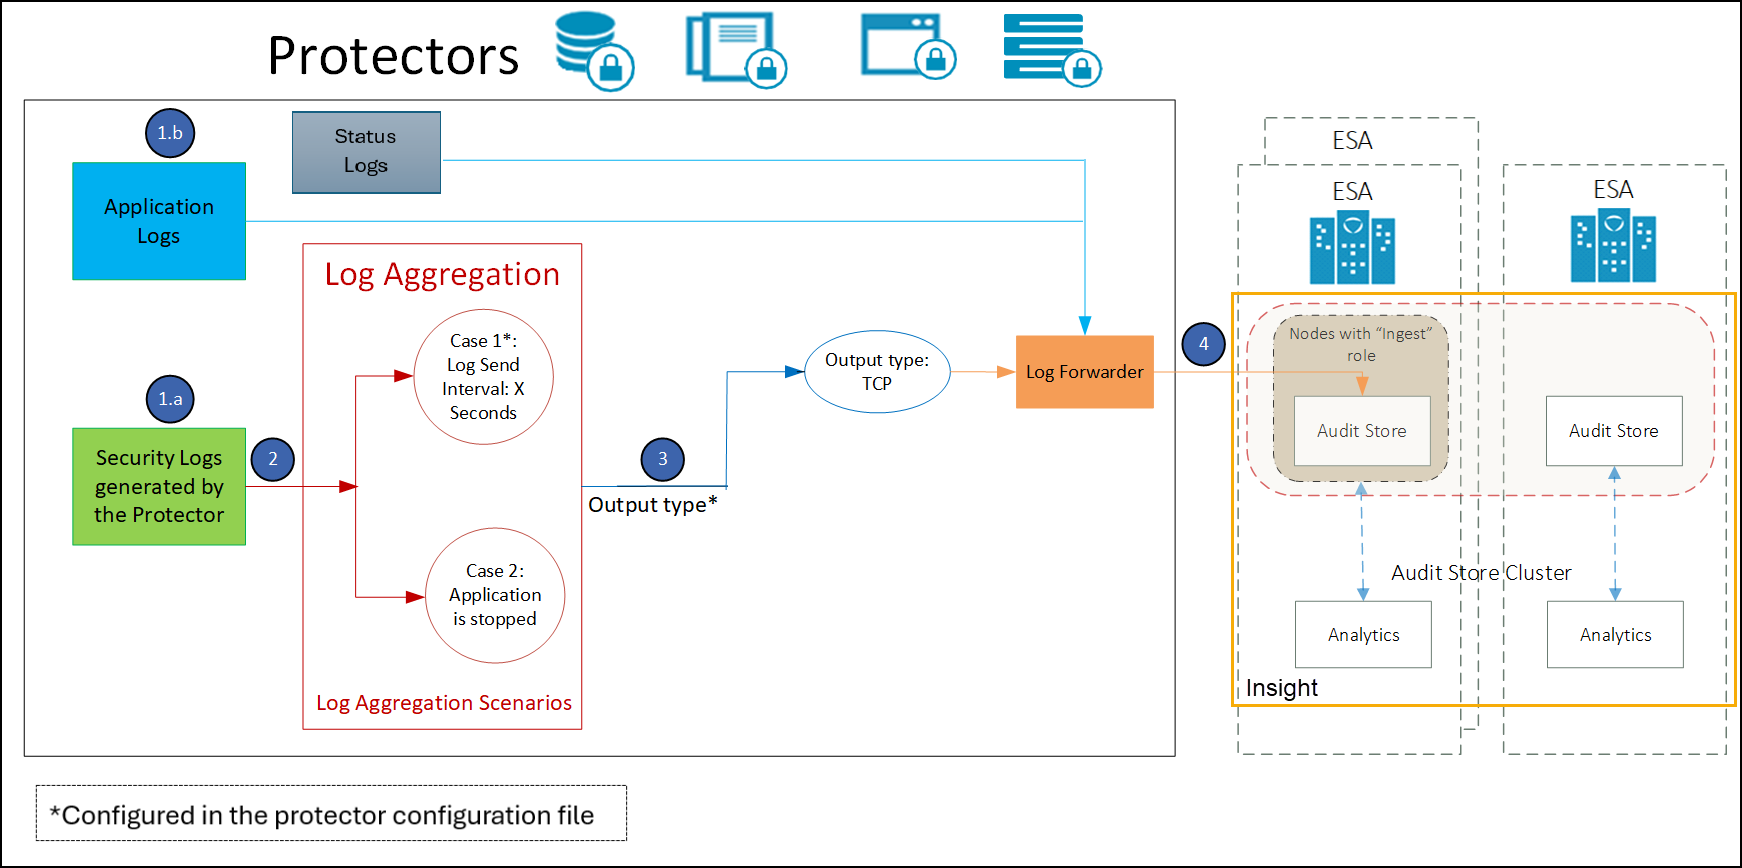
The following diagram describes the architecture and the workflow of the log aggregation.

- The security logs generated by the protectors are aggregated in the protectors.
- The application logs are not aggregated and they are sent directly to the Log Forwarder.
- The security logs are aggregated and flushed at specific time intervals.
- The aggregated security logs from the Log Forwarder are forwarded to Insight.
The following diagram illustrates how similar logs are aggregated.

The similar security logs are aggregated after the log send interval or when an application is stopped.
For example, if 30 similar protect operations are performed simultaneously, then a single log will be generated with a count of 30.
Feedback
Was this page helpful?