Overview of the dashboards
Viewing the graphs provides an easier and faster method for reading the log information. This helps understand the working of the system and also take decisions faster, such as, understanding the processing load on the ESAs and accordingly expanding the cluster by adding nodes, if required.
For more information about the dashboards, navigate to https://opensearch.org/docs/latest/dashboards/.
Accessing the Insight Dashboards
The Insight Dashboards appears on a separate tab from the ESA Web UI. However, it uses the same session as the ESA Web UI. Signing out from the ESA Web UI also signs out from the Insight Dashboards. Complete the steps provided here to view the Insight Dashboards.
Log in to the ESA Web UI.
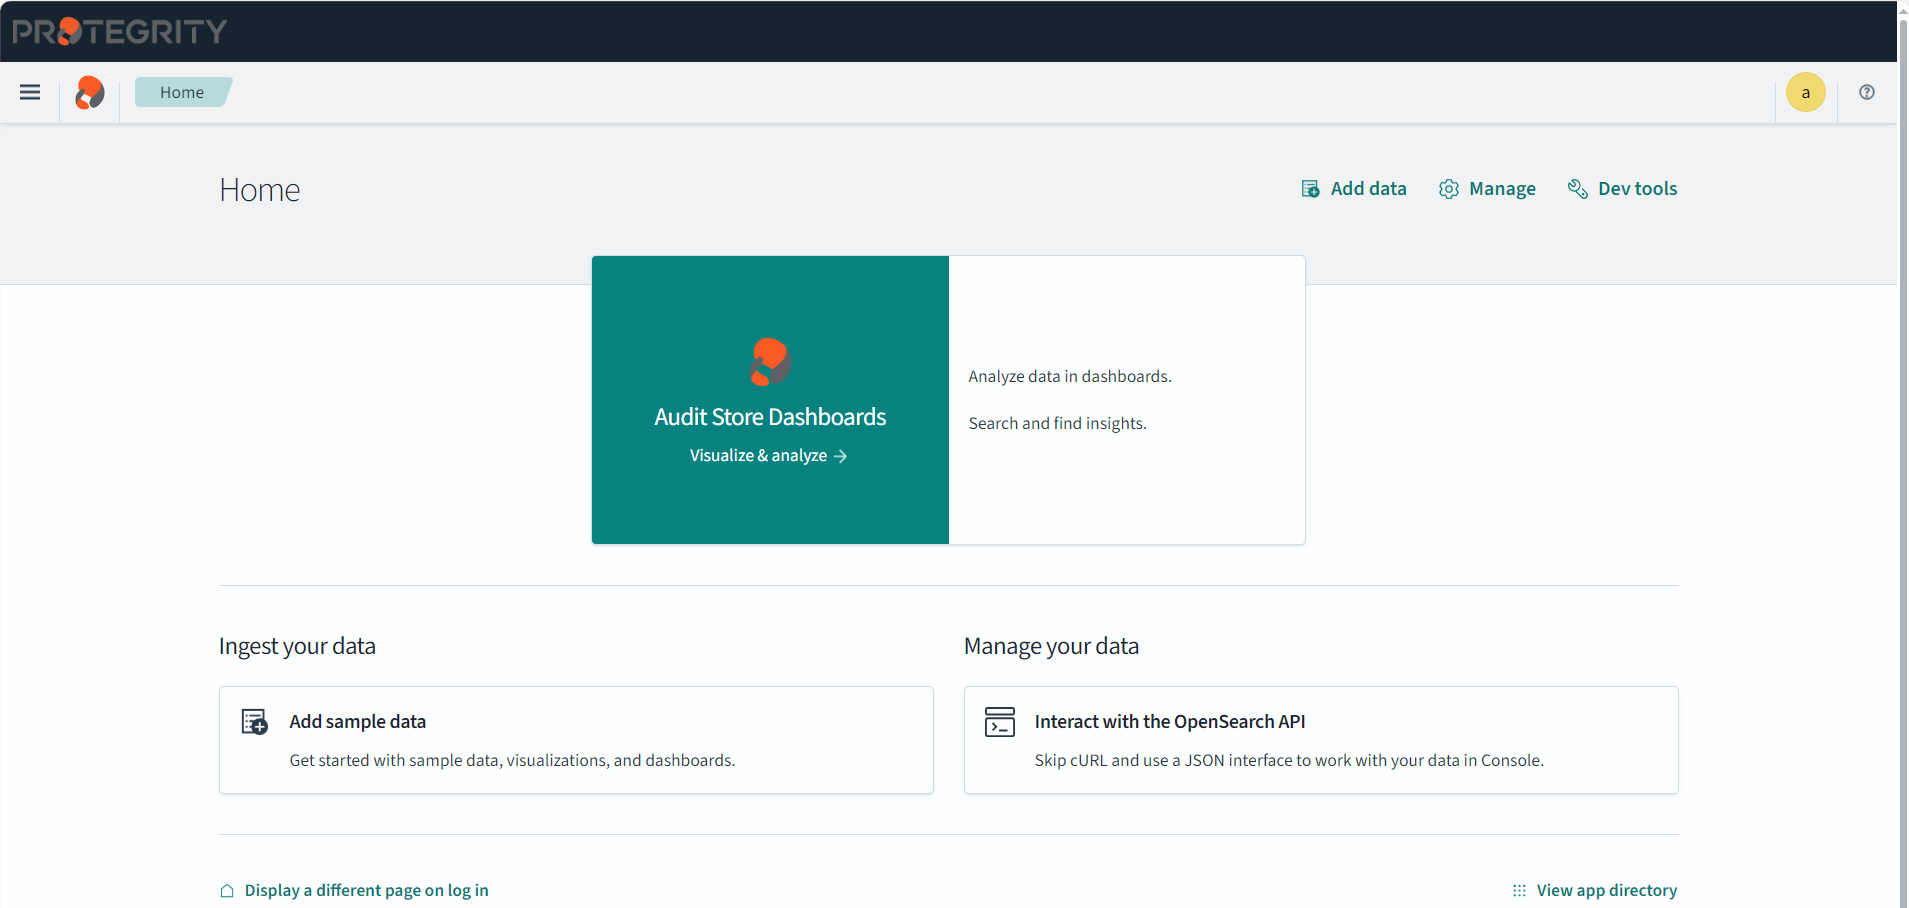
Click Audit Store > Dashboard. If pop-ups are blocked in the browser, click Open in a new tab to view the Audit Store Dashboards, also known as Insight Dashboards.
The Audit Store Dashboards is displayed in a new tab of the browser.

Overview of the Insight Dashboards Interface
An overview of the various parts of the Insight Dashboards, also known as the Audit Store Dashboards, is provided here.
For more information about the dashboard elements, refer to https://opensearch.org/docs/latest/dashboards/dashboard/index/.
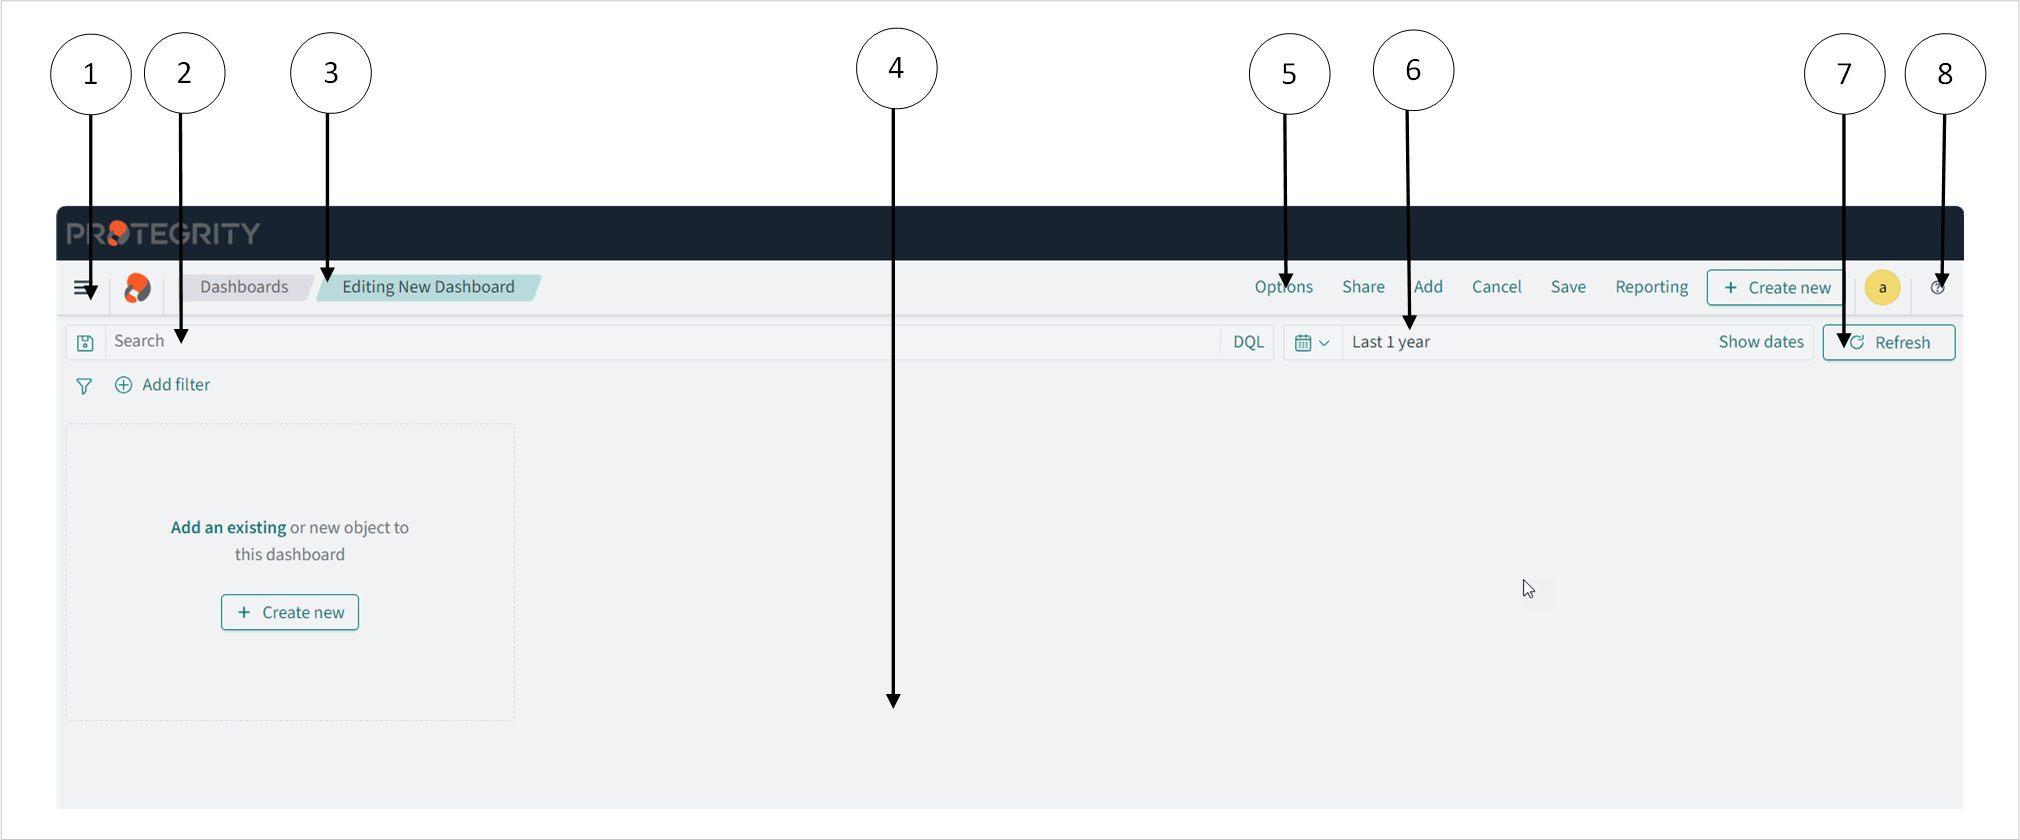
The Audit Store Dashboard appears as shown in the following figure.

The following components are displayed on the screen.
| Callout | Element | Description |
|---|---|---|
| 1 | Navigation panel | The menu displays the different Insight applications, such as, dashboards, reports, and alerts. |
| 2 | Search bar | The search bar helps find elements and run queries. Use filters to narrow the search results. For more information about building queries, refer to https://opensearch.org/docs/latest/dashboards/dql/. |
| 3 | Bread crumb | The menu is used to quickly navigate across screens. |
| 4 | Panel | The stage is the area to create and view visualizations and log information. |
| 5 | Toolbar | The toolbar lists the commands and shortcuts for performing tasks. |
| 6 | Time filter | The time filter specifies the time window for viewing logs. Update the filter if logs are not visible. Use the Quick Select menu to select predefined time periods. |
| 7 | Refresh button | The Refresh button refreshes the information on the page. Use this button to refresh the query results after updating the query parameters, such as, applying time filters. |
| 8 | Help | The help menu provides access to the online documentation that is provided by OpenSearch and to view the OpenSearch community forums. The Open an issue in GitHub link allows you to submit issue requests to OpenSearch. |
Accessing the help
The Insight Dashboard helps visualize log data and information. Use the help documentation provided by Insight to configure and create visualizations.
To access the help:
Open the Audit Store Dashboards.
Click the Help icon from the upper-right corner of the screen.
Click Documentation.
Alternatively, navigate to https://opensearch.org/docs/latest/dashboards/.