Working with CloudWatch Console
AWS CloudWatch tool is used for monitoring applications. Using CloudWatch, you can monitor and store the metrics and logs for analyzing the resources and applications.
CloudWatch allows you to collect metrics and track them in real-time. Using this service you can configure alarms for the metrics. CloudWatch provides visibility into the various aspects of your services including the operational health of your device, performance of the applications, and resource utilization.
For more information about AWS CloudWatch, refer to the following link:
https://docs.aws.amazon.com/AmazonCloudWatch/latest/monitoring/WhatIsCloudWatch.html
CloudWatch logs help you to monitor a cumulative list of all the logs from different applications on a single dashboard. This provides a central point to view and search the logs which are displayed in the order of the time when they were generated. Using CloudWatch you can store and access your log files from various sources. CloudWatch allows you to query your log data, monitor the logs which are originating from the instances and events, and retain and archive the logs.
For more information about CloudWatch logs, refer to the following link:
https://docs.aws.amazon.com/AmazonCloudWatch/latest/logs/WhatIsCloudWatchLogs.html
Prerequisites
For using AWS CloudWatch console, ensure that the IAM role or IAM user that you want to integrate with the appliance must have CloudWatchAgentServerPolicy policy assigned to it.
For more information about using the policies with the IAM Role or IAM User, refer to the following link:
https://docs.aws.amazon.com/AmazonCloudWatch/latest/monitoring/create-iam-roles-for-cloudwatch-agent.html
1 - Integrating CloudWatch with Protegrity Appliance
You must enable CloudWatch integration to use the AWS CloudWatch services. This helps you to send the metrics and the logs from the appliances to the AWS CloudWatch Console.
The following section describes the steps to enable CloudWatch integration on Protegrity appliances.
To enable AWS CloudWatch integration:
Login to the ESA CLI Manager.
To enable AWS CloudWatch integration, navigate to Tools > Cloud Utility AWS Tools > CloudWatch Integration.
Enter the root credentials.
The following screen appears.
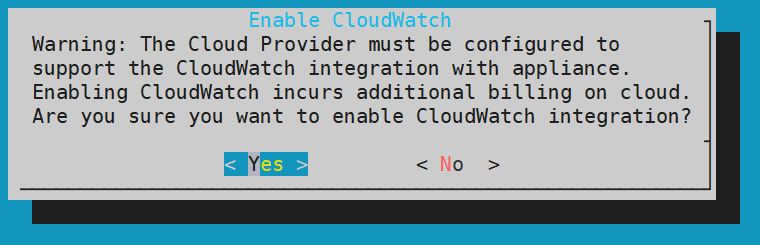
The warning message is displayed due to the cost involved from AWS.
For more information about the cost of integrating CloudWatch, refer to the following link:
https://aws.amazon.com/cloudwatch/pricing/
Select Yes and press ENTER.
A screen listing the logs that are being sent to the CloudWatch Console appears.
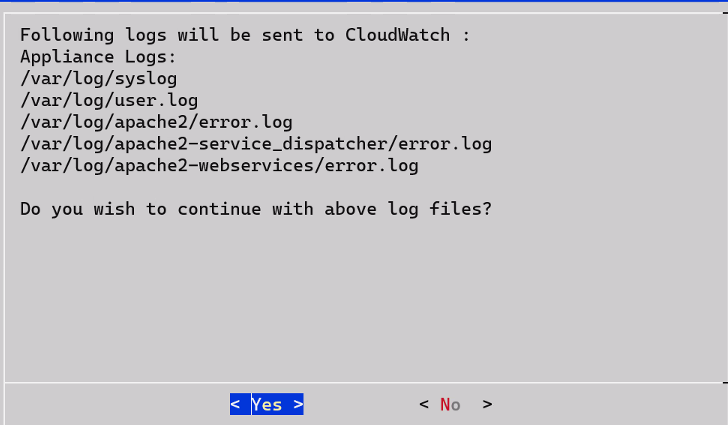
Select Yes.
Wait till the following screen appears.
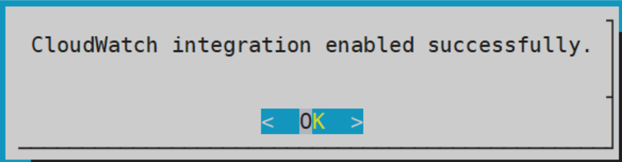
Select OK.
CloudWatch integration is enabled successfully. The CloudWatch service is enabled on the Web UI and CLI.
2 - Configuring Custom Logs on AWS CloudWatch Console
You can send logs from an appliance which is on-premise or launched on any of the cloud platforms, such as, AWS, GCP, or Azure. The logs are sent from the appliances and stored on the AWS CloudWatch Console. By default, the following logs are sent from the appliances:
- Syslogs
- Current events logs
- Apache2 error logs
- Service dispatcher error logs
- Web services error logs
You can send custom log files to the AWS CloudWatch Console. To send custom log files to the AWS CloudWatch Console, you must create a file in the /opt/aws/pty/cloudwatch/config.d/ directory. You can add or edit the log streams in this file to generate the custom logs with the following parameters.
You must not edit the default configuration file, appliance.conf, in the /opt/aws/pty/cloudwatch/config.d/ directory.
The following table explains the parameters that you must use to configure the log streams.
| Parameter | Description | Example |
|---|
| file_path | Location where the file or log is stored | “/var/log/appliance.log” |
| log_stream_name | Name of the log that will appear on the AWS CloudWatch Console | “Appliance_Logs” |
| log_group_name | Name under which the logs are displayed on the CloudWatch Console | - On the CloudWatch Console, the logs appear under the hostname of the ESA instance.- Ensure that you must not modify the parameter log_group_name and its value {hostname}. |
Sample configuration files
Do not edit the appliance.conf configuration file in the /opt/aws/pty/cloudwatch/config.d/ directory.
If you want to configure a new log stream, then you must use the following syntax:
[
    {
            "file_path": "<path_of_the_first_log_file>",
            "log_stream_name": "<Name_of_the_log_stream_to_be_displayed_in_CloudWatch>",
            "log_group_name": "{hostname}"
    },
                .
                .
                .
    {
            "file_path": "<path_of_the_nth_log_file>",
            "log_stream_name": "<Name_of_the_log_stream_to_be_displayed_in_CloudWatch>",
            "log_group_name": "{hostname}"
    }
]
The following snippet displays the sample configuration file, configuration_filename.conf, that sends appliance logs to the AWS CloudWatch Console.
[
    {
            "file_path": "/var/log/syslog",
            "log_stream_name": "Syslog",
            "log_group_name": "{hostname}"
    },
    {
            "file_path": "/var/log/user.log",
            "log_stream_name": "Current_Event_Logs",
            "log_group_name": "{hostname}"
    }
]
If you configure custom log files to send to CloudWatch Console, then you must reload the CloudWatch integration or restart the CloudWatch service. Also, ensure that the CloudWatch integration is enabled and running.
For more information about Reloading AWS CloudWatch Integration, refer to Reloading AWS CloudWatch Integration.
3 - Toggling the CloudWatch Service
In the Protegrity appliances, the Cloudwatch service enables the transmission of logs from the appliances to the AWS CloudWatch Console. Enabling the AWS Cloudwatch Integration also enables this service with which you can start or stop the logs from being sent to the AWS CloudWatch Console. The following sections describe how to toggle the CloudWatch service for pausing or continuing log transmission. The toggling can be performed in either the CLI Manager or the Web UI.
Before you begin
Ensure that the valid AWS credentials are configured before toggling the CloudWatch service.
For more information about
Starting or Stopping the CloudWatch Service from the Web UI
If you want to temporarily stop the transmission of logs from the appliance to the AWS Console, then you can stop the CloudWatch Service.
To start or stop the AWS CloudWatch service from the Web Ui:
Login to the Appliance Web UI.
Navigate to System > Services.
Locate the CloudWatch service to start or stop. Select the appropriate icon, either Start or Stop, to perform the desired action.
- Select Stop to stop the transmission of logs and metrics.
- Select Start or Restart to start the CloudWatch service.
Starting or Stopping the CloudWatch Service from the CLI Manager
If you want to temporarily stop the transmission of logs from the appliance to the AWS Console, then you can stop the CloudWatch Service.
To start or stop the AWS CloudWatch service from the CLI Manager:
Login to the appliance CLI Manager.
Navigate to Administration > Services.
Locate the CloudWatch service to start or stop. Select the appropriate icon, either Start or Stop, to perform the desired action.
- Select Stop to stop the transmission of logs and metrics.
- Select Start to start the CloudWatch service.
4 - Reloading the AWS CloudWatch Integration
If you want to update the existing configurations in the /opt/aws/pty/cloudwatch/config.d/ directory, then you must reload the CloudWatch integration.
To reload the AWS CloudWatch integration:
Login to the ESA CLI Manager.
To reload CloudWatch, navigate to Tools > Cloud Utility AWS Tools > CloudWatch Integration.
Enter the root credentials.
The following screen appears.
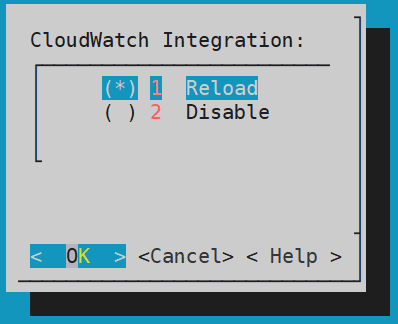
Select Reload and press ENTER.
The logs are updated and sent to the AWS CloudWatch Console.
5 - Viewing Logs on AWS CloudWatch Console
After performing the required changes on the CLI Manager, the logs are visible on the CloudWatch Console.
To view the logs on the CloudWatch console:
Login to the AWS Web UI.
From the Services tab, navigate to Management & Governance > CloudWatch.
To view the logs, from the left pane navigate to Logs > Log groups.
Select the required log group. The name of the log group is the same as the hostname of the appliance.
To view the logs, select the required log stream from the following screen.
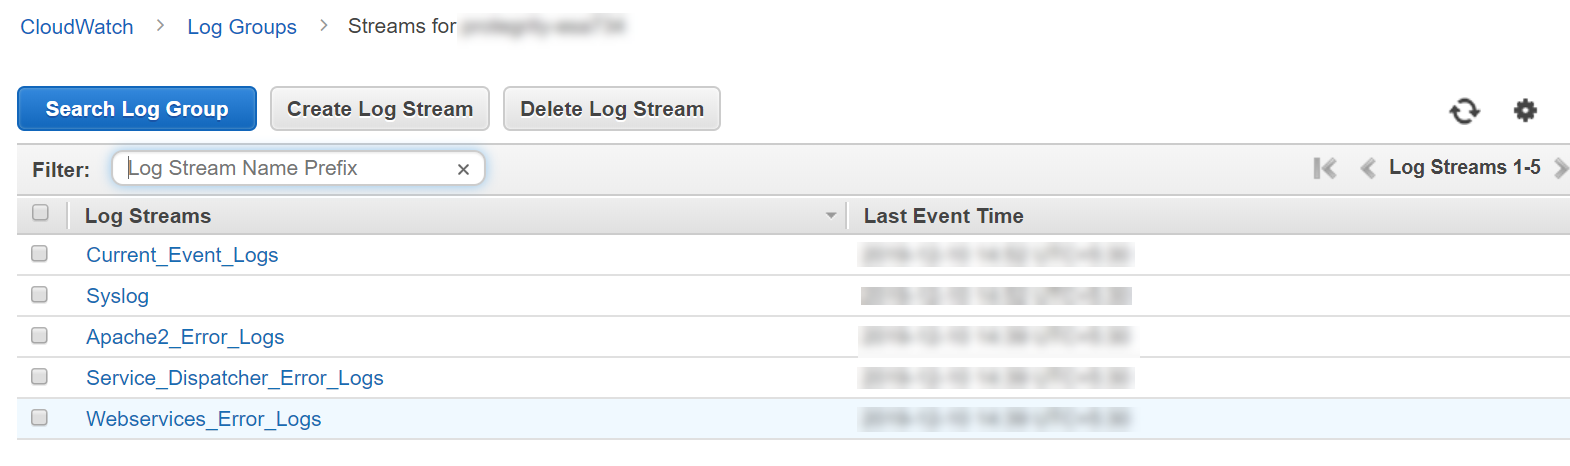
6 - Working with AWS CloudWatch Metrics
The metrics for the following entities in the appliances are sent to the AWS CloudWatch Console.
| Metrics | Description |
|---|
| Memory Use Percent | Percentage of the memory that is consumed by the appliance. |
| Disk I/O | Bytes and packets read and written by the appliance.You can view the following parameters:- write_bytes- read_bytes- writes- reads |
| Network | Bytes and packets sent and received by the appliance.You can view the following parameters:- bytes_sent- bytes_received- packets_sent- packets_received |
| Disk Used Percent | Percentage of the disk space that is consumed by the appliance. |
| CPU Idle | Percentage of time for which the CPU is idle. |
| Swap Memory Use Percent | Percentage of the swap memory that is consumed by the appliance. |
Unlike logs, you cannot customize the metrics that you want to send to CloudWatch. If you want to customize these metrics, then contact Protegrity Support.
7 - Viewing Metrics on AWS CloudWatch Console
To view the metrics on the CloudWatch console:
Login to the AWS Web UI.
From the Services tab, navigate to Management & Governance > CloudWatch.
To view the metrics, from the left pane navigate to Metrics > All metrics.
Navigate to AWS namespace.
The following screen appears.
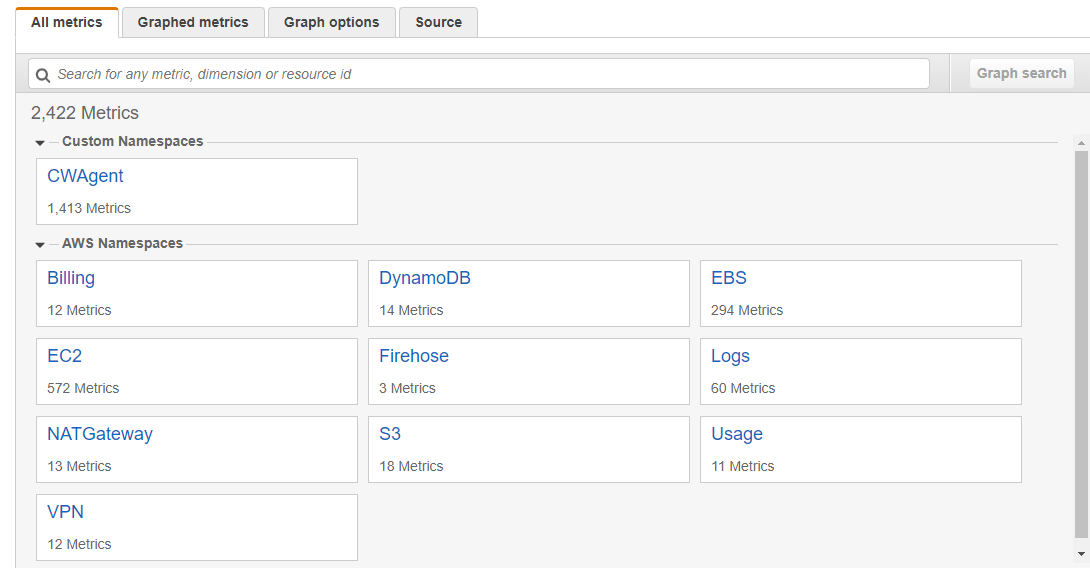
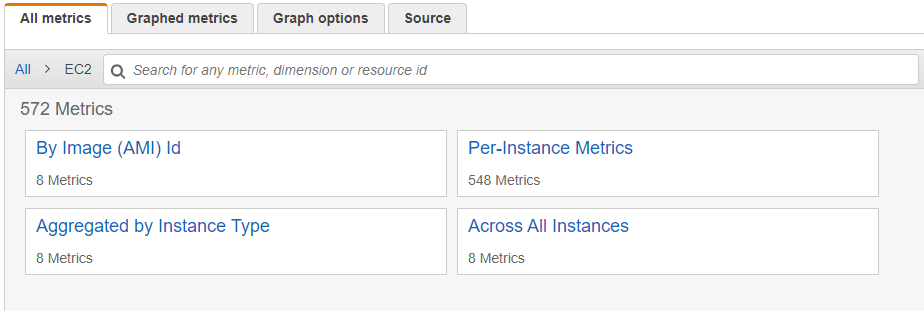
Select EC2.
Select the required metrics from the following screen.
To view metrics of the Protegrity appliances that are on-premise or other cloud platforms, such as Azure or GCP, navigate to Custom namespace > CWAgent.
The configured metrics appear.
8 - Disabling AWS CloudWatch Integration
If you want stop the logs and metrics that are being sent to the AWS CloudWatch Console. To disintegrate the Cloudwatch removing the service from the appliance. Then, disable the AWS CloudWatch integration from the appliance. As a result, the CloudWatch service is removed from the Services screen of the Web UI and the CLI Manager.
To disable the AWS CloudWatch integration:
Login to the ESA CLI Manager.
To disable CloudWatch, navigate to Tools > Cloud Utility AWS Tools > CloudWatch Integration.
The following screen appears.
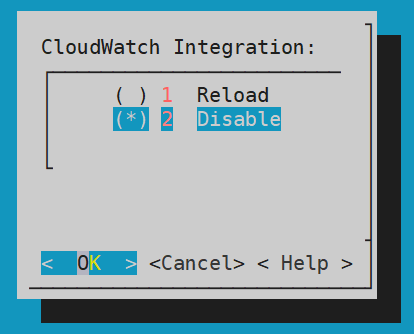
Select Disable and press ENTER.
The logs from the appliances are not updated in the AWS CloudWatch Console and the CloudWatch Integration is disabled.
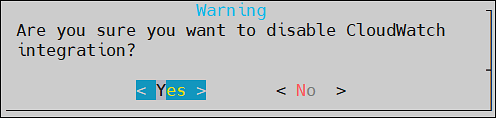
A warning screen with message Are you sure you want to disable CLoudWatch integration? appears. Select Yes and press Enter.
The CloudWatch integration disabled successfully message appears. Click Ok.
The AWS CloudWatch integration is disabled.
After disabling CloudWatch integration, you must delete the Log groups and Log streams from the AWS CloudWatch console.