Description of ESA Web UI
The ESA Web UI appears upon successful login. This page shows the Host to which you are attached, IP address, and the current user logged on.
This operation might require a few minutes to begin.
The different menu options are given in the following table.
| Option | Using this navigation menu you can | Applicable to |
|---|---|---|
| Dashboard | A view-only window, which provides status at a glance – service, server, notifications, disk usage, and graphical representation of CPU, memory, and network usage. | All |
| Policy Management | Used to create data stores, data elements, masks, roles, keys, and deploy a policy. | ESA |
| Key Management | Used to view information, rotate, or change the key states of the Master Key, Repository Key, and Data Store Keys. View information for the active Key Store or switch the Key Store. | ESA |
| System |
| All |
| Logs | Used to view logs for separate tasks such as web services engine, policy management, DFSFP, and Appliance. | ESA |
| Settings |
| All |
| Audit Store | A repository for all audit data and logs. It is used to initialize analytics, view and analyze Insight dashboards, and manage cluster. | ESA |
| Cloud Gateway | Used to create certificate, tunnel, service, Rules for traffic flow management, add DSG nodes to cluster, monitor cluster health, view logs. | DSG |
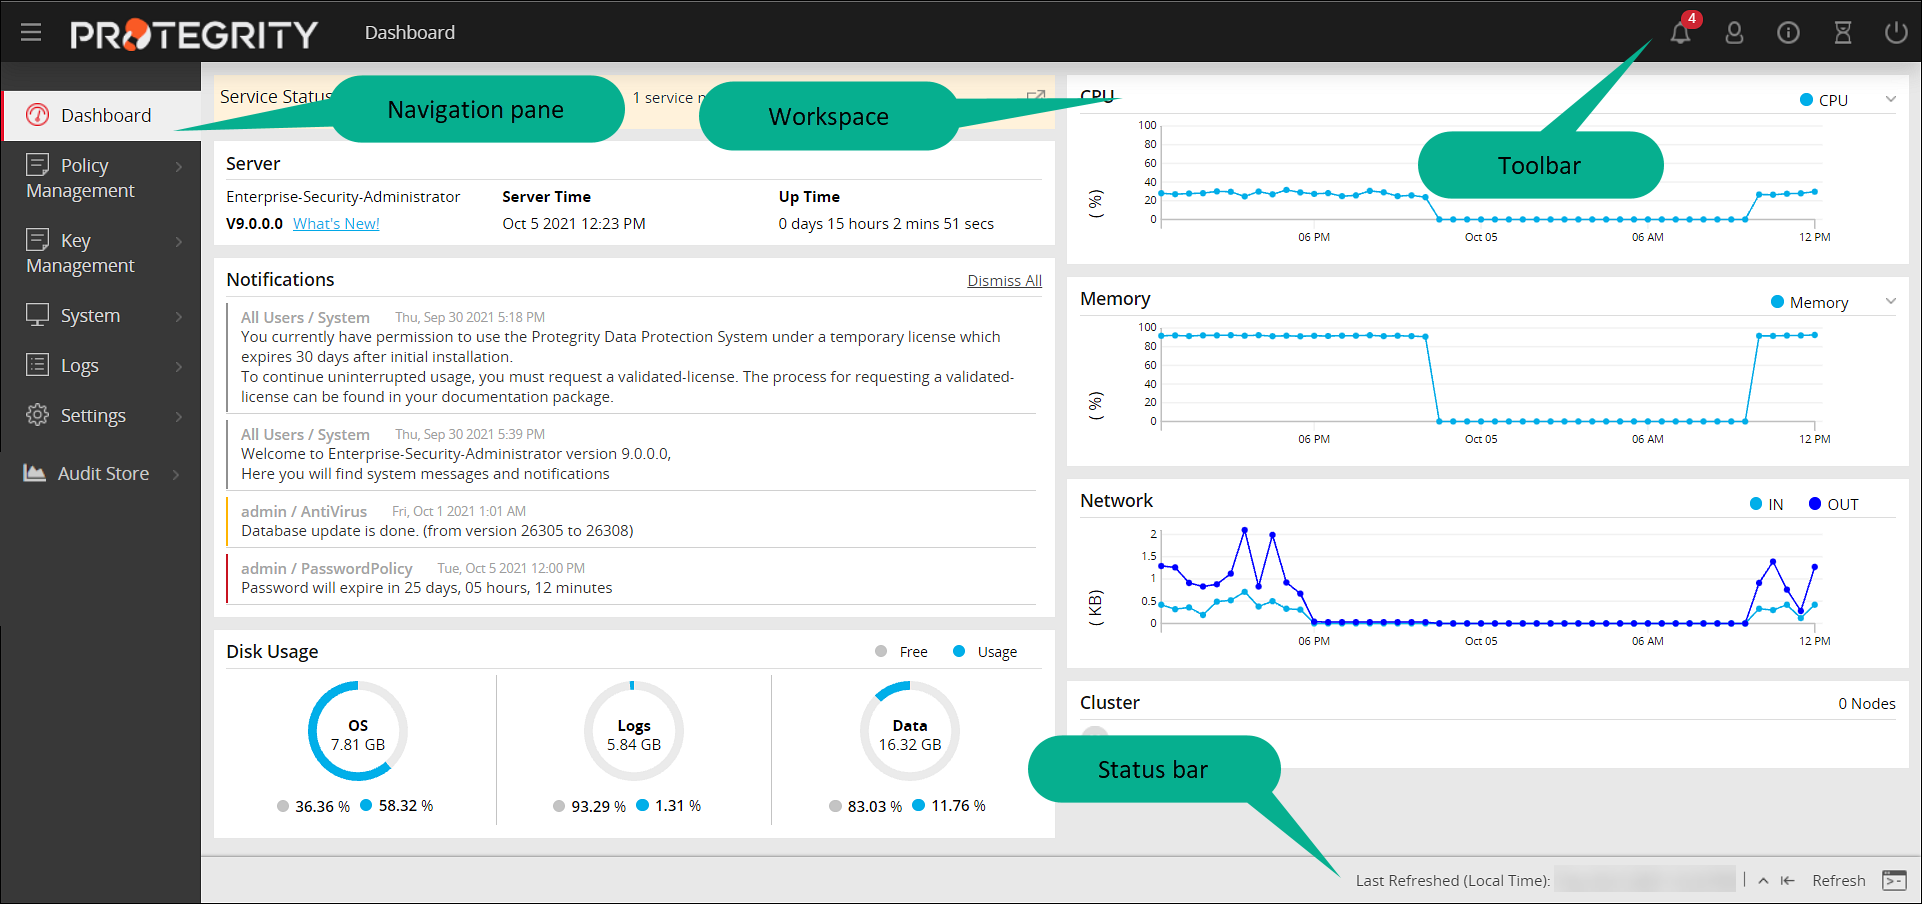
The following graphic illustrates the different panes in the ESA Web UI.
| Component | Description |
|---|---|
| Navigation Pane | The number of options in the navigation menu depends on the installed ESA. The functionality is also restricted based on the user permissions. You could have read-write or read-only permissions for certain options. Using the different options, you can create a policy, add a user, run a few security checks such as file integrity or scan for virus, review or change the network settings, among others. |
| Workspace | This window on the right includes either displayed information or fields where information needs to be added. When an option is selected, the resulting window appears. |
| Status Bar | The bar at the bottom displays the last refresh activity time. Also, if you click the rectangle a separate ESA CLI screen opens. All these options are available in the CLI screen as well. |
| Toolbar | This bar at the top displays the name of the currently open window on the left and icons on the right. |
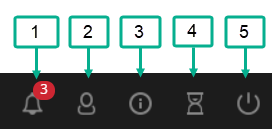
The details of the icons in the toolbar is as follows:
| Component | Icon Name | Description |
|---|---|---|
| 1 | Notification | The number is the total number of unopened messages for you. |
| 2 | User | Change your password or log out as a user. ESA continues to run. |
| 3 | Help | Download the file(s) that are required by Protegrity Support for troubleshooting, view the product documentation, and view the version information about the ESA and its components. |
| 4 | Session | Extend the session without timing out. You have to enter your credentials again to login. |
| 5 | Power Option | Reboot or shut down the ESA, after ensuring that the ESA is not being used. |
Support
The Help option on the toolbar, allows you to download information about the status of the ESA and other services that is sometimes required by Protegrity Services to troubleshoot.
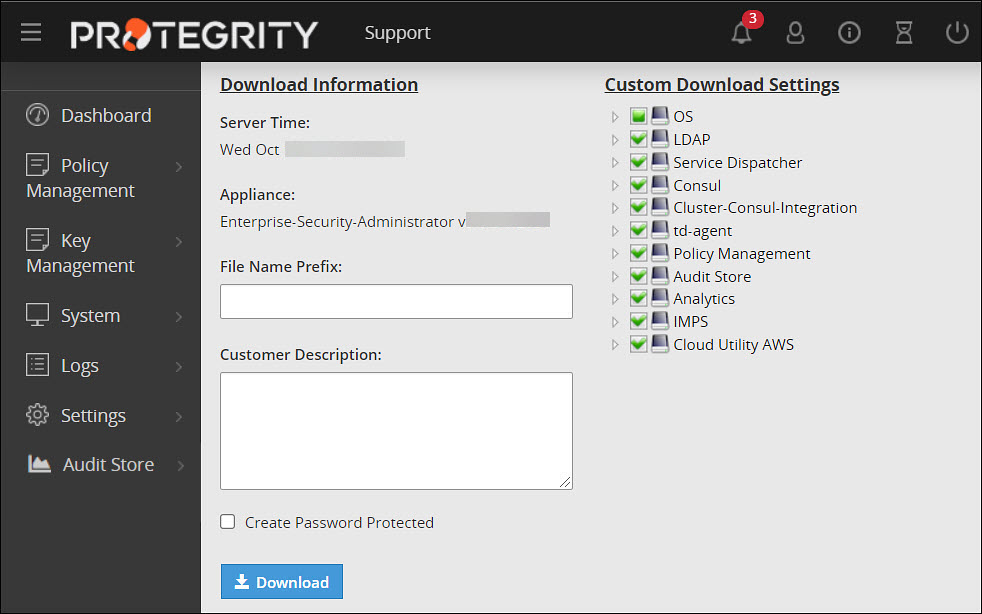
Check the boxes that you require and optionally provide a prefix to the automatically generated file name. You may optionally add a description and protect the resulting zip file and all the xml files inside with a password.
Viewing Version of the Installed Components of the ESA
The  > About option on the toolbar allows you to view the version information about the ESA and its components.
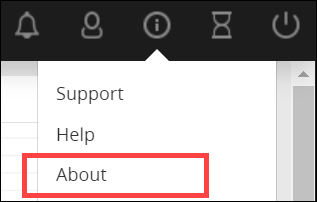
The following figure shows the version information of the installed components of the ESA.
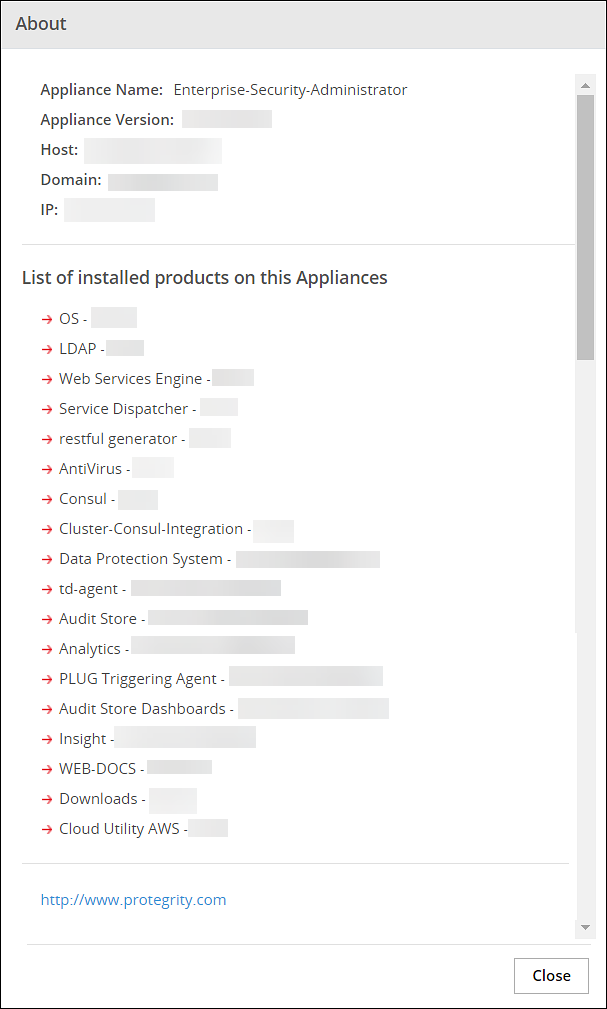
For example, you can view the version of the Data Protection System (DPS) that is being used.
Extending Timeout from ESA
The following icons are available on the top right corner of the ESA Web UI page.

The hourglass icon enables you to extend the working time for the ESA. To extend the timeout for the ESA Web UI, click on the hourglass icon.
A message appears mentioning Session timeout extended successfully.
Feedback
Was this page helpful?