Working with Protegrity visualizations
The configuration of visualizations created in the earlier versions of the Audit Store Dashboards are retained after the ESA is upgraded. Protegrity provides default visualizations with version 10.1.0. If the title of an existing visualization matches the new visualization provided by Protegrity, then a duplicate entry is visible. Use the date and time stamp to identify and rename the existing visualizations.
Do not delete or modify the configuration or details of the visualizations provided by Protegrity. To customize the visualization, create a copy of the visualization and perform the customization on the copy of the visualization.
To view visualizations:
Log in to the ESA.
Navigate to Audit Store > Dashboard.
The Audit Store Dashboards appear in a new window. Click Open in a new tab if the dashboard is not displayed.
From the navigation panel, click Visualize.
Create and view visualizations from here.
Click a visualization to view it.
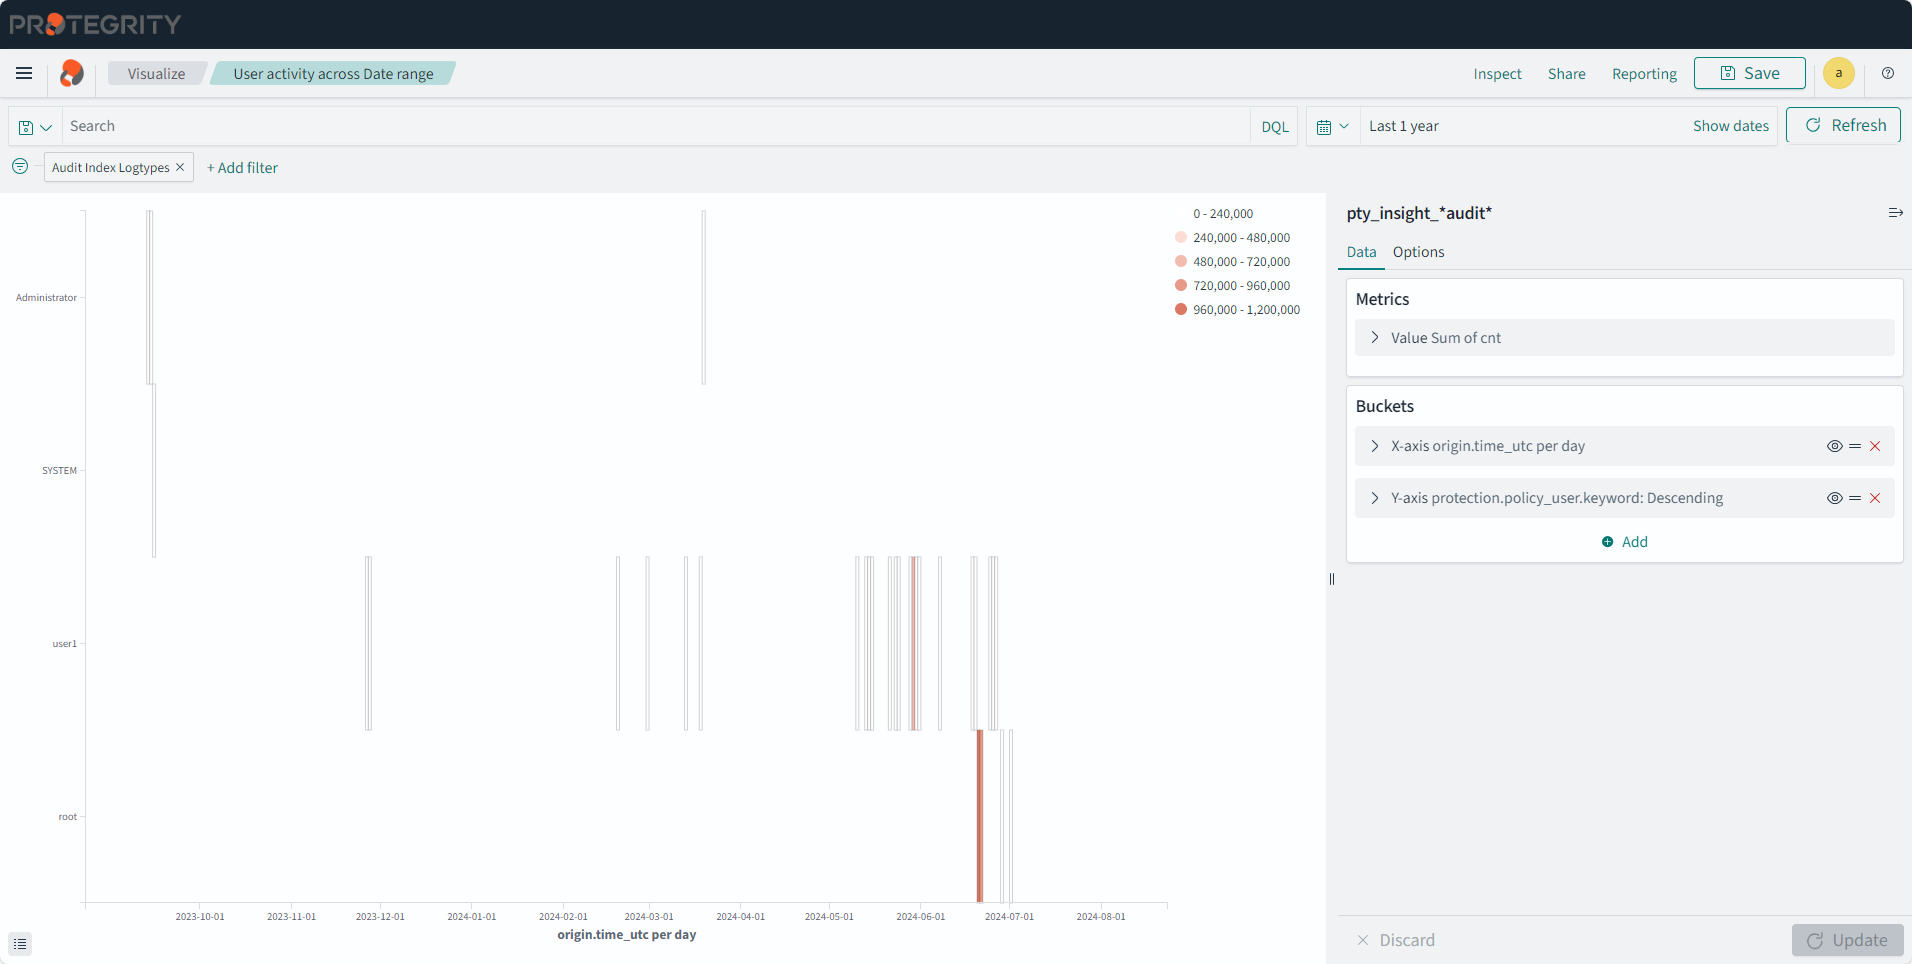
User Activity Across Date Range
Description: The user activity during the date range specified.
- Type: Heat Map
- Filter: Audit Index Logtypes
- Configuration:
- Index: pty_insight_*audit*
- Metrics:
- Value: Sum
- Field: cnt
- Buckets:
- X-axis
- Aggregation: Date Histogram
- Field: origin.time_utc
- Minimum interval: Day
- Y-axis
- Sub aggregation: Terms
- Field: protection.policy_user.keyword
- Order by: Metric:Sum of cnt
- Order: Descending
- Size: 1
- Custom label: Policy Users
- X-axis
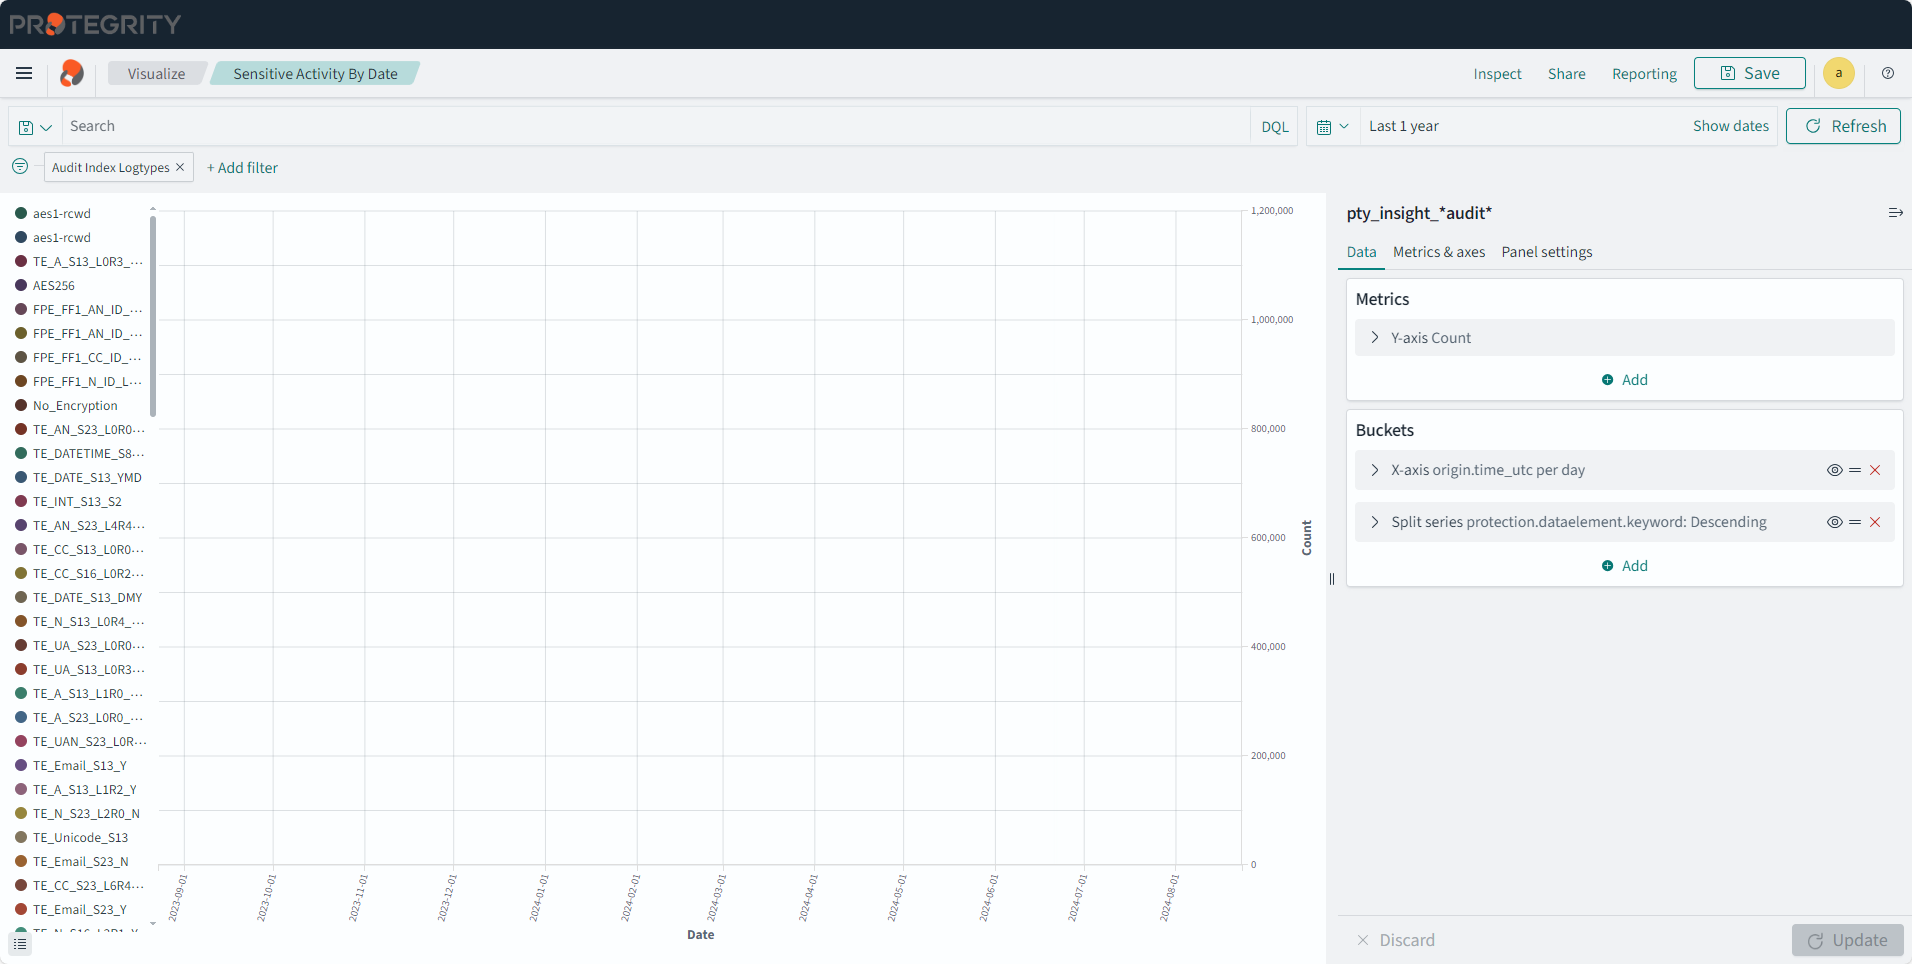
Sensitive Activity by Date
Description: The data element usage on a daily basis.
- Type: Line
- Filter: Audit Index Logtypes
- Configuration:
- Index: pty_insight_*audit*
- Metrics: Y-axis: Count
- Buckets:
- X-axis
- Aggregation: Date Histogram
- Field: origin.time_utc
- Minimum interval: Day
- Custom label: Date
- Split series
- Sub aggregation: Terms
- Field: protection.dataelement.keyword
- Order by: Metric:Count
- Order: Descending
- Size: 10
- Custom label: Operation Count
- X-axis
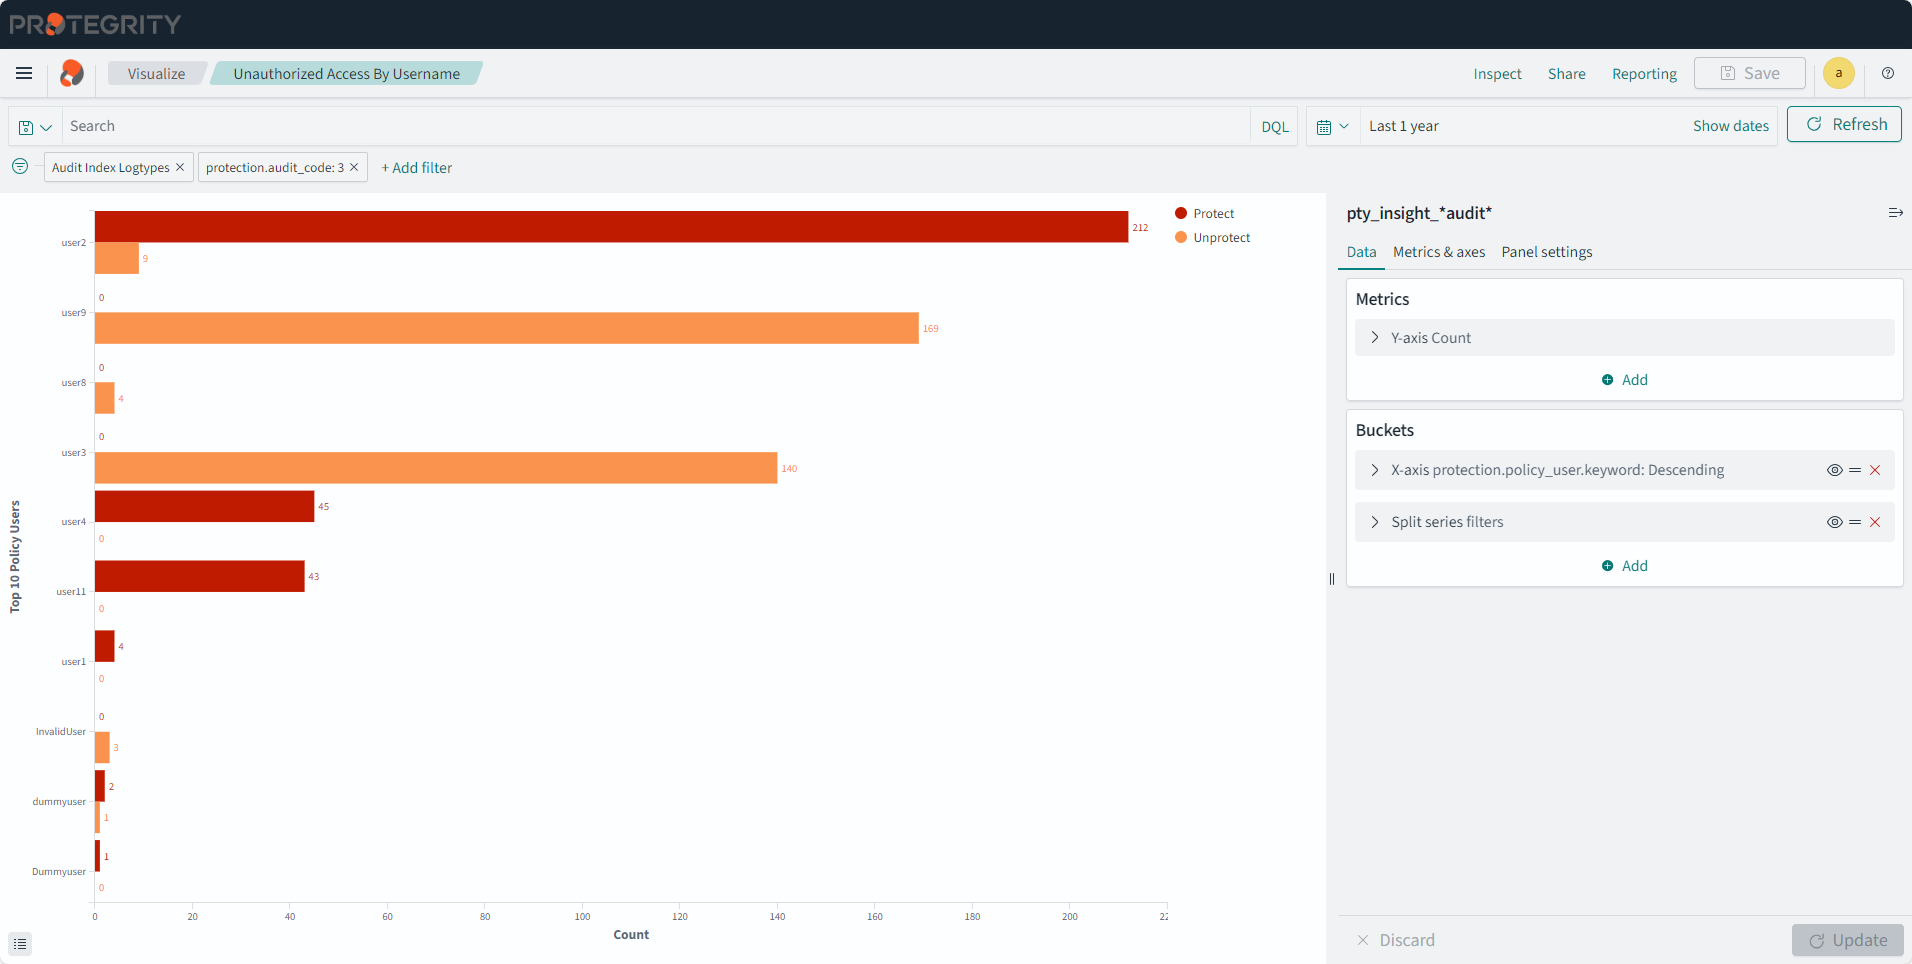
Unauthorized Access By Username
Description: Top 10 Unauthorized Protect and Unprotect operation counts per user.
- Type: Vertical Bar
- Filter 1: Audit Index Logtypes
- Filter 2: protection.audit_code: 3
- Configuration:
- Index: pty_insight_*audit*
- Metrics: Y-axis: Count
- Buckets:
- X-axis
- Aggregation: Terms
- Field: protection.policy_user.keyword
- Order by: Metric:Count
- Order: Descending
- Size: 10
- Custom label: Top 10 Policy Users
- Split series
- Sub aggregation: Filters
- Filter 1-Protect: level=‘Error’
- Filter 2-Unprotect: level=‘WARNING’
- X-axis
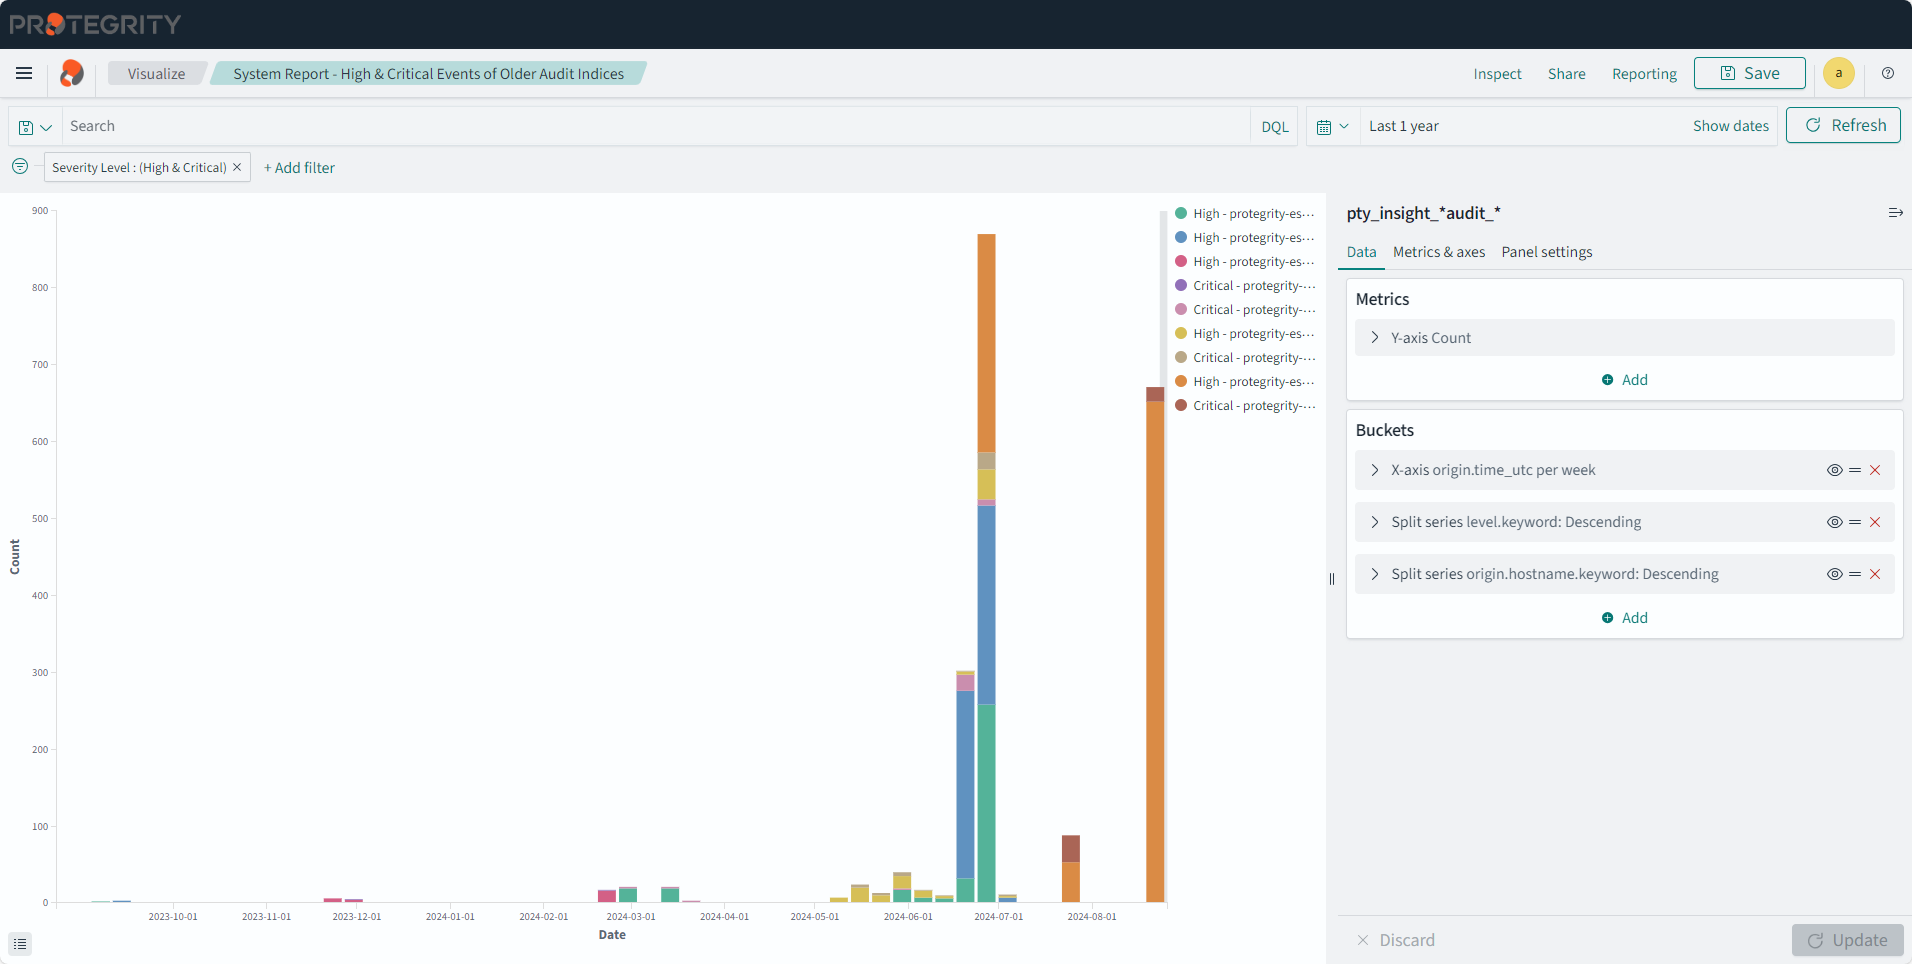
System Report - High & Critical Events of Audit Indices
Description: The chart reporting high and critical events from the Audit index.
- Type: Vertical Bar
- Filter: Severity Level : (High & Critical)
- Configuration:
- Index: pty_insight_analytics*audits_*
- Metrics: Y-axis: Count
- Buckets:
- X-axis
- Aggregation: Date Histogram
- Field: origin.time_utc
- Minimum Interval: Auto
- Custom label: Date
- Split series
- Sub aggregation: Terms
- Field: level.keyword
- Order by: Metric:Count
- Order: Descending
- Size: 20
- Split series
- Sub aggregation: Terms
- Field: origin.hostname.keyword
- Order by: Metric:Count
- Order: Descending
- Size: 50
- Custom label: Server
- X-axis
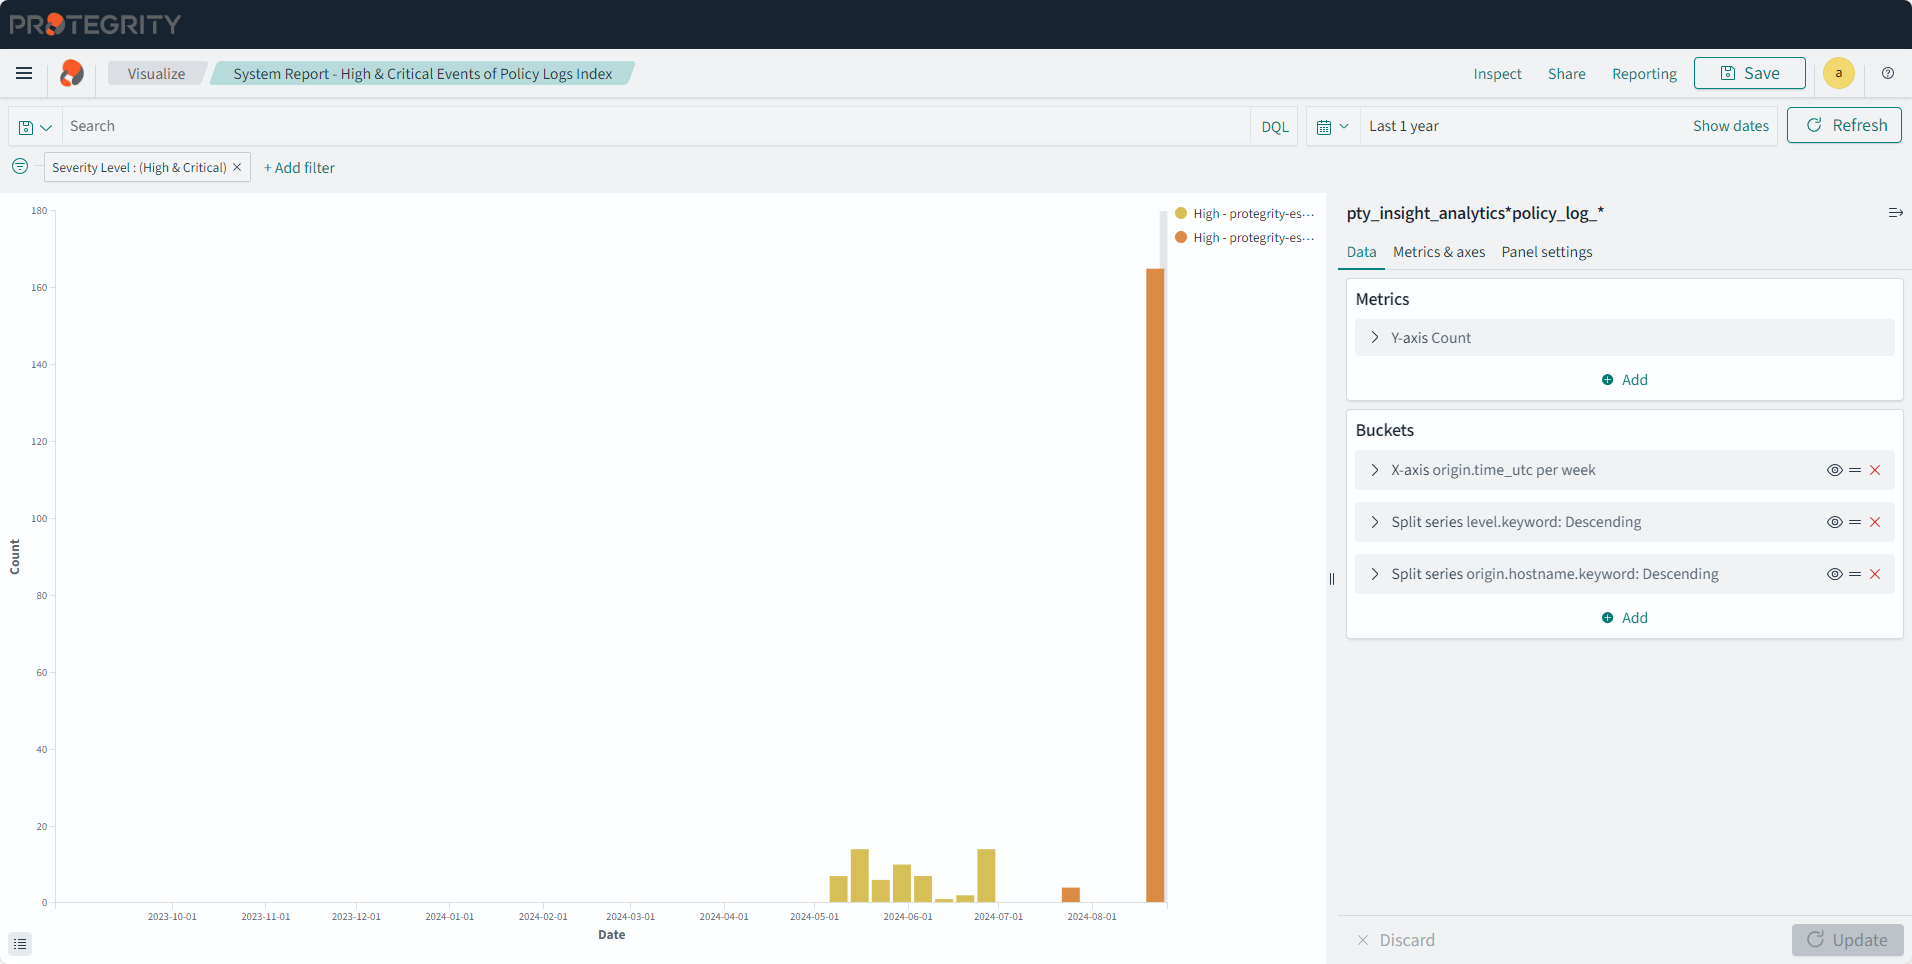
System Report - High & Critical Events of Policy Logs Index
Description: The chart reporting high and critical events from the Policy index.
- Type: Vertical Bar
- Filter: Severity Level : (High & Critical)
- Configuration:
- Index: pty_insight_analytics*policy_log_*
- Metrics: Y-axis: Count
- Buckets:
- X-axis
- Aggregation: Date Histogram
- Field: origin.time_utc
- Minimum Interval: Auto
- Custom label: Date
- Split series
- Sub aggregation: Terms
- Field: level.keyword
- Order by: Metric:Count
- Order: Descending
- Size: 20
- Split series
- Sub aggregation: Terms
- Field: origin.hostname.keyword
- Order by: Metric:Count
- Order: Descending
- Size: 50
- Custom label: Server
- X-axis
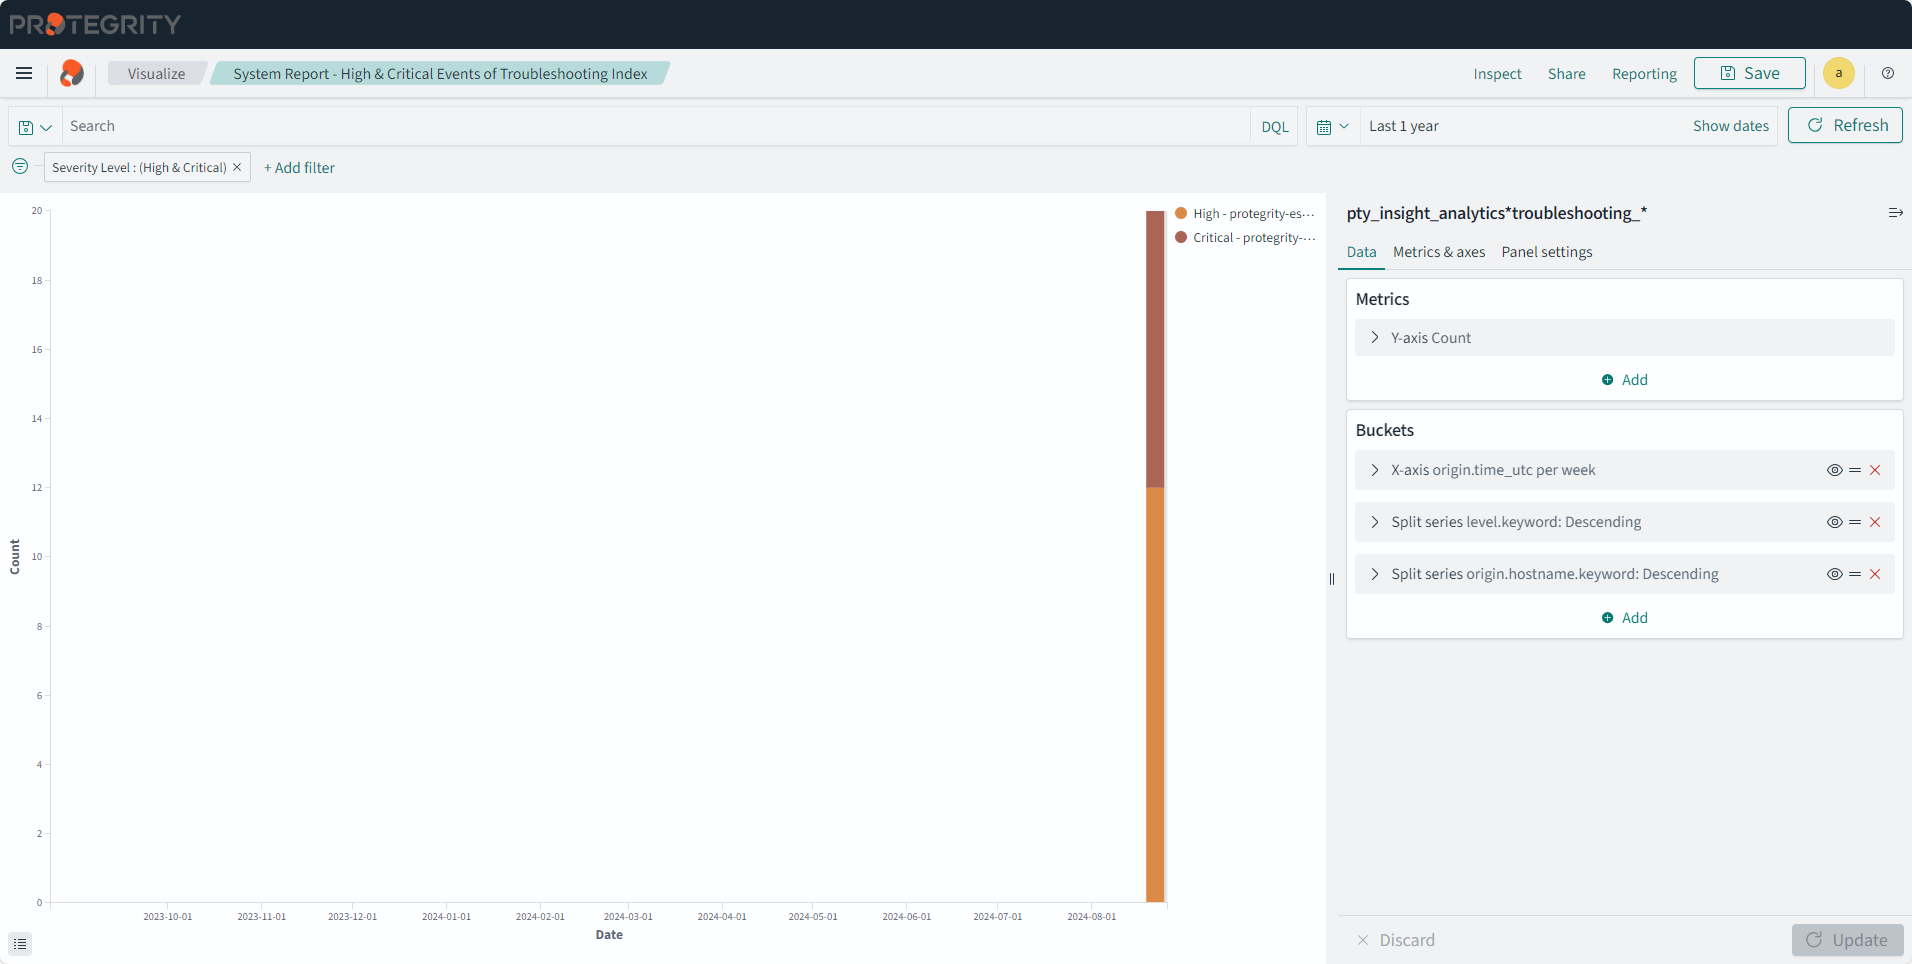
System Report - High & Critical Events of Troubleshooting Logs Index
Description: The chart reporting high and critical events from the Troubleshooting index.
- Type: Vertical Bar
- Filter: Severity Level : (High & Critical)
- Configuration:
- Index: pty_insight_analytics*troubleshooting_*
- Metrics: Y-axis: Count
- Buckets:
- X-axis
- Aggregation: Date Histogram
- Field: origin.time_utc
- Minimum Interval: Auto
- Custom label: Date
- Split series
- Sub aggregation: Terms
- Field: level.keyword
- Order by: Metric:Count
- Order: Descending
- Size: 20
- Split series
- Sub aggregation: Terms
- Field: origin.hostname.keyword
- Order by: Metric:Count
- Order: Descending
- Size: 50
- Custom label: Server
- X-axis
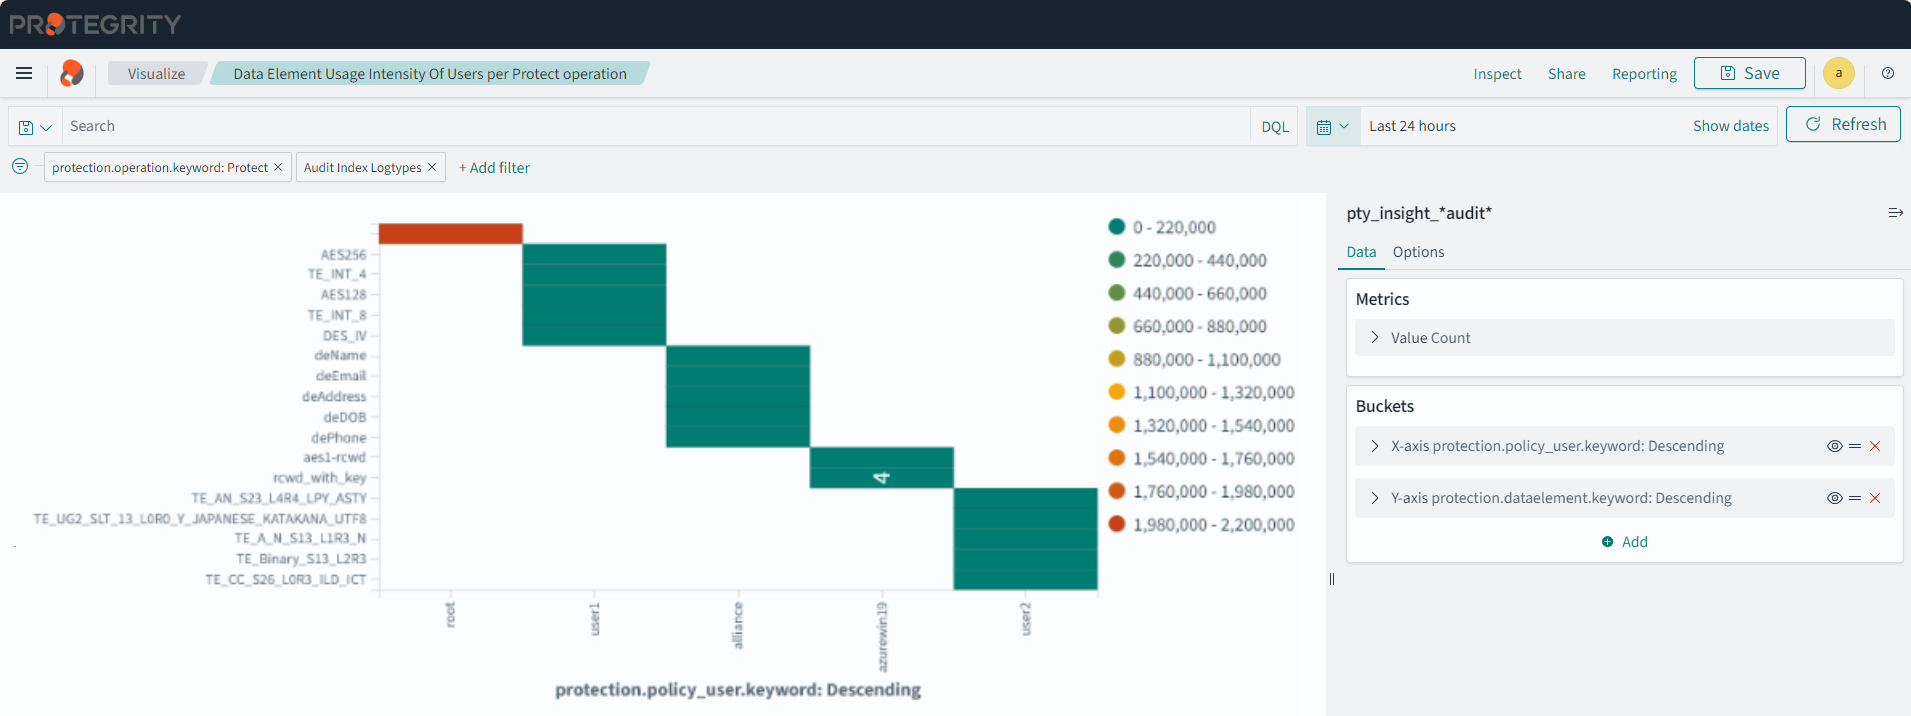
Data Element Usage Intensity Of Users per Protect operation
Description: The chart shows the data element usage intensity of users per protect operation. It displays the top 10 data elements used by the top five users.
- Type: Heat Map
- Filter 1: protection.operation.keyword: Protect
- Filter 2: Audit Index Logtypes
- Configuration:
- Index: pty_insight_*audit*
- Metrics: Y-axis: Count
- Buckets:
- X-axis
- Aggregation: Terms
- Field: protection.policy_user.keyword
- Order by: Metric: Count
- Order: Descending
- Size: 5
- Y-axis
- Sub aggregation: Terms
- Field: protection.dataelement.keyword
- Order by: Metric:Count
- Order: Descending
- Size: 10
- X-axis
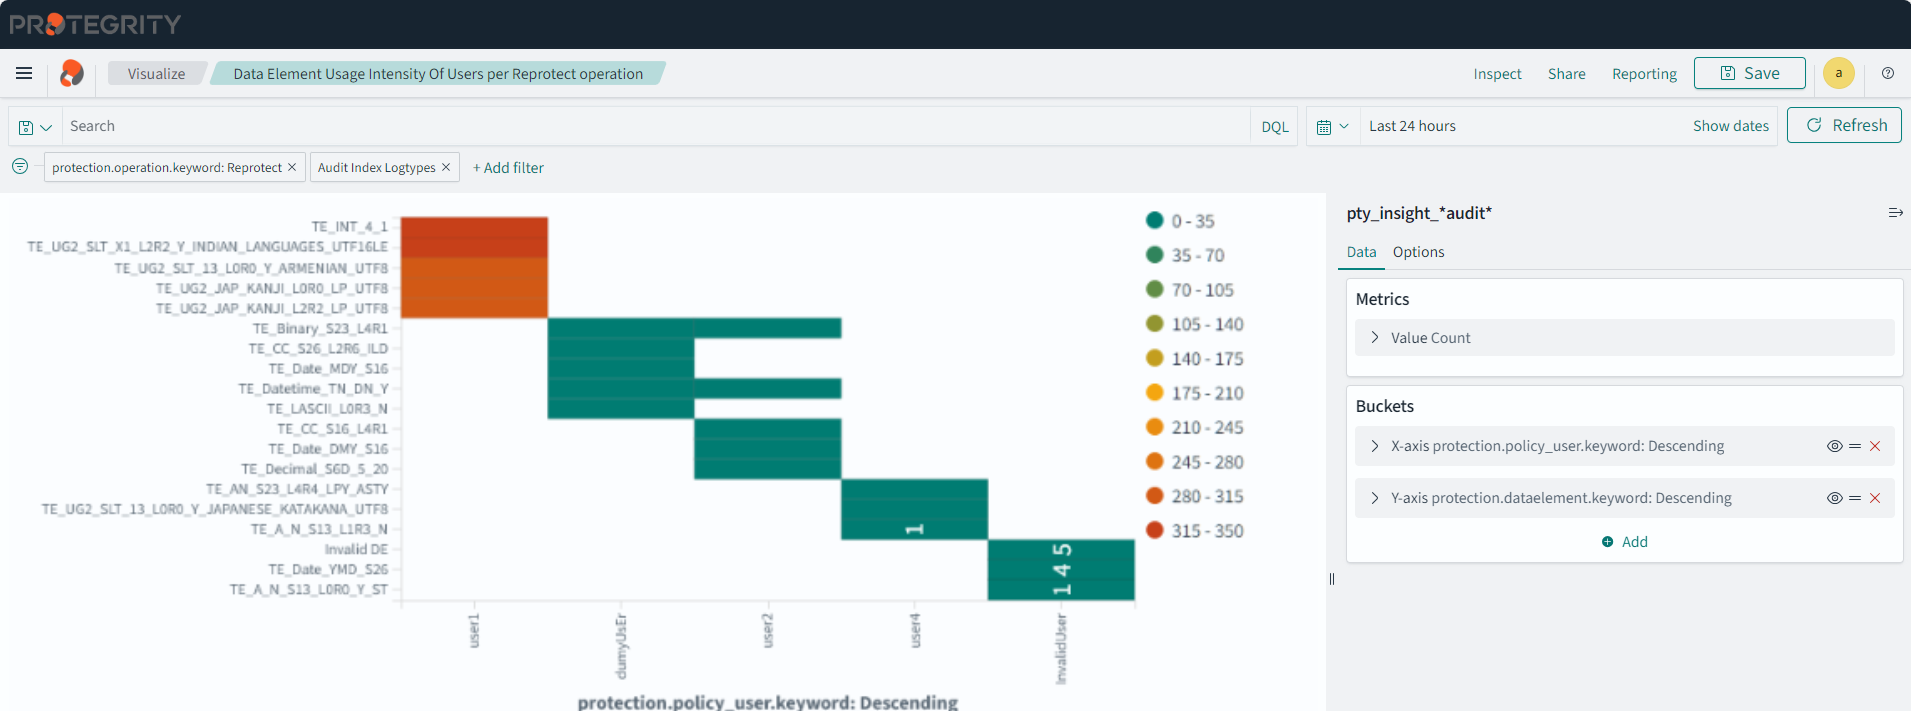
Data Element Usage Intensity Of Users per Reprotect operation
Description: The chart shows the data element usage intensity of users per reprotect operation. It displays the top 10 data elements used by the top five users.
- Type: Heat Map
- Filter 1: protection.operation.keyword: Reprotect
- Filter 2: Audit Index Logtypes
- Configuration:
- Index: pty_insight_*audit*
- Metrics: Y-axis: Count
- Buckets:
- X-axis
- Aggregation: Terms
- Field: protection.policy_user.keyword
- Order by: Metric: Count
- Order: Descending
- Size: 5
- Y-axis
- Sub aggregation: Terms
- Field: protection.dataelement.keyword
- Order by: Metric:Count
- Order: Descending
- Size: 10
- X-axis
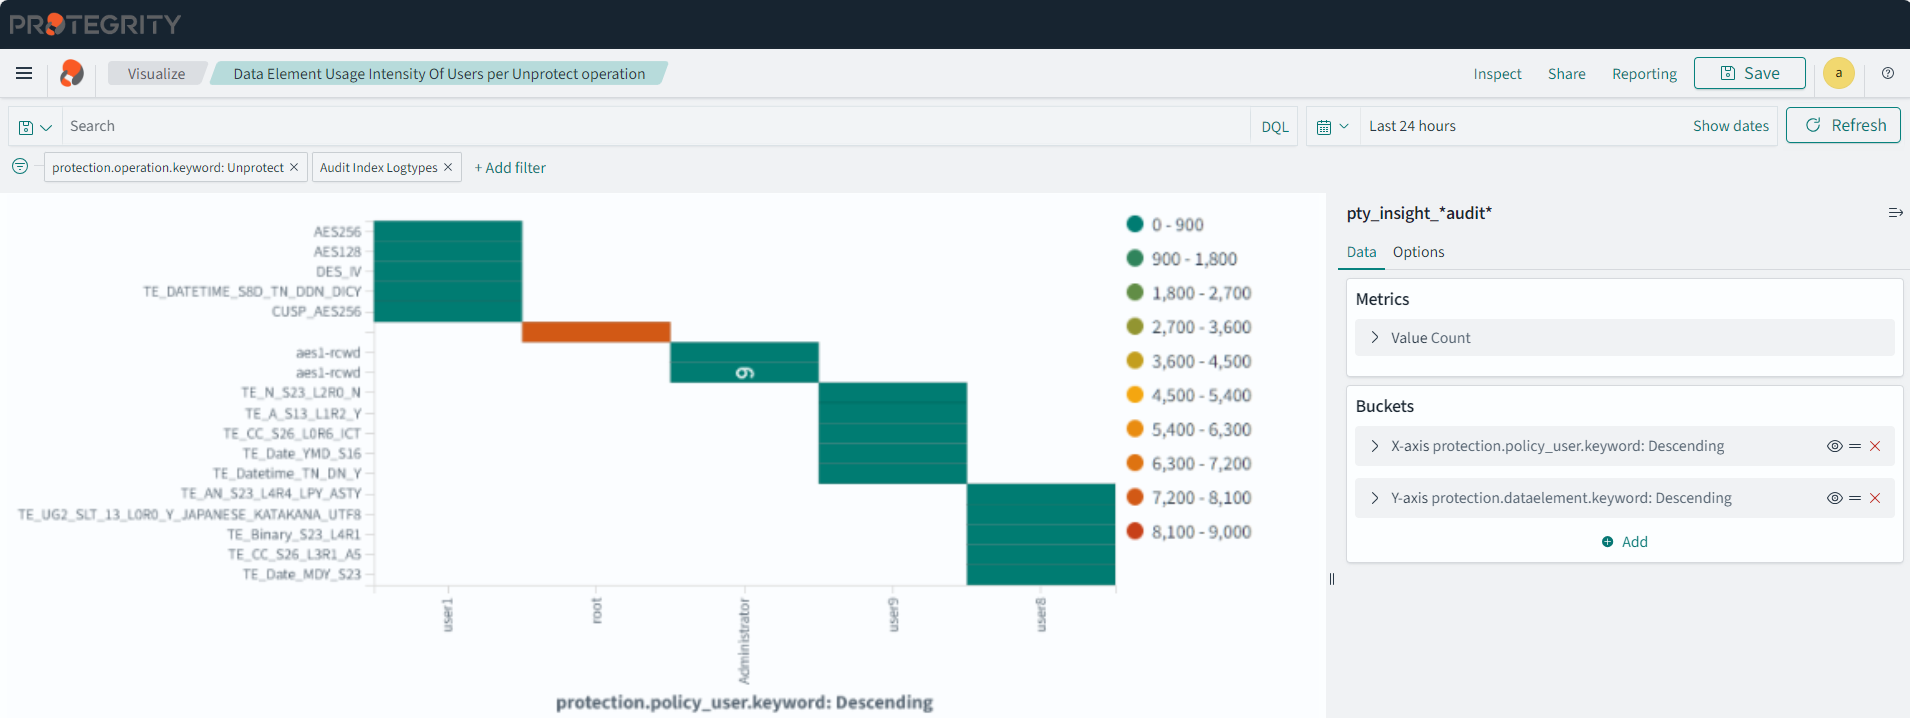
Data Element Usage Intensity Of Users per Unprotect operation
Description: The chart shows the data element usage intensity of users per unprotect operation. It displays the top 10 data elements used by the top five users.
- Type: Heat Map
- Filter 1: protection.operation.keyword: Unprotect
- Filter 2: Audit Index Logtypes
- Configuration:
- Index: pty_insight_*audit*
- Metrics: Y-axis: Count
- Buckets:
- X-axis
- Aggregation: Terms
- Field: protection.policy_user.keyword
- Order by: Metric: Count
- Order: Descending
- Size: 5
- Y-axis
- Sub aggregation: Terms
- Field: protection.dataelement.keyword
- Order by: Metric:Count
- Order: Descending
- Size: 10
- X-axis
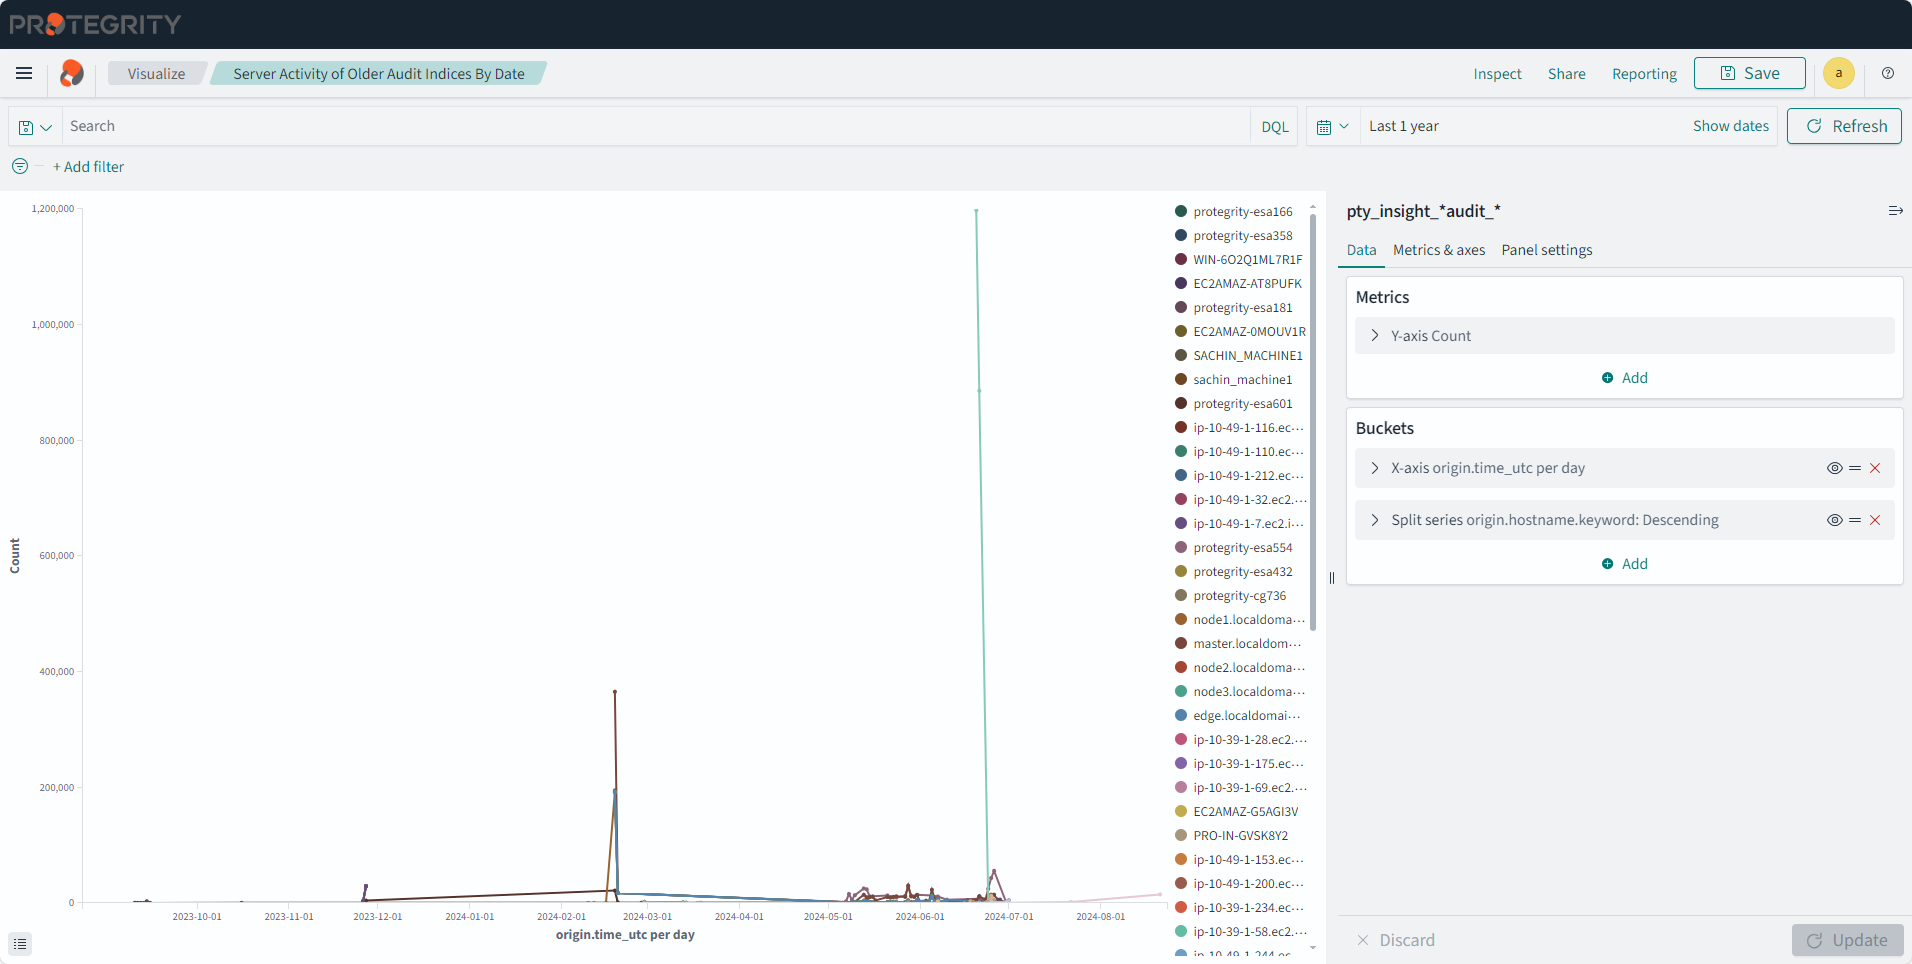
Server Activity of Older Audit Indices By Date
Description: The chart shows the daily count of all events by servers for specific time period from the old audit index.
- Type: Line
- Configuration:
- Index: pty_insight_*audit_*
- Metrics: Y-axis: Count
- Buckets:
- X-axis
- Aggregation: Date Histogram
- Field: origin.time_utc
- Minimum interval: Day
- Split series
- Sub aggregation: Terms
- Field: origin.hostname.keyword
- Order by: Metric:Count
- Order: Descending
- Size: 50
- X-axis
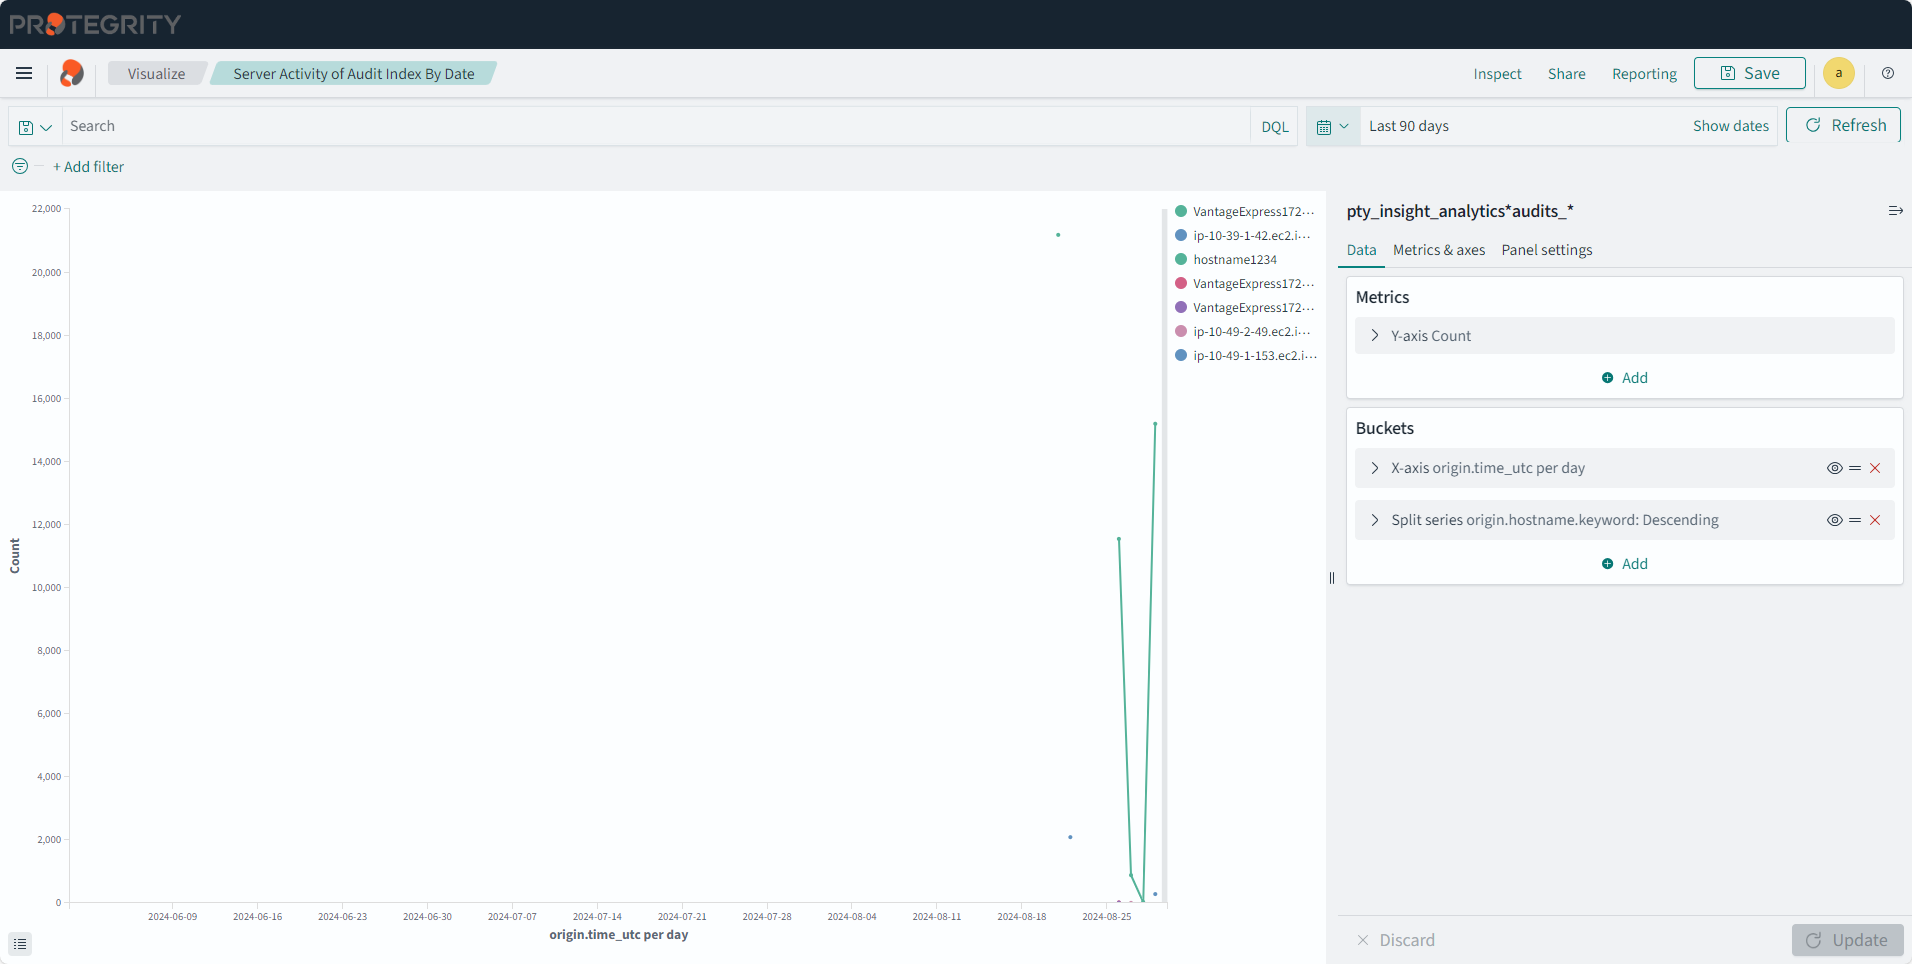
Server Activity of Audit Index By Date
Description: The chart shows the daily count of all events by servers for specific time period from the audit index.
- Type: Line
- Configuration:
- Index: pty_insight_analytics*audits_*
- Metrics: Y-axis: Count
- Buckets:
- X-axis
- Aggregation: Date Histogram
- Field: origin.time_utc
- Minimum interval: Day
- Split series
- Sub aggregation: Terms
- Field: origin.hostname.keyword
- Order by: Metric:Count
- Order: Descending
- Size: 50
- X-axis
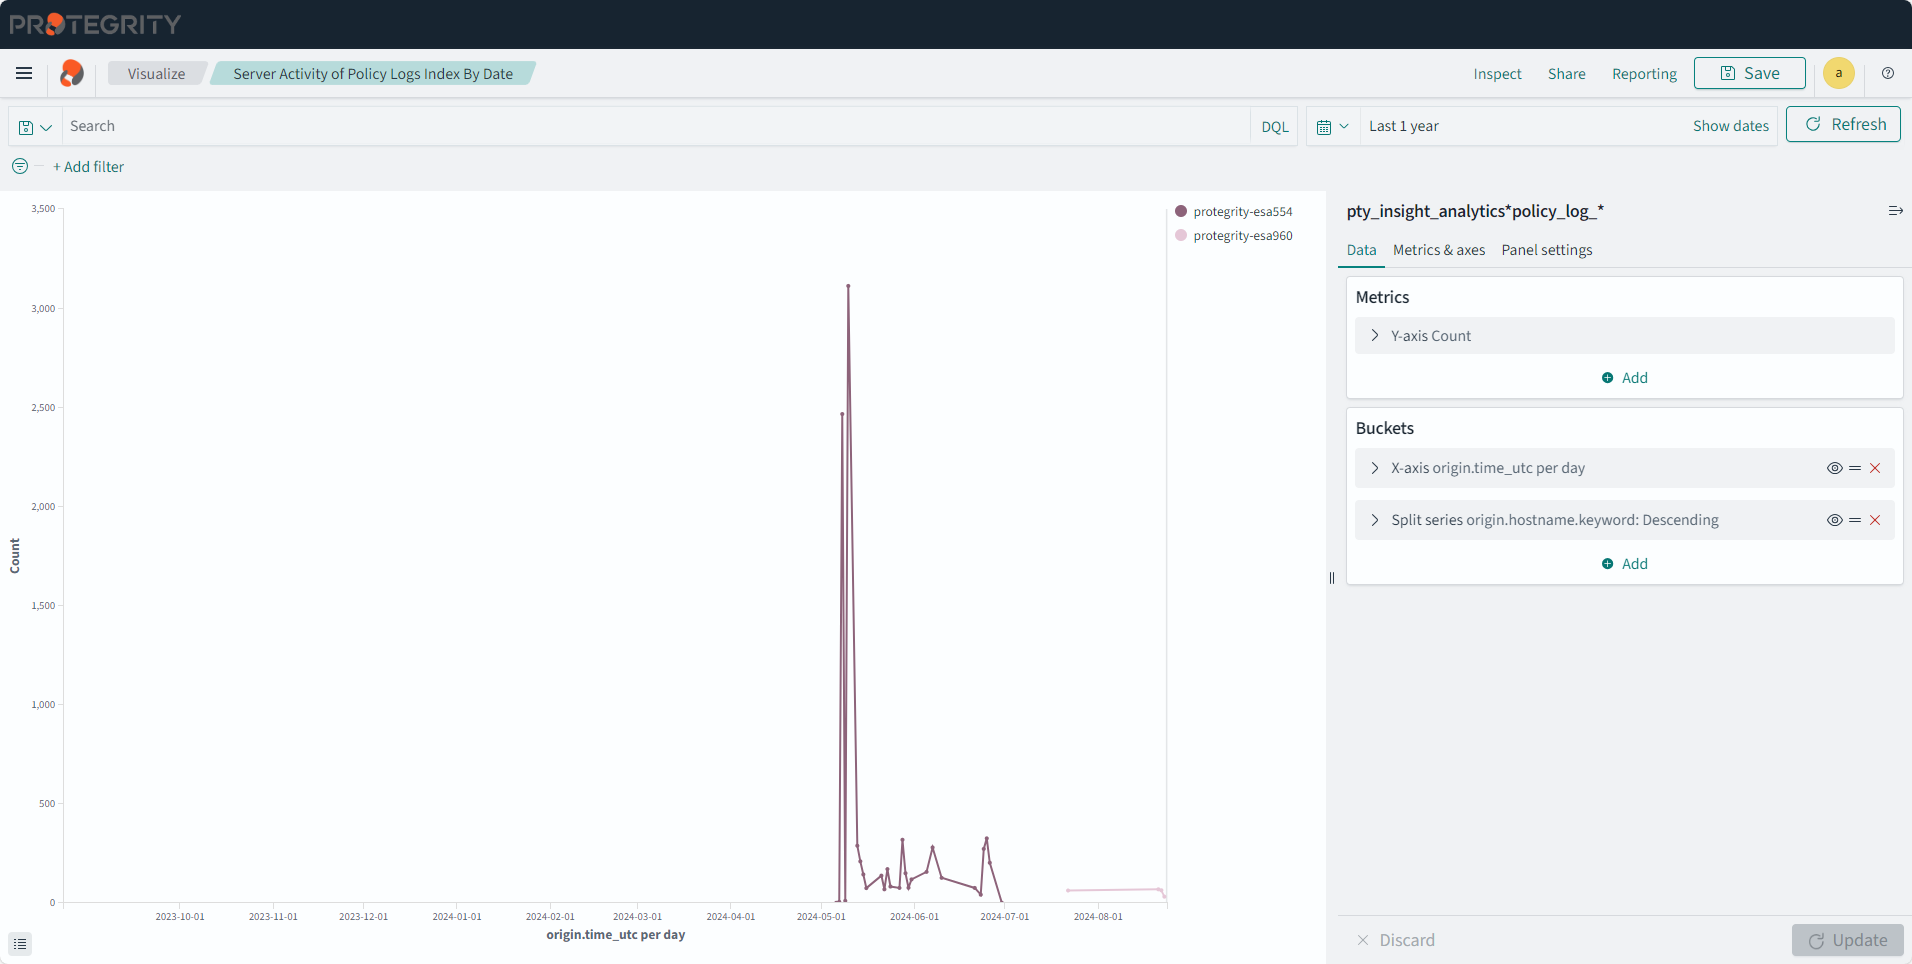
Server Activity of Policy Index By Date
Description: The chart shows the daily count of all events by servers for specific time period from the policy index.
- Type: Line
- Configuration:
- Index: pty_insight_analytics*policy_log_*
- Metrics: Y-axis: Count
- Buckets:
- X-axis
- Aggregation: Date Histogram
- Field: origin.time_utc
- Minimum interval: Day
- Split series
- Sub aggregation: Terms
- Field: origin.hostname.keyword
- Order by: Metric:Count
- Order: Descending
- Size: 50
- X-axis
Server Activity of Troubleshooting Index By Date
Description: The chart shows the daily count of all events by servers for specific time period from the troubleshooting index.
- Type: Line
- Configuration:
- Index: pty_insight_analytics*troubleshooting_*
- Metrics: Y-axis: Count
- Buckets:
- X-axis
- Aggregation: Date Histogram
- Field: origin.time_utc
- Minimum interval: Day
- Split series
- Sub aggregation: Terms
- Field: origin.hostname.keyword
- Order by: Metric:Count
- Order: Descending
- Size: 50
- X-axis
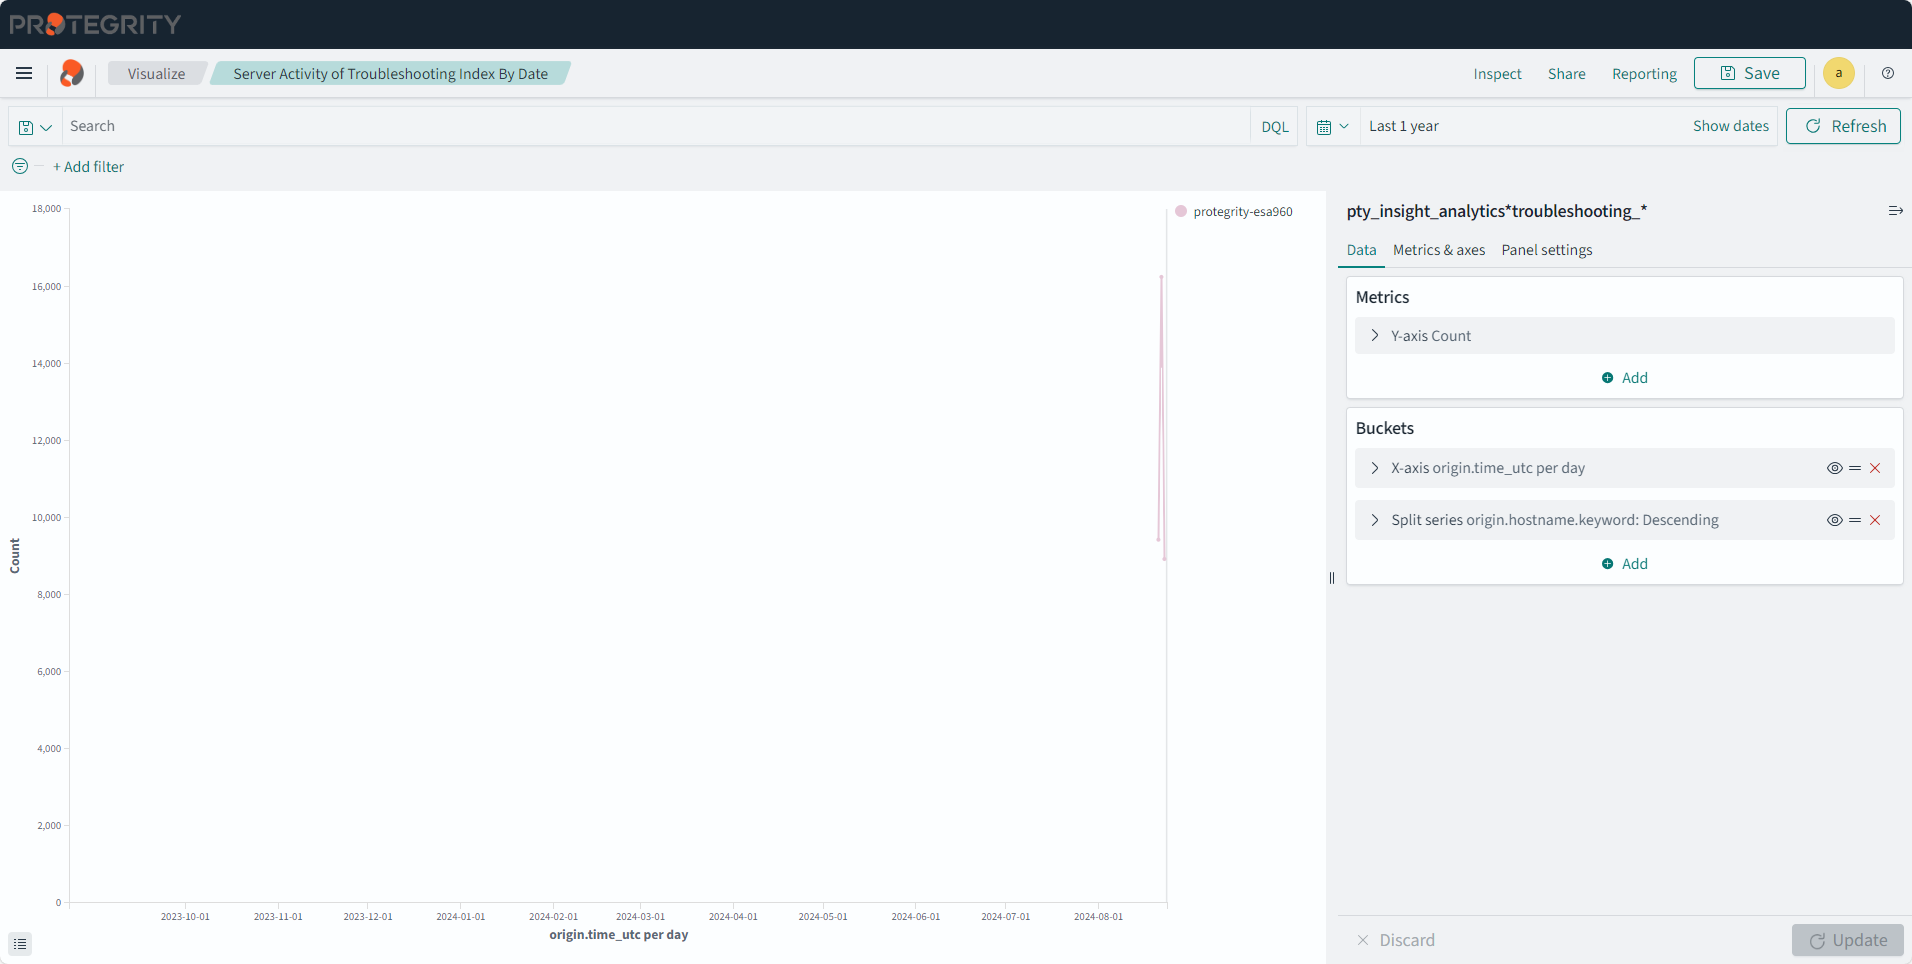
Connectivity status
Description: This pie chart display connectivity status for the protectors.
- Type: Pie
- Configuration:
- Index: pty_insight_analytics*protector_status_dashboard_*
- Metrics:
- Slice size
- Aggregation: Unique Count
- Field: origin.ip
- Custom label: Number
- Slice size
- Buckets:
- Split slices
- Aggregation: Terms
- Field: protector_status.keyword
- Order by: Metric:Number
- Order: Descending
- Size: 10000
- Split slices
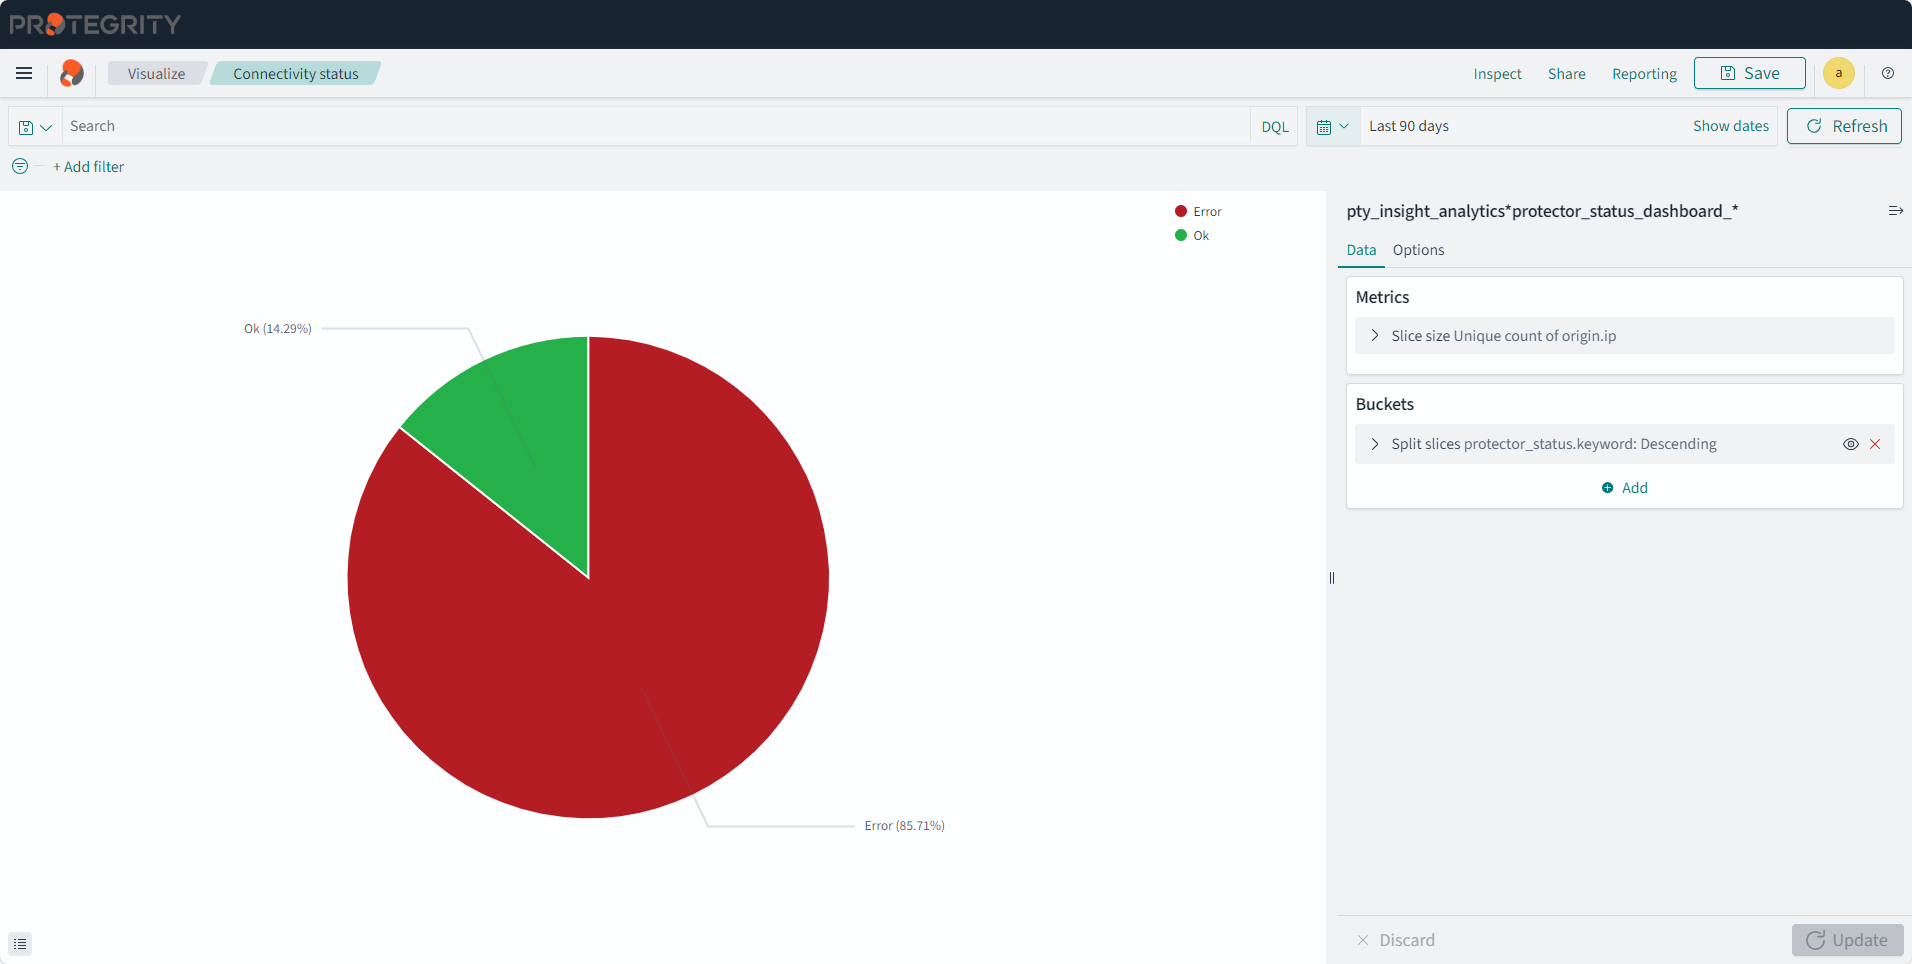
Policy_Deploy_Status_Chart
Description: This pie chart displays the deployment status of the policy.
- Type: Pie
- Filter: policystatus.type.keyword: POLICY
- Configuration:
- Index: pty_insight_analytics*policy_status_dashboard_*
- Metrics:
- Slice size
- Aggregation: Unique Count
- Field: _id
- Slice size
- Buckets:
- Split slices
- Aggregation: Terms
- Field: policystatus.status.keyword
- Order by: Metric:Unique Count of _id
- Order: Descending
- Size: 50
- Custom label: Policy Status
- Split slices
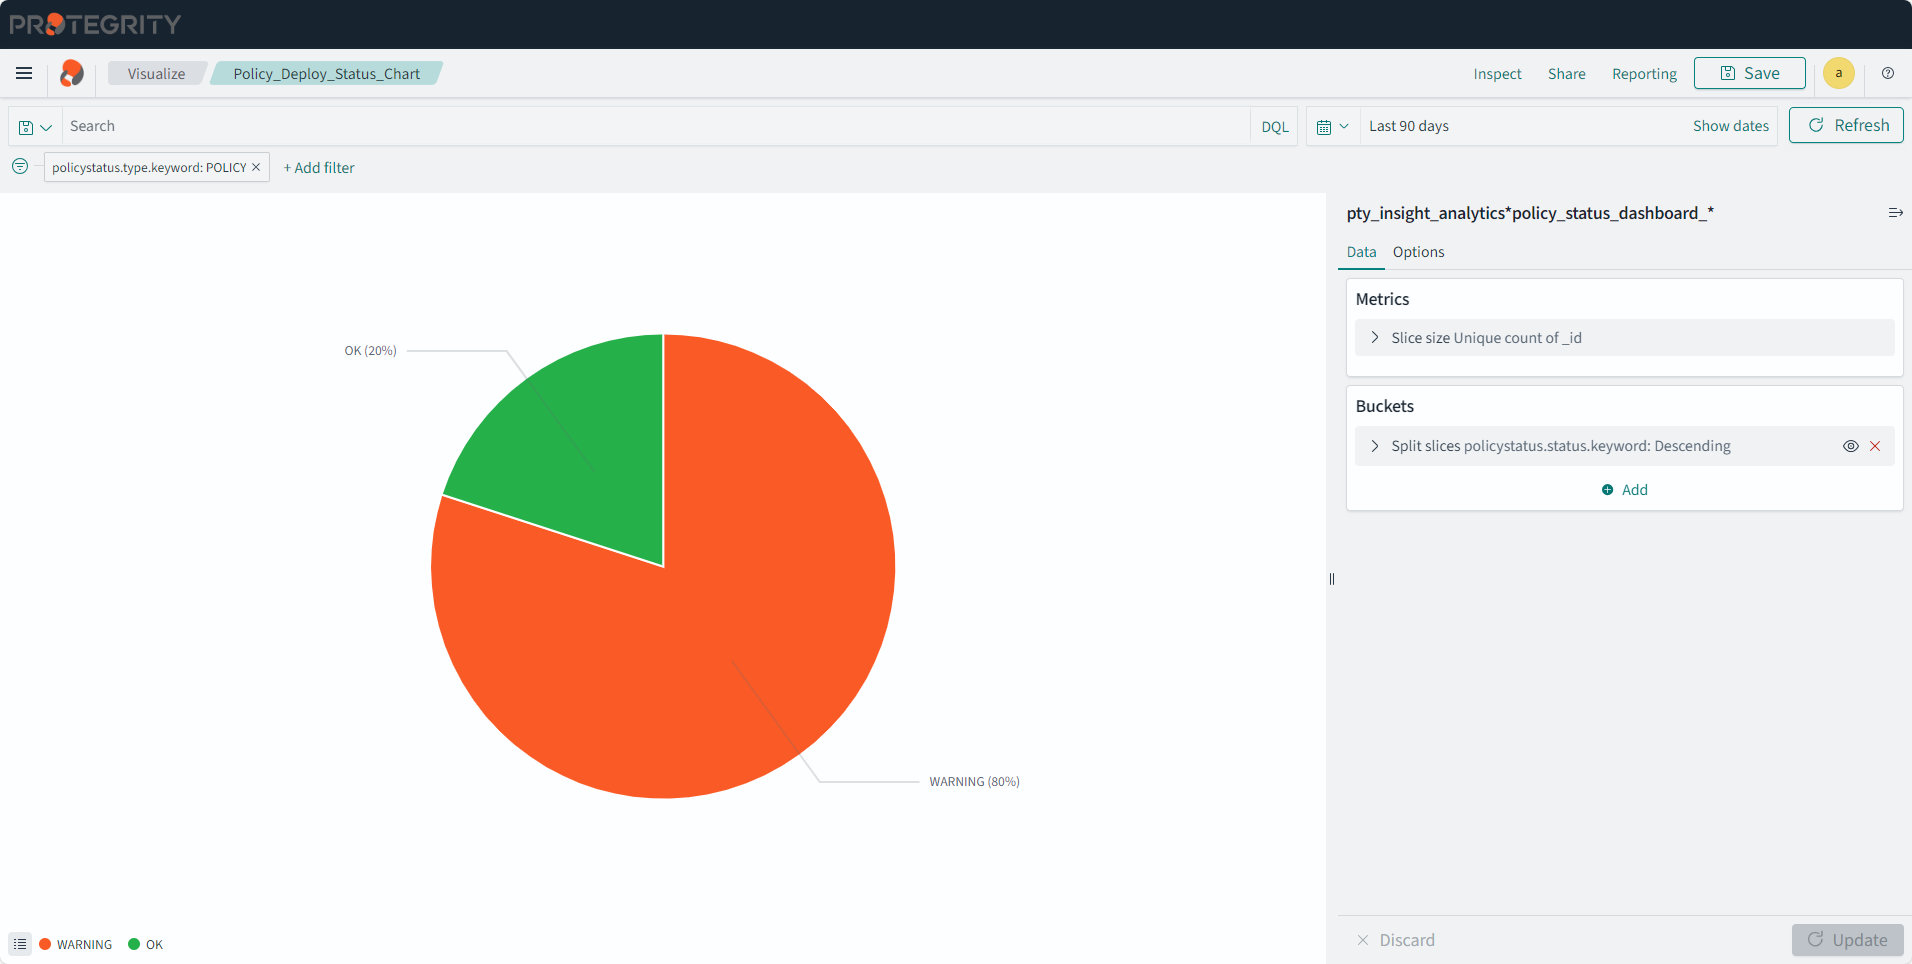
Policy_Deploy_Status_Table
Description: This table displays the policy deployment status and uniquely identified information for the data store, protector, process, platform, node, and so on.
- Type: Data Table
- Filter: policystatus.type.keyword: POLICY
- Configuration:
- Index: pty_insight_analytics*policy_status_dashboard_*
- Metrics:
- Aggregation: Count
- Custom label: Metrics Count
- Buckets:
- Split rows
- Aggregation: Terms
- Field: protector.datastore.keyword
- Order by: Metric: Metrics Count
- Order: Descending
- Size: 50
- Custom label: Data Store Name
- Split rows
- Aggregation: Terms
- Field: origin.ip
- Order by: Metric: Metrics Count
- Order: Descending
- Size: 50
- Custom label: Node IP
- Split rows
- Aggregation: Terms
- Field: origin.hostname.keyword
- Order by: Metric: Metrics Count
- Order: Descending
- Size: 50
- Custom label: Host Name
- Split rows
- Aggregation: Terms
- Field: policystatus.status.keyword
- Order by: Metric: Metrics Count
- Order: Descending
- Size: 50
- Custom label: Status
- Split rows
- Aggregation: Terms
- Field: origin.time_utc
- Order by: Metric: Metrics Count
- Order: Descending
- Size: 50
- Custom label: Last Seen
- Split rows
- Aggregation: Terms
- Field: process.name.keyword
- Order by: Metric: Metrics Count
- Order: Descending
- Size: 50
- Custom label: Process Name
- Split rows
- Aggregation: Terms
- Field: process.id.keyword
- Order by: Metric: Metrics Count
- Order: Descending
- Size: 50
- Custom label: Process Id
- Split rows
- Aggregation: Terms
- Field: process.platform.keyword
- Order by: Metric: Metrics Count
- Order: Descending
- Size: 50
- Custom label: Platform
- Split rows
- Aggregation: Terms
- Field: process.core_version.keyword
- Order by: Metric: Metrics Count
- Order: Descending
- Size: 50
- Custom label: Core Version
- Split rows
- Aggregation: Terms
- Field: process.pcc_version.keyword
- Order by: Metric: Metrics Count
- Order: Descending
- Size: 50
- Custom label: PCC Version
- Split rows
- Aggregation: Terms
- Field: protector.version.keyword
- Order by: Metric: Metrics Count
- Order: Descending
- Size: 50
- Custom label: Protector Version
- Split rows
- Aggregation: Terms
- Field: protector.vendor.keyword
- Order by: Metric: Metrics Count
- Order: Descending
- Size: 50
- Custom label: Vendor
- Split rows
- Aggregation: Terms
- Field: protector.family.keyword
- Order by: Metric: Metrics Count
- Order: Descending
- Size: 50
- Custom label: Family
- Split rows
- Aggregation: Terms
- Field: policystatus.deployment_or_auth_time
- Order by: Metric: Metrics Count
- Order: Descending
- Size: 50
- Custom label: Deployment Time
- Split rows
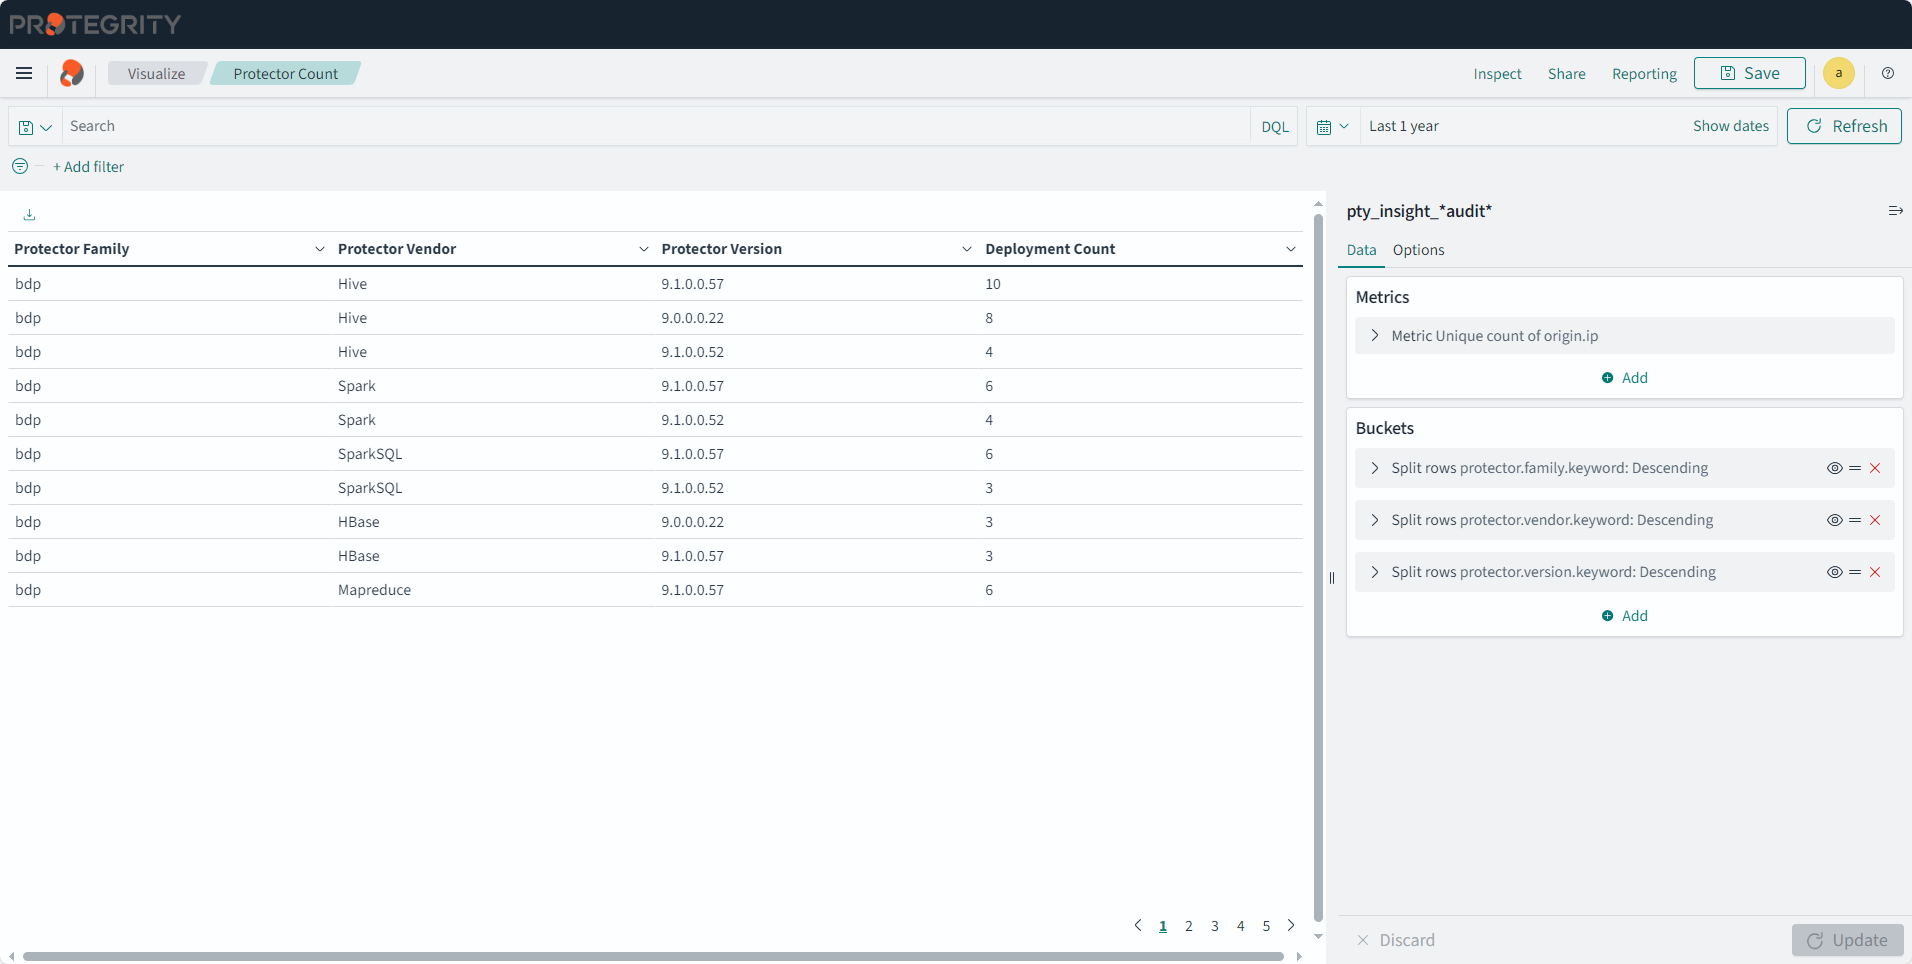
Protector Count
Description: This table displays the number of protector for each family, vendor, and version.
- Type: Data Table
- Configuration:
- Index: pty_insight_*audit*
- Metrics:
- Aggregation: Unique Count
- Field: origin.ip
- Custom label: Deployment Count
- Buckets:
- Split rows
- Aggregation: Terms
- Field: protector.family.keyword
- Order by: Metric: Deployment Count
- Order: Descending
- Size: 10000
- Custom label: Protector Family
- Split rows
- Aggregation: Terms
- Field: protector.vendor.keyword
- Order by: Metric: Metrics Count
- Order: Descending
- Size: 10000
- Custom label: Protector Vendor
- Split rows
- Aggregation: Terms
- Field: protector.version.keyword
- Order by: Metric: Deployment Count
- Order: Descending
- Size: 10000
- Custom label: Protector Version
- Split rows
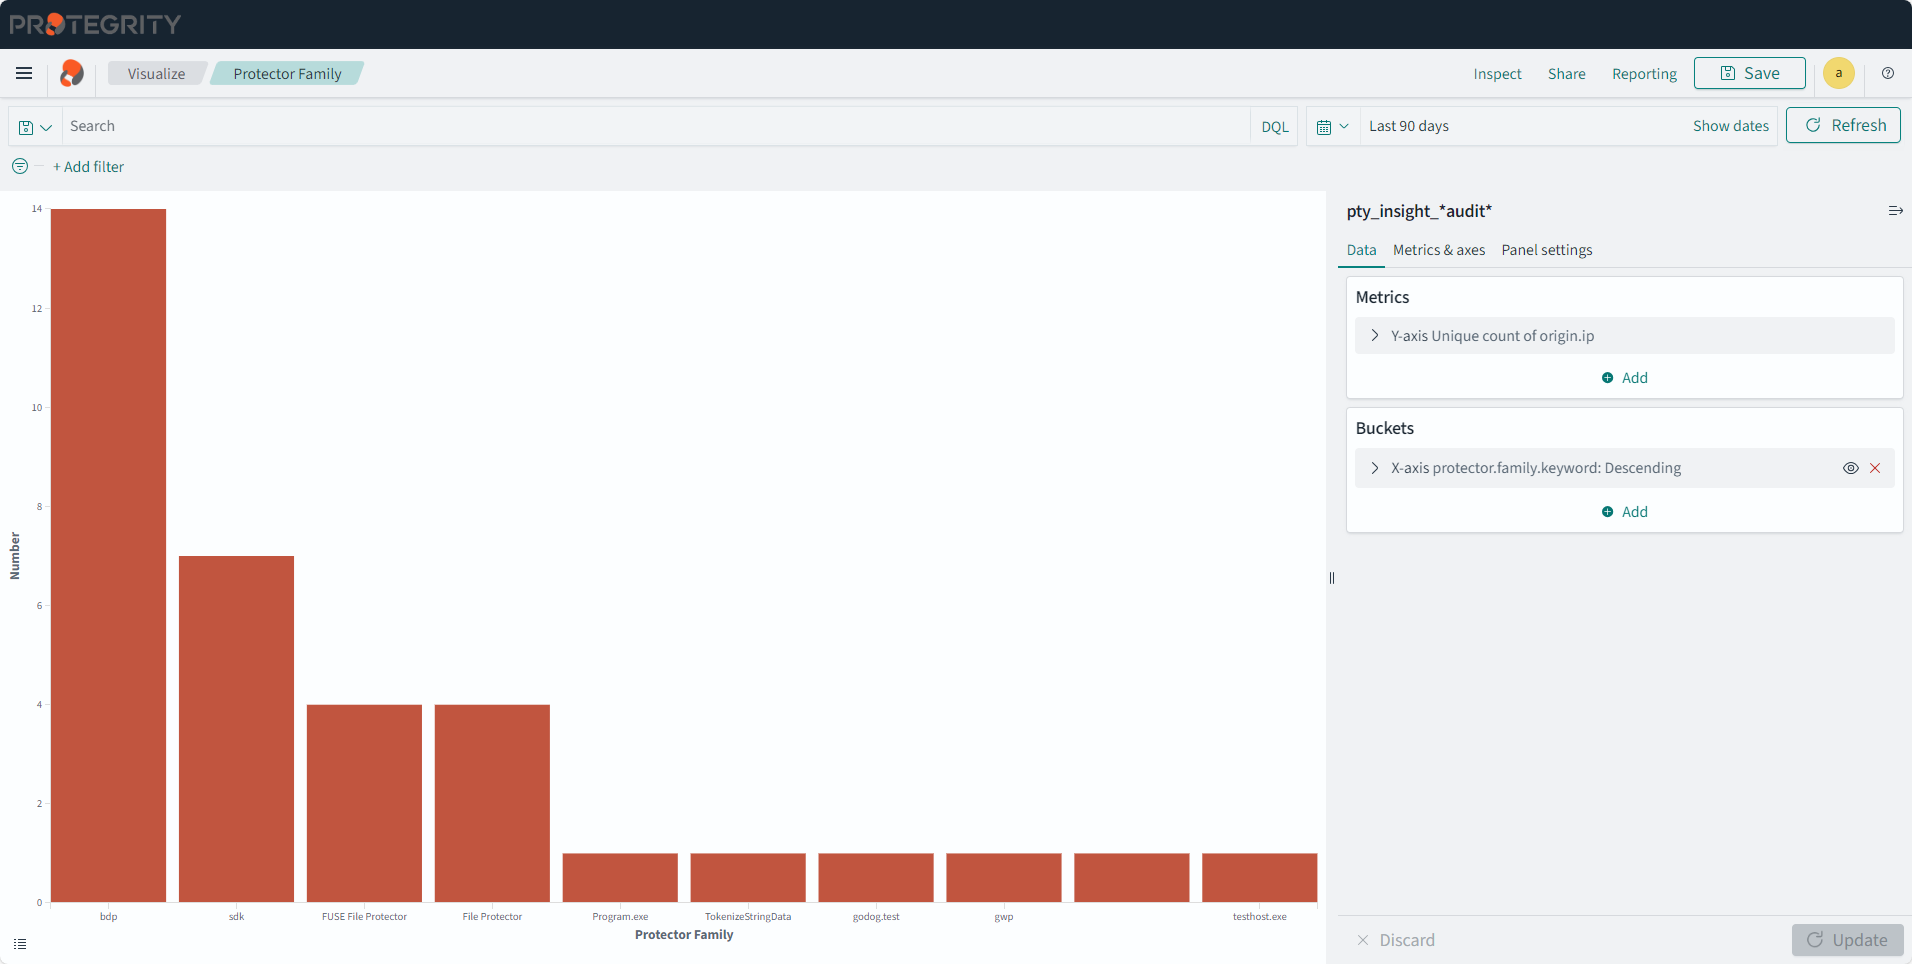
Protector Family
Description: This chart displays the counts of protectors installed for each protector family.
- Type: Vertical Bar
- Configuration:
- Index: pty_insight_*audit*
- Metrics: Y-axis
- Aggregation: Unique Count
- Field: origin.ip
- Custom label: Number
- Buckets:
- X-axis
- Aggregation: Terms
- Field: protector.family.keyword
- Order by: Metric:Number
- Order: Descending
- Size: 10000
- Custom label:Protector Family
- X-axis
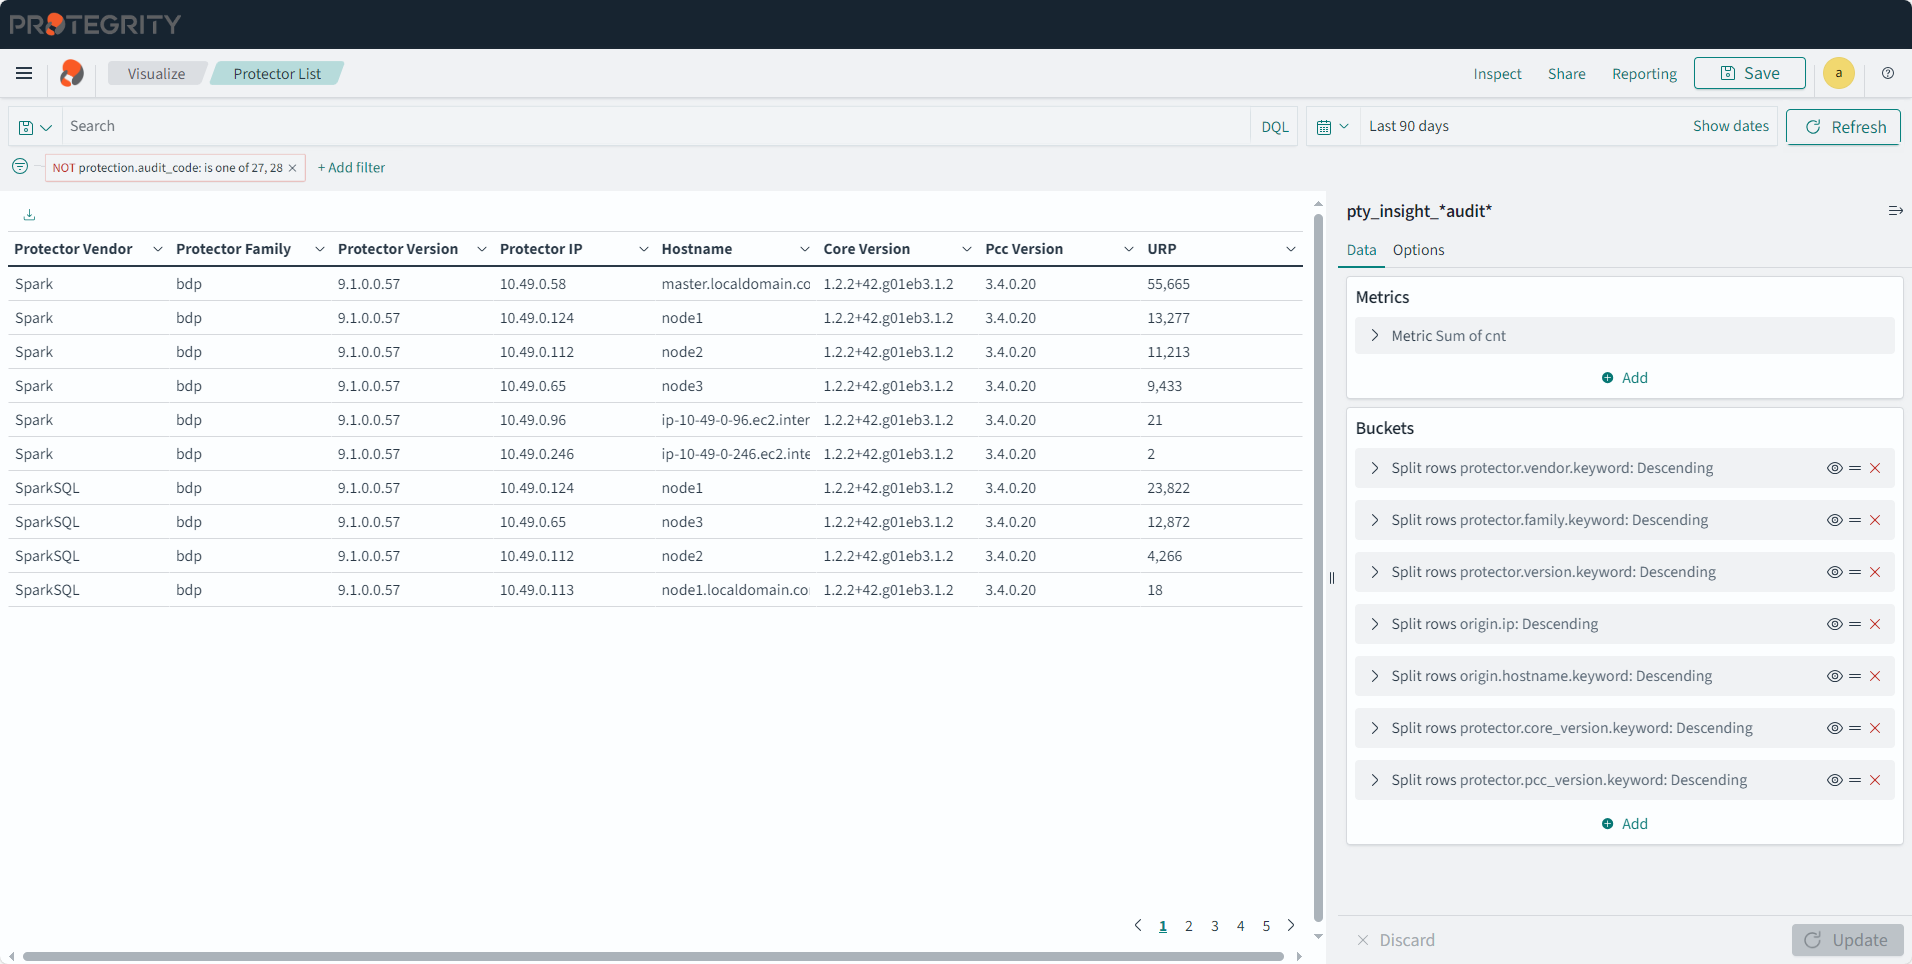
Protector List
Description: This table displays details of the protector.
- Type: Data Table
- Filter: NOT protection.audit_code: is one of 27, 28
- Configuration:
- Index: pty_insight_*audit*
- Metrics:
- Aggregation: Sum
- Field: cnt
- Custom label: URP
- Buckets:
- Split rows
- Aggregation: Terms
- Field: protector.vendor.keyword
- Order by: Metric:URP
- Order: Descending
- Size: 10000
- Custom label: Protector Vendor
- Split rows
- Aggregation: Terms
- Field: protector.family.keyword
- Order by: Metric:URP
- Order: Descending
- Size: 10000
- Custom label: Protector Family
- Split rows
- Aggregation: Terms
- Field: protector.version.keyword
- Order by: Metric:URP
- Order: Descending
- Size: 10000
- Custom label: Protector Version
- Split rows
- Aggregation: Terms
- Field: origin.ip
- Order by: Metric:URP
- Order: Descending
- Size: 10000
- Custom label: Protector IP
- Split rows
- Aggregation: Terms
- Field: origin.hostname.keyword
- Order by: Metric:URP
- Order: Descending
- Size: 10000
- Custom label: Hostname
- Split rows
- Aggregation: Terms
- Field: protector.core_version.keyword
- Order by: Metric:URP
- Order: Descending
- Size: 10000
- Custom label: Core Version
- Split rows
- Aggregation: Terms
- Field: protector.pcc_version.keyword
- Order by: Metric:URP
- Order: Descending
- Size: 10000
- Custom label: Pcc Version
- Split rows
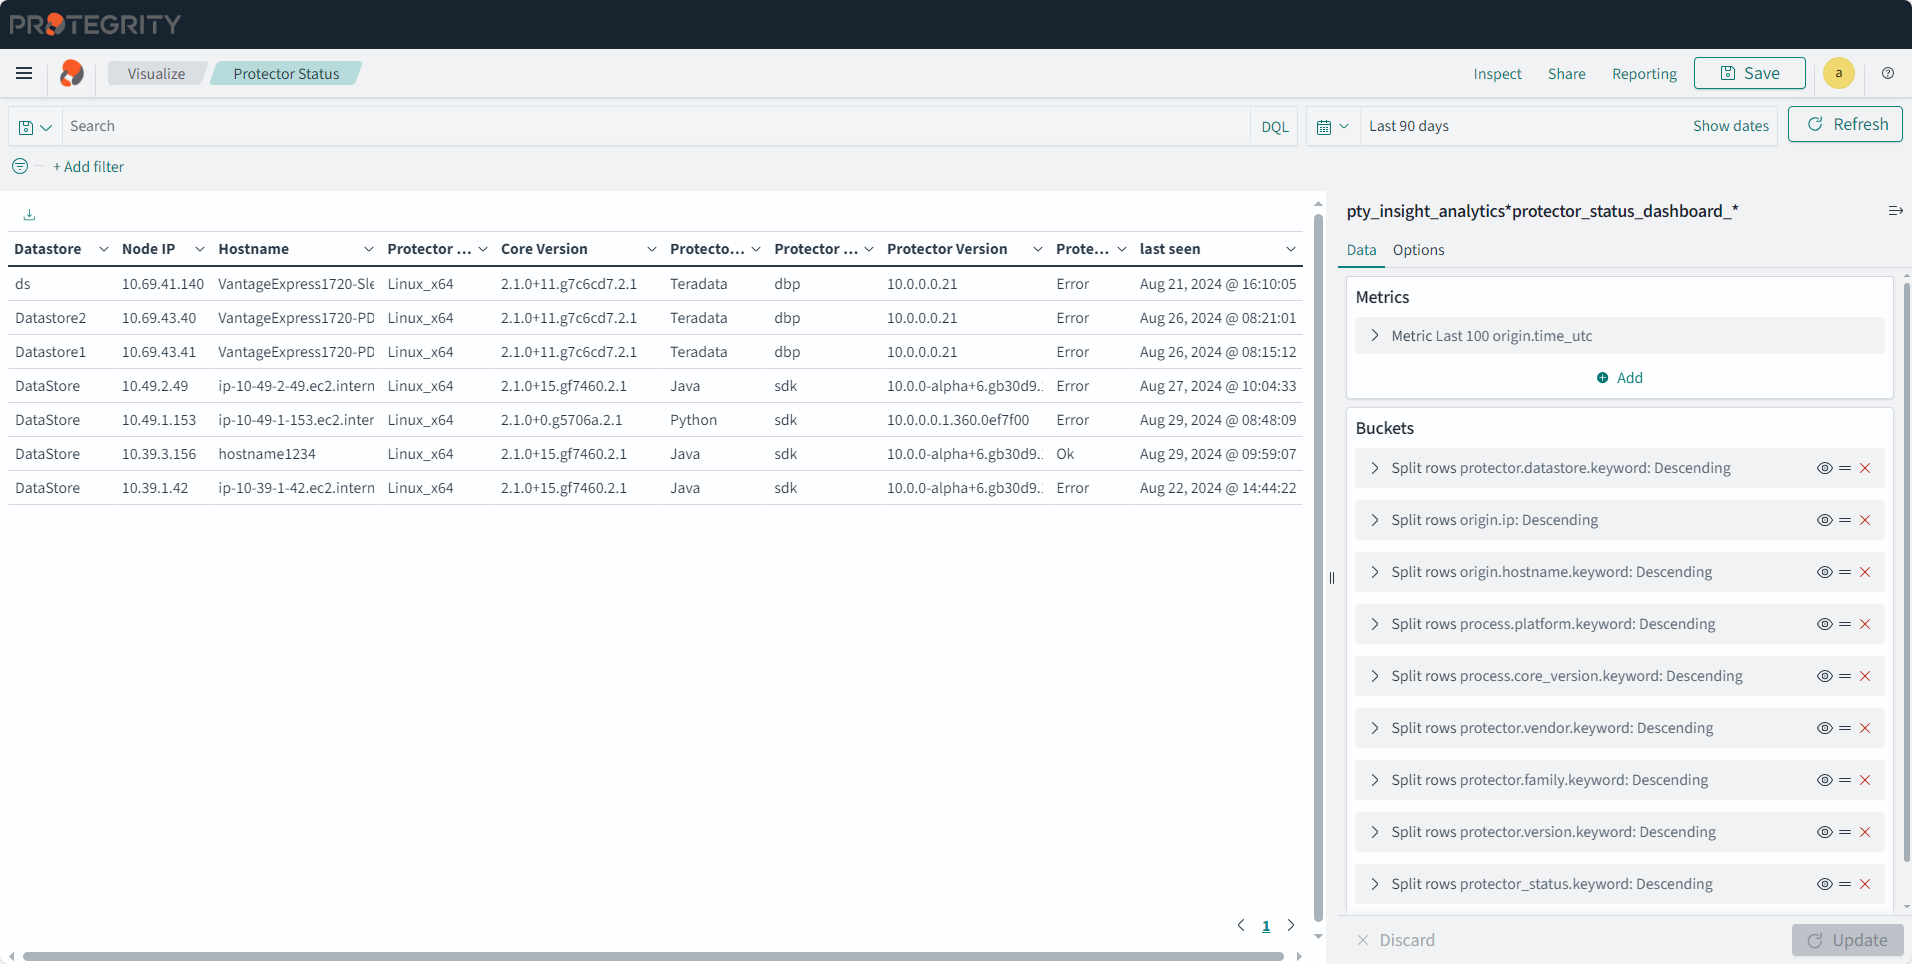
Protector Status
Description: This table display protector status information.
- Type: Data Table
- Configuration:
- Index: pty_insight_analytics*protector_status_dashboard_*
- Metrics:
- Aggregation: Top Hit
- Field: origin.time_utc
- Aggregate with: Concatenate
- Size: 100
- Sort on: origin.time_utc
- Order: Descending
- Custom label: last seen
- Buckets:
- Split rows
- Aggregation: Terms
- Field: protector.datastore.keyword
- Order by: Alphabetically
- Order: Descending
- Size: 10000
- Custom label: Datastore
- Split rows
- Aggregation: Terms
- Field: origin.hostname.keyword
- Order by: Alphabetically
- Order: Descending
- Size: 10000
- Custom label: Hostname
- Split rows
- Aggregation: Terms
- Field: process.platform.keyword
- Order by: Alphabetically
- Order: Descending
- Size: 10000
- Custom label: Protector Platform
- Split rows
- Aggregation: Terms
- Field: process.core_version.keyword
- Order by: Alphabetically
- Order: Descending
- Size: 10000
- Custom label: Core Version
- Split rows
- Aggregation: Terms
- Field: protector.vendor.keyword
- Order by: Alphabetically
- Order: Descending
- Size: 10000
- Custom label: Protector Vendor
- Split rows
- Aggregation: Terms
- Field: protector.family.keyword
- Order by: Alphabetically
- Order: Descending
- Size: 10000
- Custom label: Protector Family
- Split rows
- Aggregation: Terms
- Field: protector.version.keyword
- Order by: Alphabetically
- Order: Descending
- Size: 10000
- Custom label: Protector Version
- Split rows
- Aggregation: Terms
- Field: protector_status.keyword
- Order by: Alphabetically
- Order: Descending
- Size: 10000
- Custom label: Protector Status
- Split rows
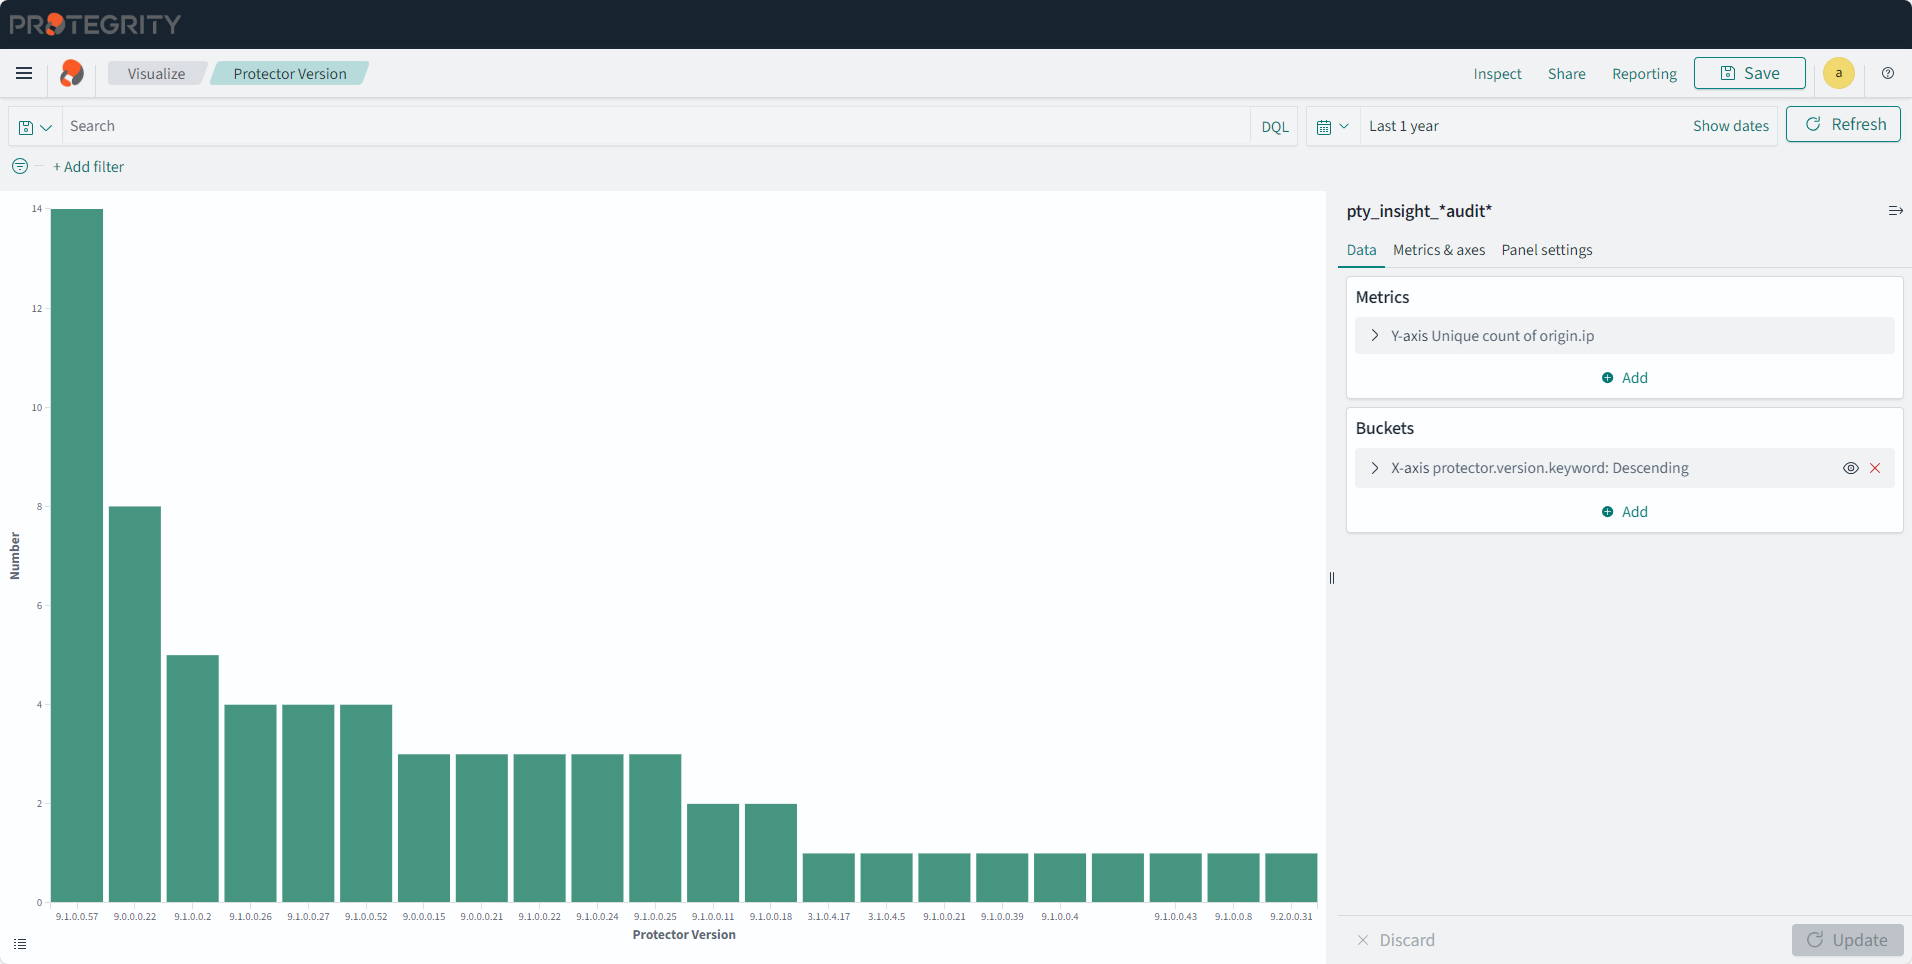
Protector Version
Description: This chart displays the protector count for each protector version.
- Type: Vertical Bar
- Configuration:
- Index: pty_insight_*audit*
- Metrics: Y-axis
- Aggregation: Unique Count
- Field: origin.ip
- Custom label: Number
- Buckets:
- X-axis
- Aggregation: Terms
- Field: protector.version.keyword
- Order by: Metric:Number
- Order: Descending
- Size: 10000
- Custom label: Protector Version
- Y-axis
- Sub aggregation: Terms
- Field: protection.dataelement.keyword
- Order by: Metric:Count
- Order: Descending
- Size: 50
- X-axis
- Filter: protection.operation.keyword: Unprotect
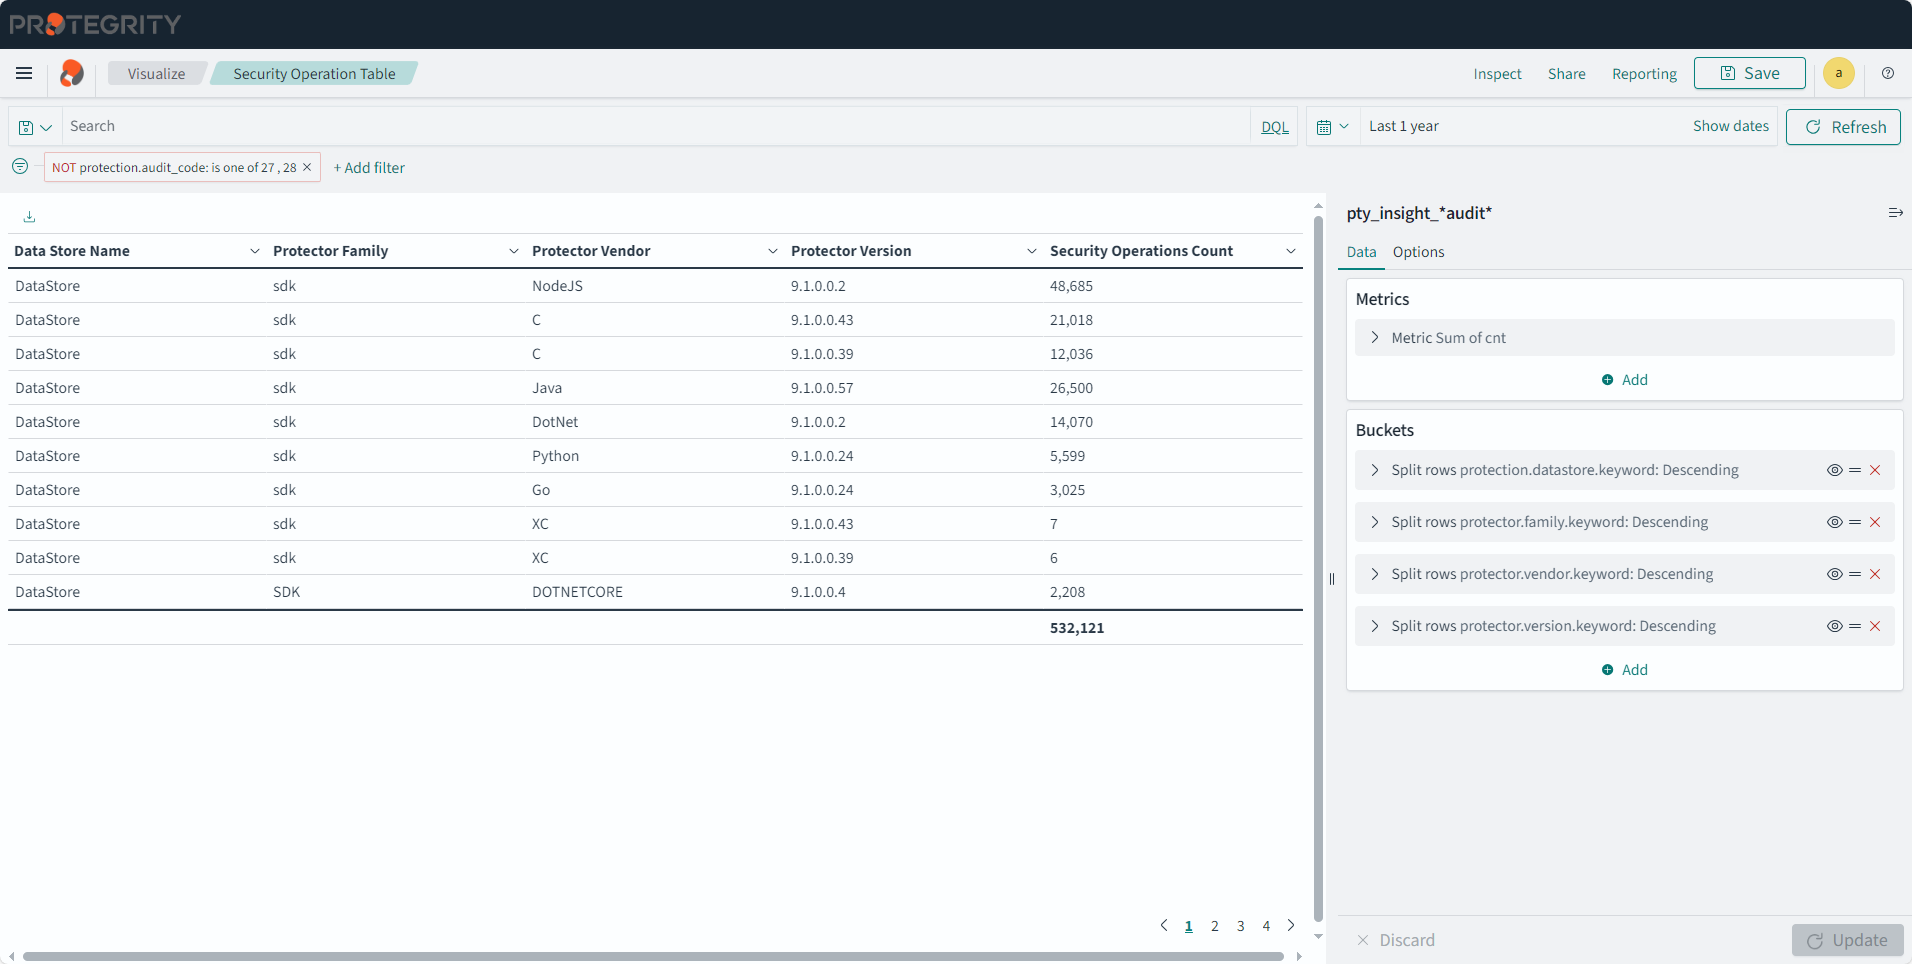
Security Operation Table
Description: The table displays the number of security operations grouped by data stores, protector vendors, and protector families.
- Type: Data Table
- FIlter: NOT protection.audit_code: is one of 27 , 28
- Configuration:
- Index: pty_insight_*audit_*
- Metrics:
- Aggregation: Sum
- Field: cnt
- Custom label: Security Operations Count
- Buckets:
- Split rows
- Aggregation: Terms
- Field: protection.datastore.keyword
- Order by: Metric:Security Operation Count
- Order: Descending
- Size: 10000
- Custom label: Data Store Name
- Split rows
- Aggregation: Terms
- Field: protector.family.keyword
- Order by: Metric:Security Operation Count
- Order: Descending
- Size: 10000
- Custom label: Protector Family
- Split rows
- Aggregation: Terms
- Field: protector.vendor.keyword
- Order by: Metric:Security Operation Count
- Order: Descending
- Size: 10000
- Custom label: Protector Vendor
- Split rows
- Aggregation: Terms
- Field: protector.version.keyword
- Order by: Metric:Security Operation Count
- Order: Descending
- Size: 10000
- Custom label: Protector Version
- Split rows
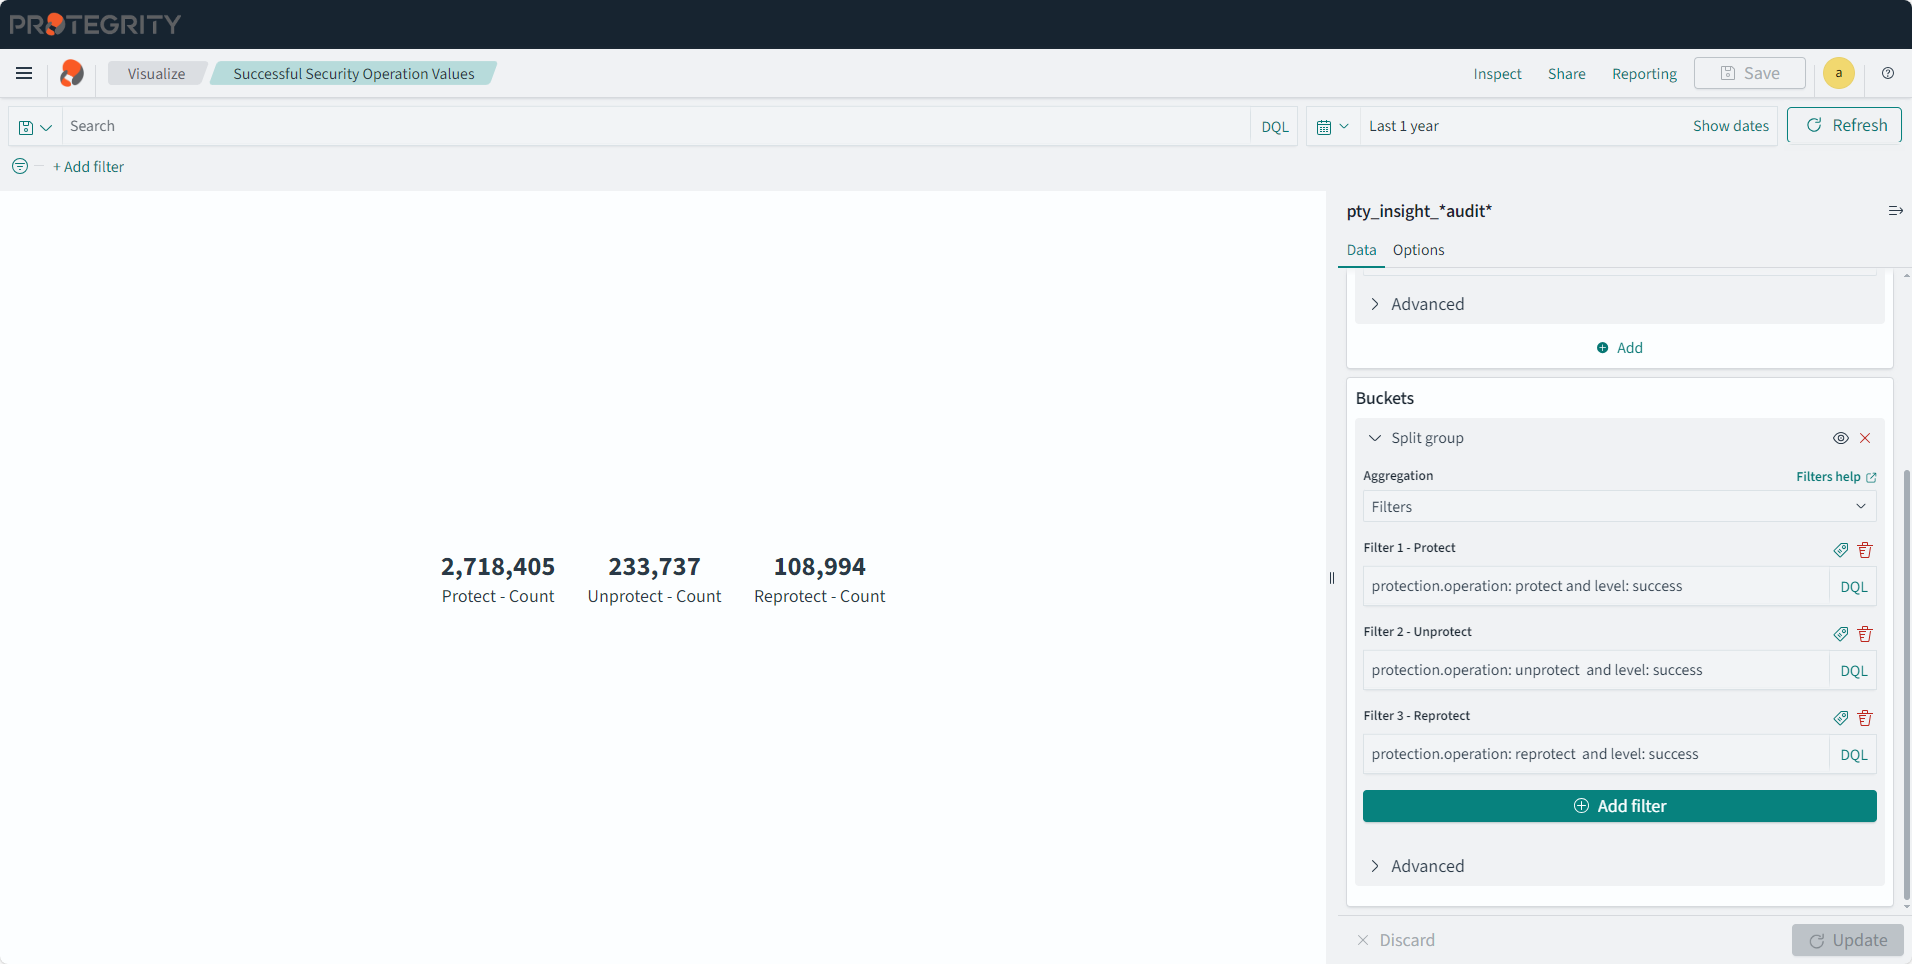
Successful Security Operation Values
Description: The visualization displays only successful protect, unprotect, and reprotect operation counts.
- Type: Metric
- Configuration:
- Index: pty_insight_*audit*
- Metrics:
- Aggregation: Sum
- Field: cnt
- Custom label: Count
- Buckets:
- Split group
- Aggregation: Filters
- Filter 1-Protect: protection.operation: protect and level: success
- Filter 2-Unprotect: protection.operation: unprotect and level: success
- Filter 3-Reprotect: protection.operation: reprotect and level: success
- Split group
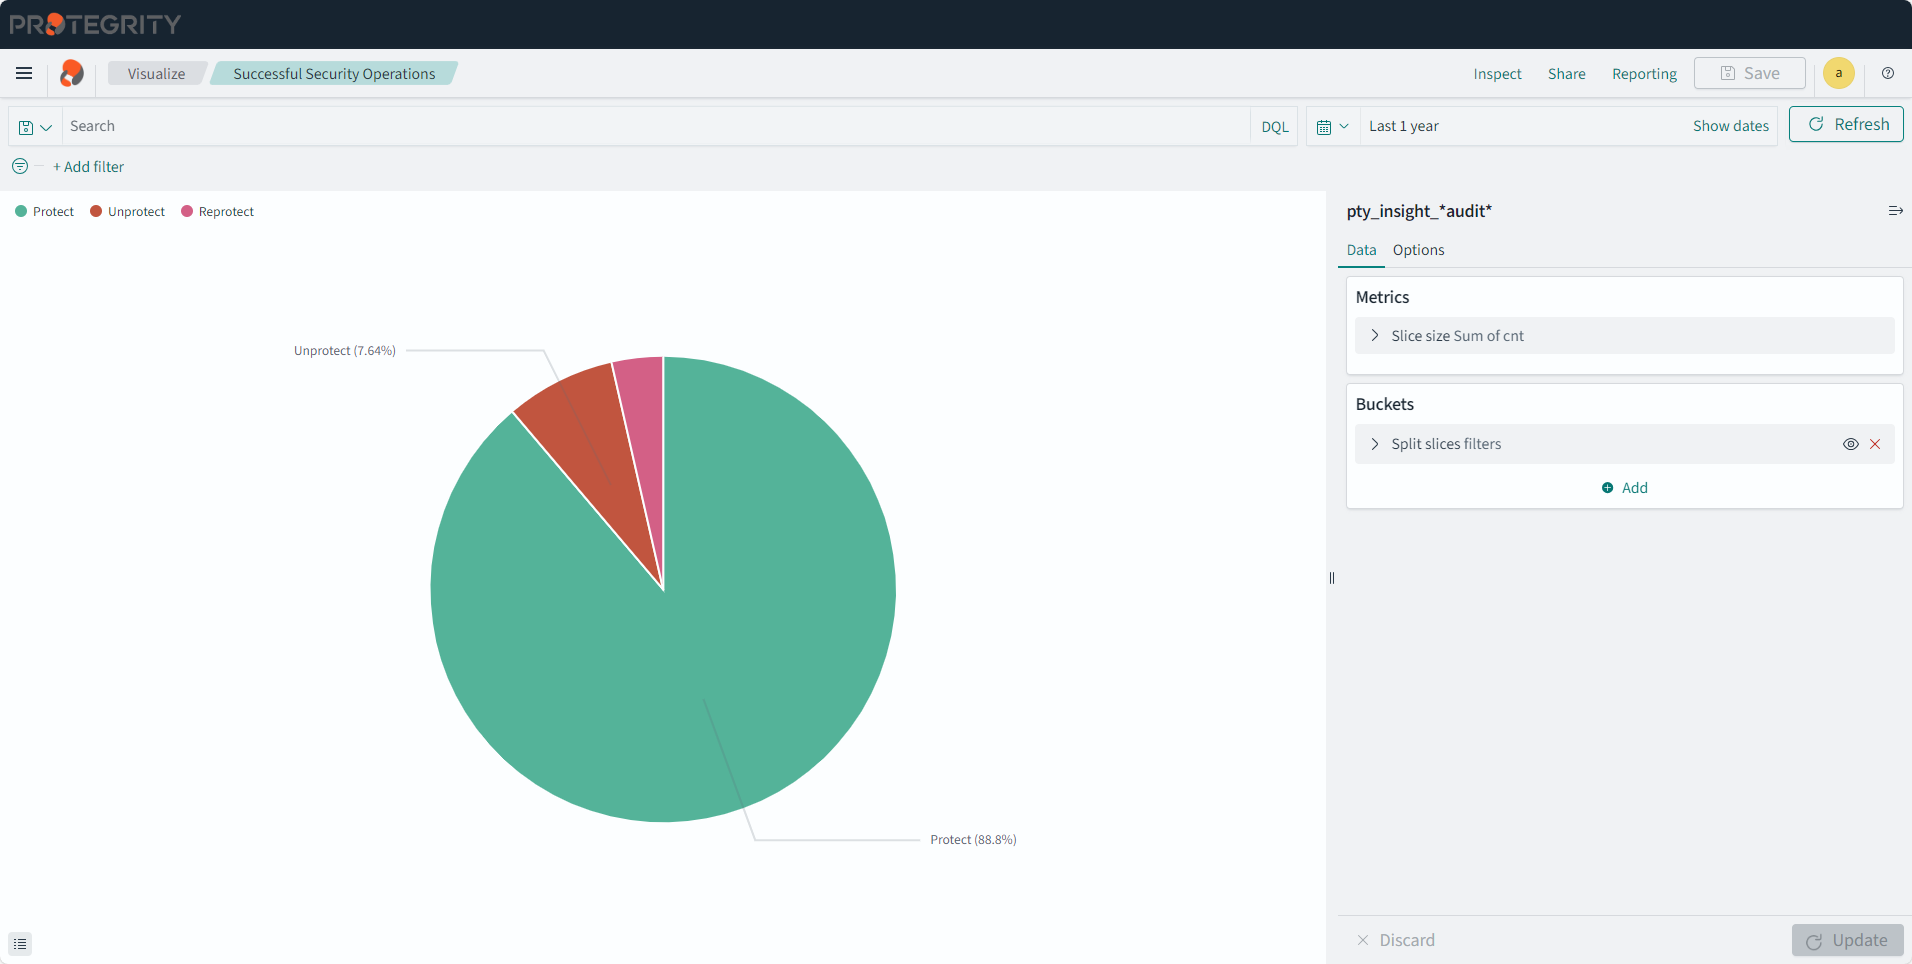
Successful Security Operations
Description: The pie chart displays only successful protect, unprotect, and reprotect operations.
- Type: Pie
- Configuration:
- Index: pty_insight_*audit*
- Metrics:
- Aggregation: Sum
- Field: cnt
- Custom label: URP
- Buckets:
- Split slices
- Aggregation: Filters
- Filter 1-Protect: protection.operation: protect and level: Success
- Filter 2-Unprotect: protection.operation: unprotect and level: Success
- Filter 3-Reprotect: protection.operation: reprotect and level: Success
- Split slices
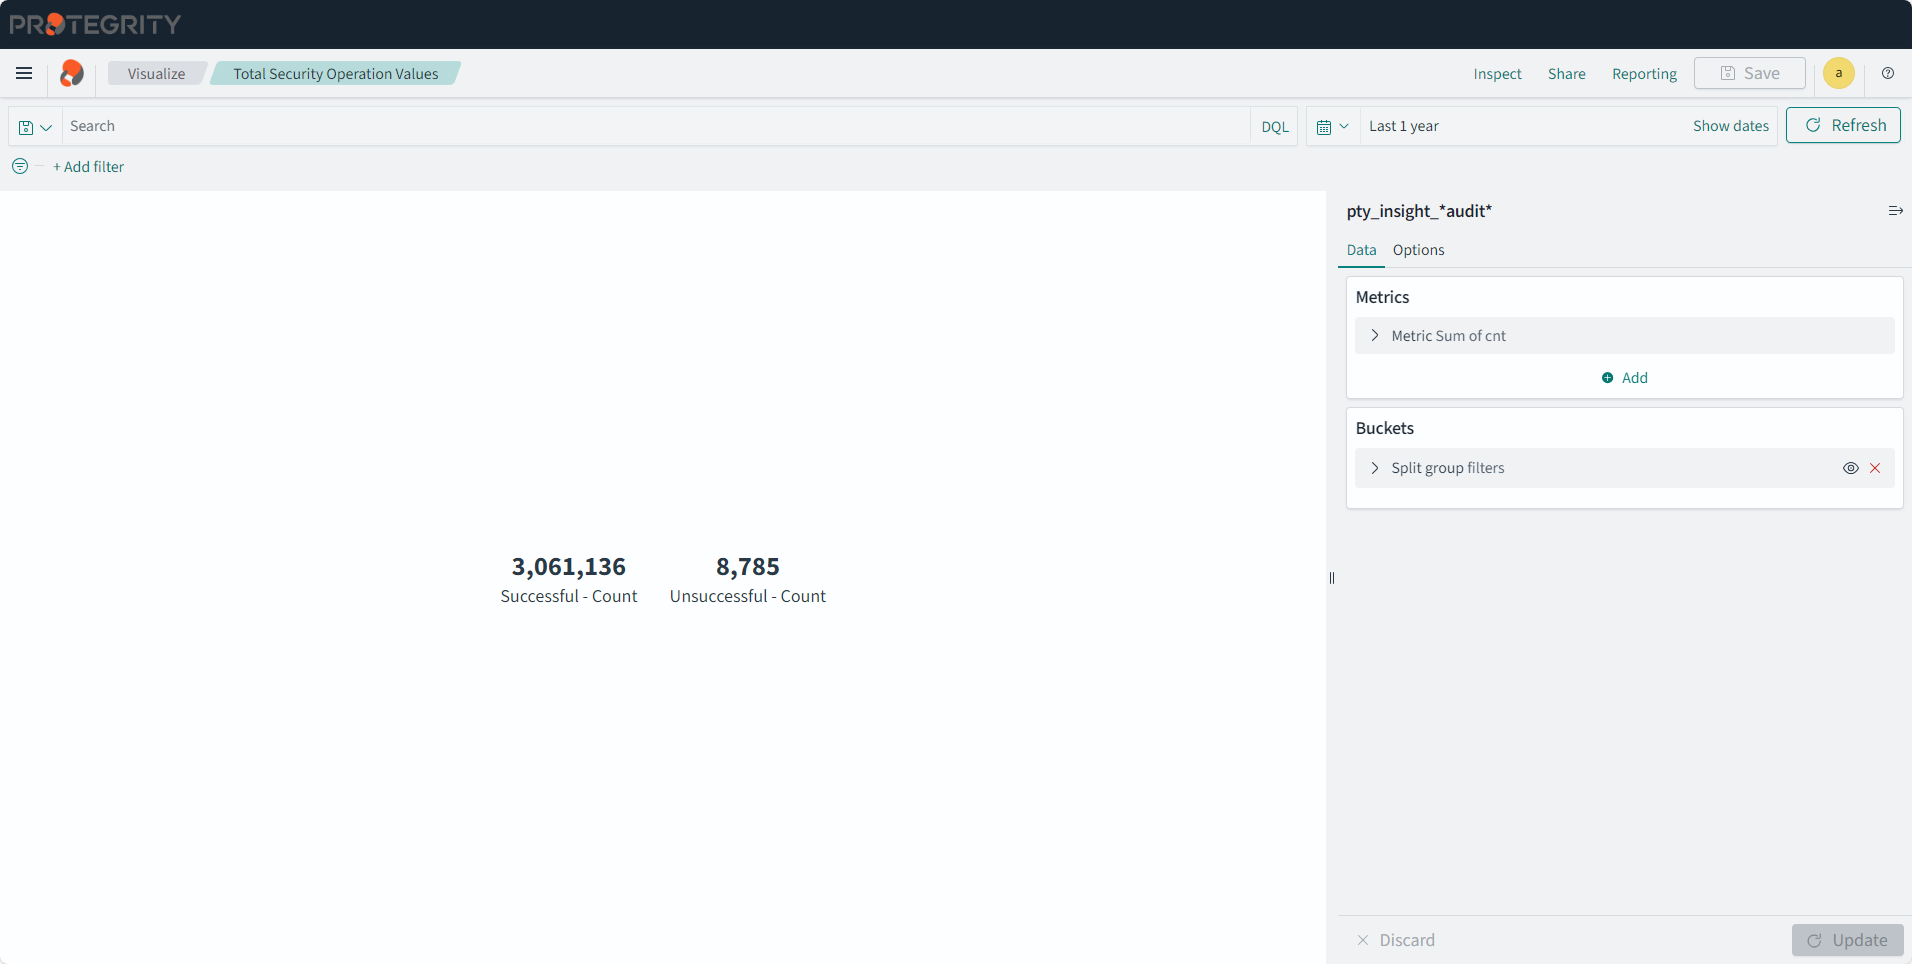
Total Security Operation Values
Description: The visualization displays successful and unsuccessful security operation counts.
- Type: Metric
- Configuration:
- Index: pty_insight_*audit*
- Metrics:
- Aggregation: Sum
- Field: cnt
- Custom label: Count
- Buckets:
- Split group
- Aggregation: Filters
- Filter 1-Successful: logtype:protection and level: Success and not protection.audit_code: 27
- Filter 2-Unsuccessful: logtype:protection and not level: Success and not protection.audit_code: 28
- Split group
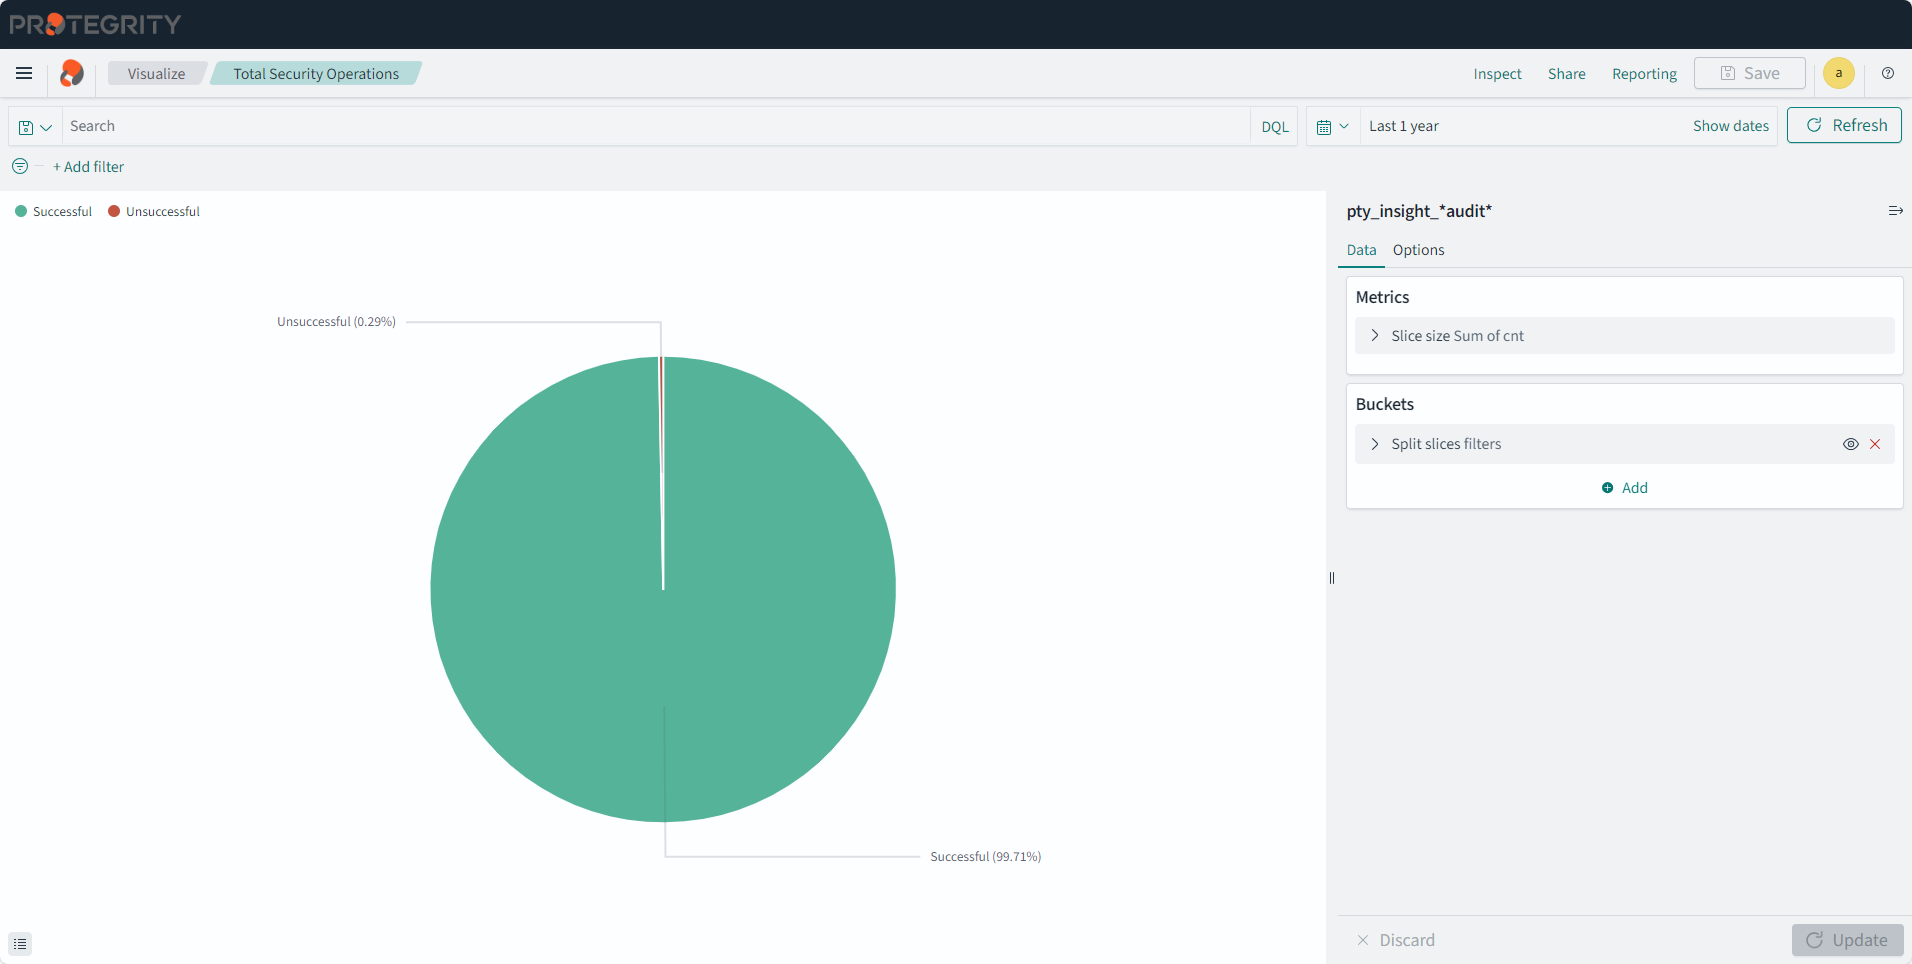
Total Security Operations
Description: The pie chart displays successful and unsuccessful security operations.
- Type: Pie
- Configuration:
- Index: pty_insight_*audit*
- Metrics:
- Aggregation: Sum
- Field: cnt
- Custom label: URP
- Buckets:
- Split slices
- Aggregation: Filters
- Filter 1-Successful: logtype:protection and level: Success and not protection.audit_code: 27
- Filter 2-Unsuccessful: logtype:protection and not level: Success and not protection.audit_code: 28
- Split slices
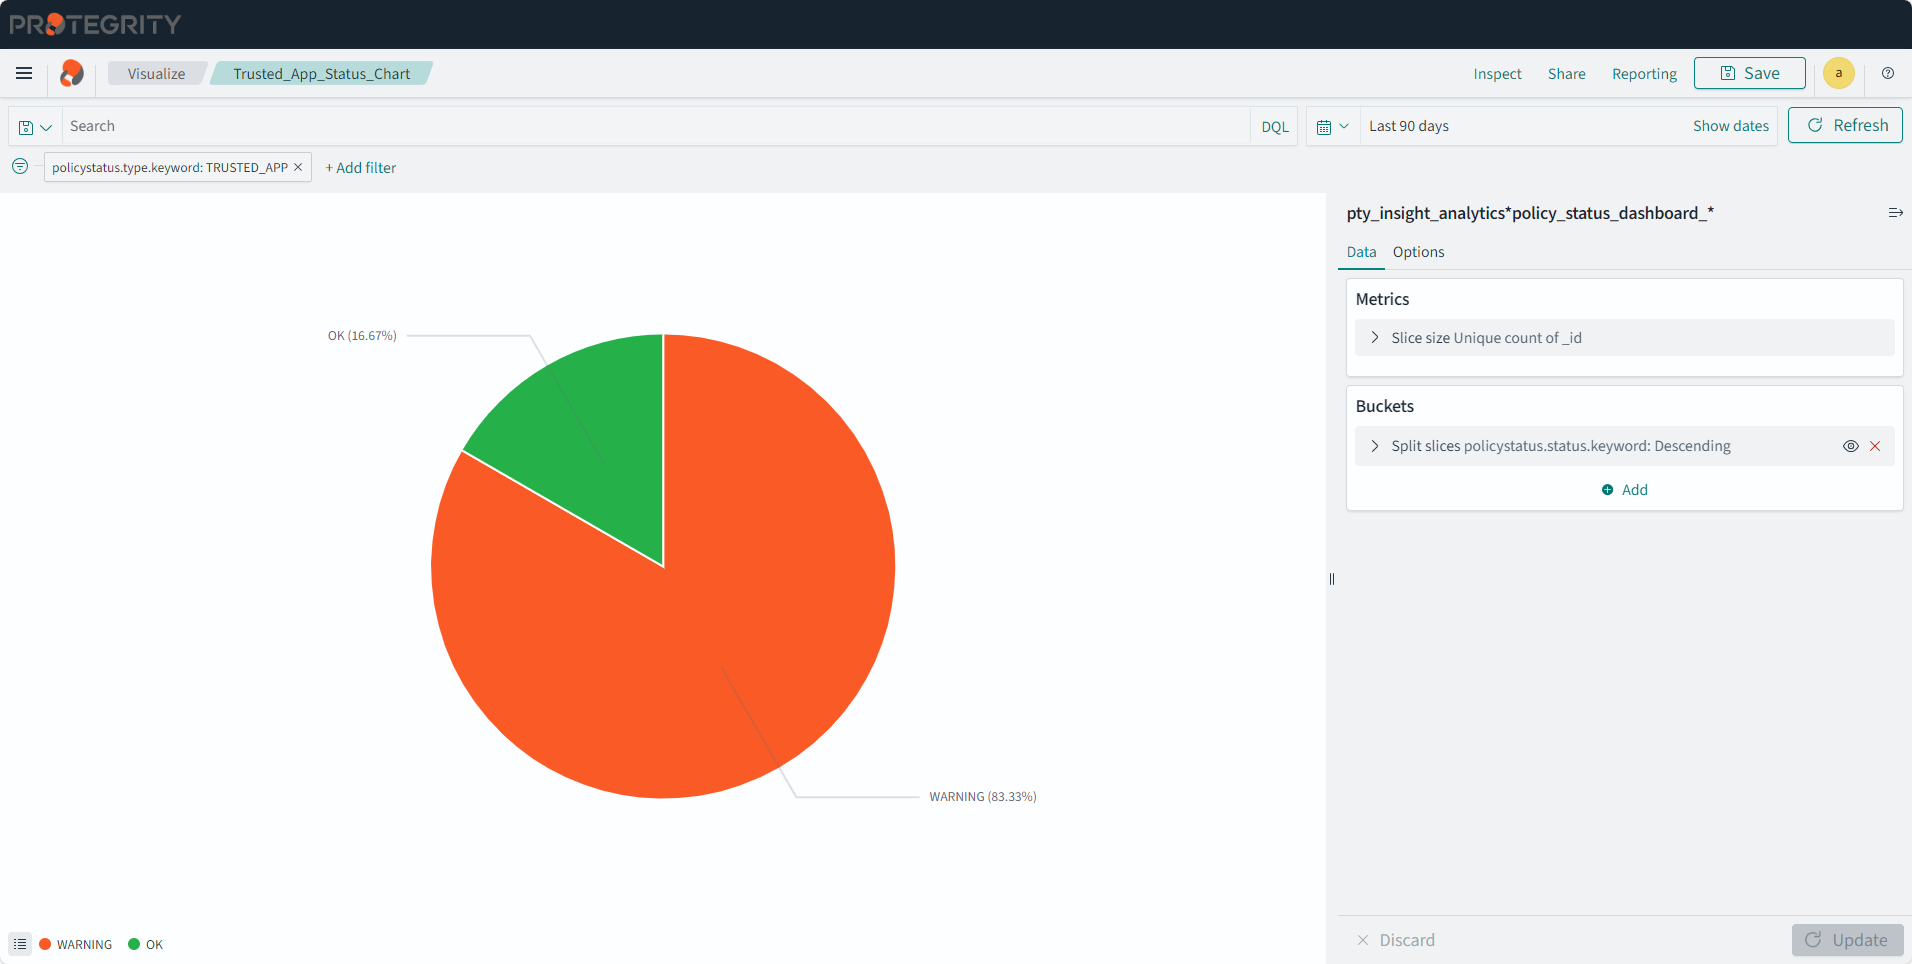
Trusted_App_Status_Chart
Description: The pie chart displays the trusted application deployment status.
- Type: Pie
- Filter: policystatus.type.keyword: TRUSTED_APP
- Configuration:
- Index: pty_insight_analytics*policy_status_dashboard_*
- Metrics:
- Slice size:
- Aggregation: Unique Count
- Field: _id
- Custom label: Trusted App
- Slice size:
- Buckets:
- Split slices
- Aggregation: Terms
- Field: policystatus.status.keyword
- Order by: Metric: Trusted App
- Order: Descending
- Size: 100
- Custom label: Trusted App Status
- Split slices
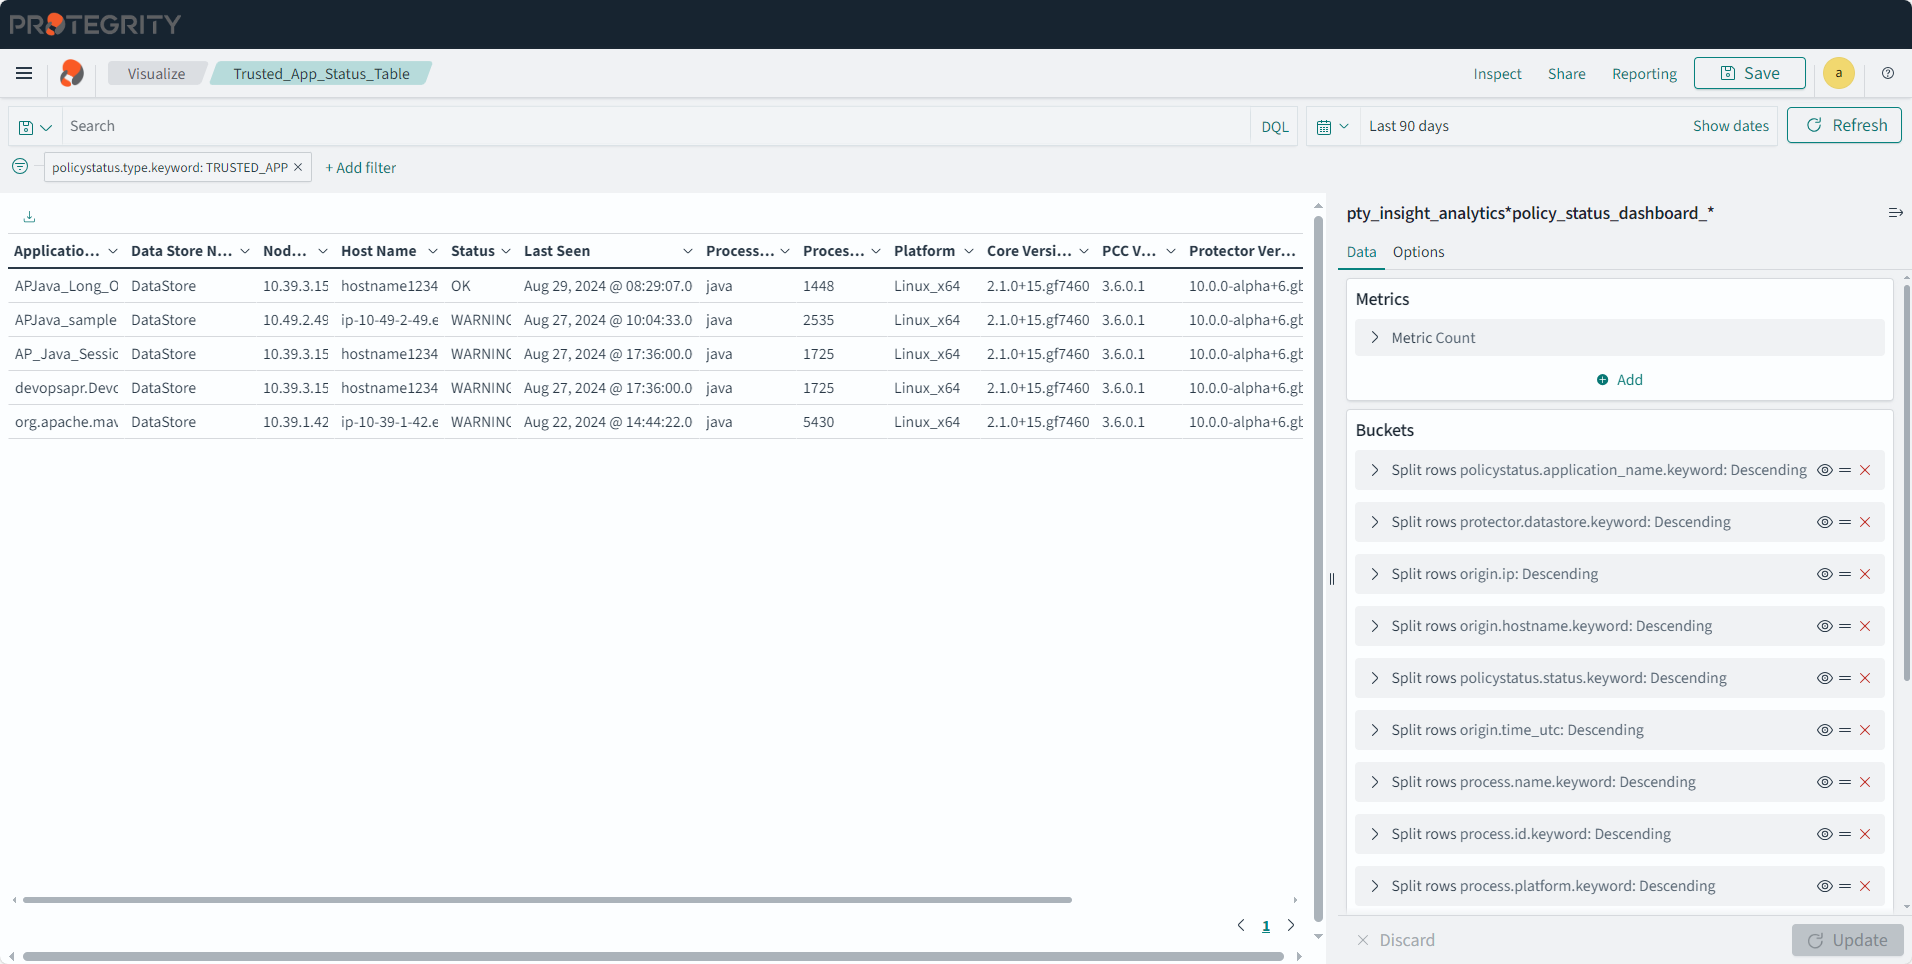
Trusted_App_Status_Table
Description: The trusted application deployment status that is displayed on the dashboard. This table uniquely identifies the data store, protector, process, platform, node, and so on.
- Type: Data Table
- Filter: policystatus.type.keyword: TRUSTED_APP
- Configuration:
- Index: pty_insight_analytics*policy_status_dashboard_*
- Metrics:
- Aggregation: Count
- Custom label: Metrics Count
- Buckets:
- Split rows
- Aggregation: Terms
- Field: policystatus.application_name.keyword
- Order by: Metric: Metric:Count
- Order: Descending
- Size: 5
- Custom label: Application name
- Split rows
- Aggregation: Terms
- Field: protector.datastore.keyword
- Order by: Metric: Metric:Count
- Order: Descending
- Size: 50
- Custom label: Data Store Name
- Split rows
- Aggregation: Terms
- Field: origin.ip
- Order by: Metric: Metric:Count
- Order: Descending
- Size: 50
- Custom label: Node IP
- Split rows
- Aggregation: Terms
- Field: origin.hostname.keyword
- Order by: Metric: Metric:Count
- Order: Descending
- Size: 50
- Custom label: Host Name
- Split rows
- Aggregation: Terms
- Field: policystatus.status.keyword
- Order by: Metric: Metric:Count
- Order: Descending
- Size: 50
- Custom label: Status
- Split rows
- Aggregation: Terms
- Field: origin.time_utc
- Order by: Metric: Metric:Count
- Order: Descending
- Size: 50
- Custom label: Last Seen
- Split rows
- Aggregation: Terms
- Field: process.name.keyword
- Order by: Metric: Metric:Count
- Order: Descending
- Size: 50
- Custom label: Process Name
- Split rows
- Aggregation: Terms
- Field: process.id.keyword
- Order by: Metric: Metric:Count
- Order: Descending
- Size: 50
- Custom label: Process Id
- Split rows
- Aggregation: Terms
- Field: process.platform.keyword
- Order by: Metric: Metric:Count
- Order: Descending
- Size: 50
- Custom label: Platform
- Split rows
- Aggregation: Terms
- Field: process.core_version.keyword
- Order by: Metric: Metric:Count
- Order: Descending
- Size: 50
- Custom label: Core Version
- Split rows
- Aggregation: Terms
- Field: process.pcc_version.keyword
- Order by: Metric: Metric:Count
- Order: Descending
- Size: 50
- Custom label: PCC Version
- Split rows
- Aggregation: Terms
- Field: protector.version.keyword
- Order by: Metric: Metric:Count
- Order: Descending
- Size: 50
- Custom label: Protector Version
- Split rows
- Aggregation: Terms
- Field: protector.vendor.keyword
- Order by: Metric: Metric:Count
- Order: Descending
- Size: 50
- Custom label: Vendor
- Split rows
- Aggregation: Terms
- Field: protector.family.keyword
- Order by: Metric: Metric:Count
- Order: Descending
- Size: 50
- Custom label: Family
- Split rows
- Aggregation: Terms
- Field: policystatus.deployment_or_auth_time
- Order by: Metric: Metric:Count
- Order: Descending
- Size: 50
- Custom label: Authorize Time
- Split rows
- Split rows
- Aggregation: Terms
- Field: protector.datastore.keyword
- Order by: Metric: Metric:Count
- Order: Descending
- Size: 50
- Custom label: Data Store Name
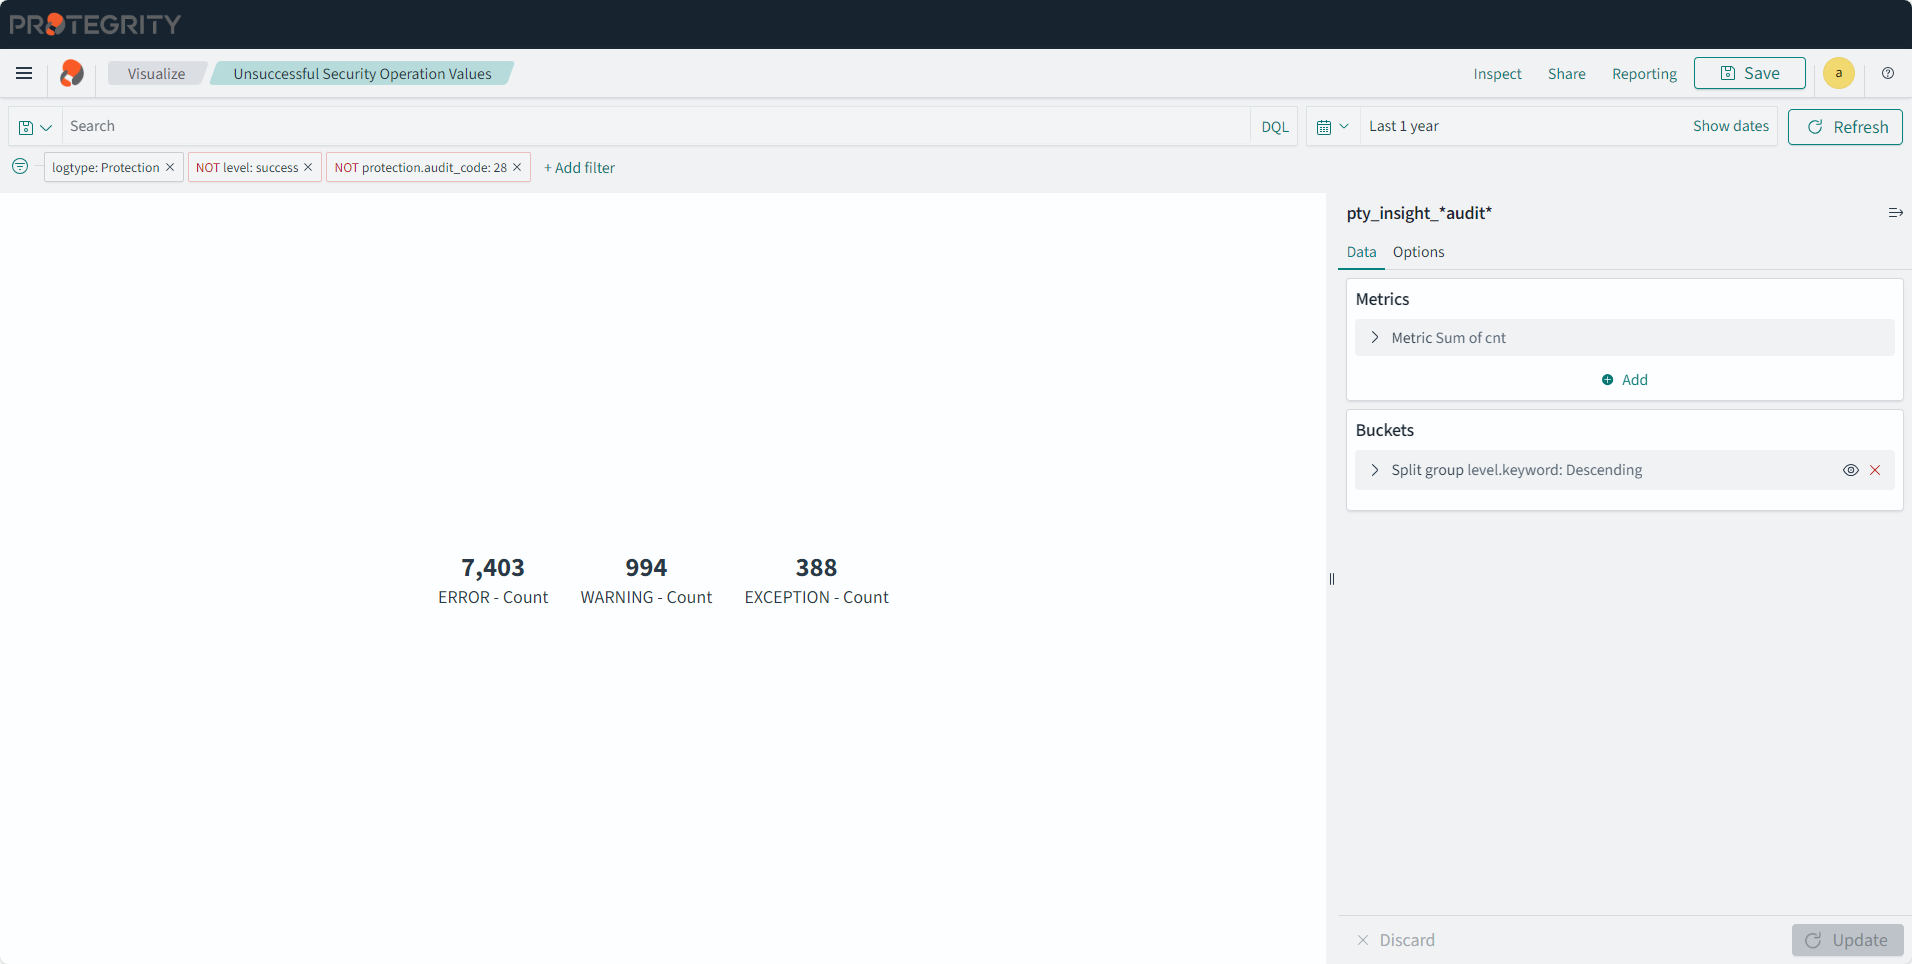
Unsuccessful Security Operation Values
Description: The metric displays unsuccessful security operation counts.
- Type: Metric
- Filter 1: logtype: Protection
- Filter 2: NOT level: success
- Filter 3: NOT protection.audit_code: 28
- Configuration:
- Index: pty_insight_*audit*
- Metrics:
- Aggregation: Sum
- Field: cnt
- Custom label: Count
- Buckets: - Split group - Aggregation: Terms - Field: level.keyword - Order by: Metric:Count - Order: Descending - Size: 10000
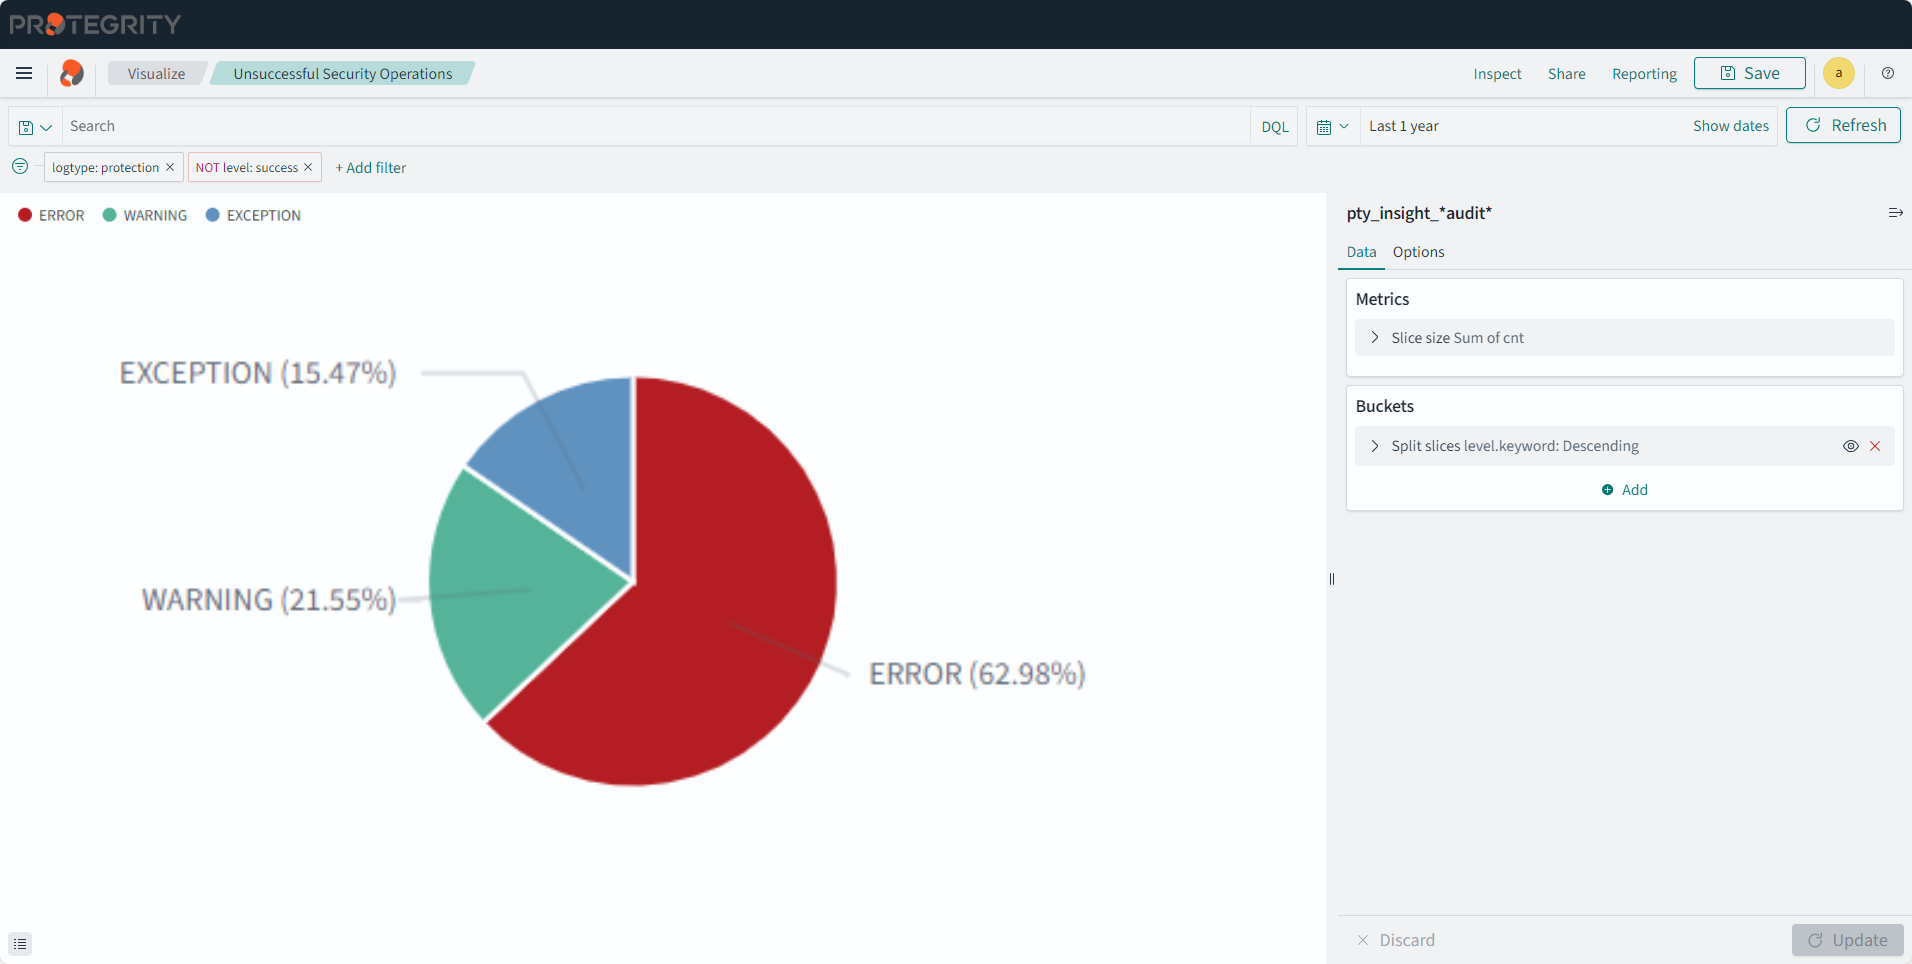
Unsuccessful Security Operations
Description: The pie chart displays unsuccessful security operations.
- Type: Pie
- Filter 1: logtype: protection
- Filter 2: NOT level: success
- Configuration:
- Index: pty_insight_*audit*
- Metrics:
- Slice size:
- Aggregation: Sum
- Field: cnt
- Custom label: Counts
- Slice size:
- Buckets:
- Split slices
- Aggregation: Terms
- Field: level.keyword
- Order by: Metric: Counts
- Order: Descending
- Size: 10000
- Split slices
Feedback
Was this page helpful?