Understanding the Audit Store node status
Viewing cluster status
The Overview screen shows information about the Audit Store cluster. Use this information to understand the health of the Audit Store cluster. Access the Overview screen by navigating to Audit Store > Cluster Management > Overview. The Overview screen is shown in the following figure.

The following information is shown on the Overview screen:
- Join Custer: Click to add a node to the Audit Store cluster. The node can be added to only one Audit Store cluster. On a multi-node cluster, this button is disabled after the node is added to the Audit Store cluster.
- Leave Cluster: Click to remove a node from the Audit Store cluster. This button is disabled after the node is removed from an Audit Store cluster.
- Cluster Name: The name displays the Audit Store cluster name.
- Cluster Status: The cluster status displays the index status of the worst shard in the Audit Store cluster. Accordingly, the following status information appears:
- Red status indicates that the specific shard is not allocated in the Audit Store cluster.
- Yellow status indicates that the primary shard is allocated but replicas are not allocated.
- Green status indicates that all shards are allocated.
- Number of Nodes: The count of active nodes in the Audit Store cluster.
- Number of Data Nodes: The count of nodes that have a data role.
- Active Primary Shards: The count of active primary shards in the Audit Store cluster.
- Active Shards: The total of active primary and replica shards.
- Relocating Shards: The count of shards that are being relocated.
- Initializing Shards: The count of shards that are under initialization.
- Unassigned Shards: The count of shards that are not allocated. The Audit Store will process and dynamically allocate these shards.
- OS Version: The version number of the OpenSearch used for the Audit Store.
- Current Master: The IP address of the current Audit Store node that is elected as master.
- Indices Count: The count of indices in the Audit Store cluster.
- Total Docs: The document count of all indices in the Audit Store cluster, excluding security index docs.
- Number of Master Nodes: The count of nodes that have the master-eligible role.
- Number of Ingest Nodes: The count of nodes that have the ingest role.
For more information about clusters, shards, docs, and other terms, refer to the OpenSearch documentation.
Viewing the node status
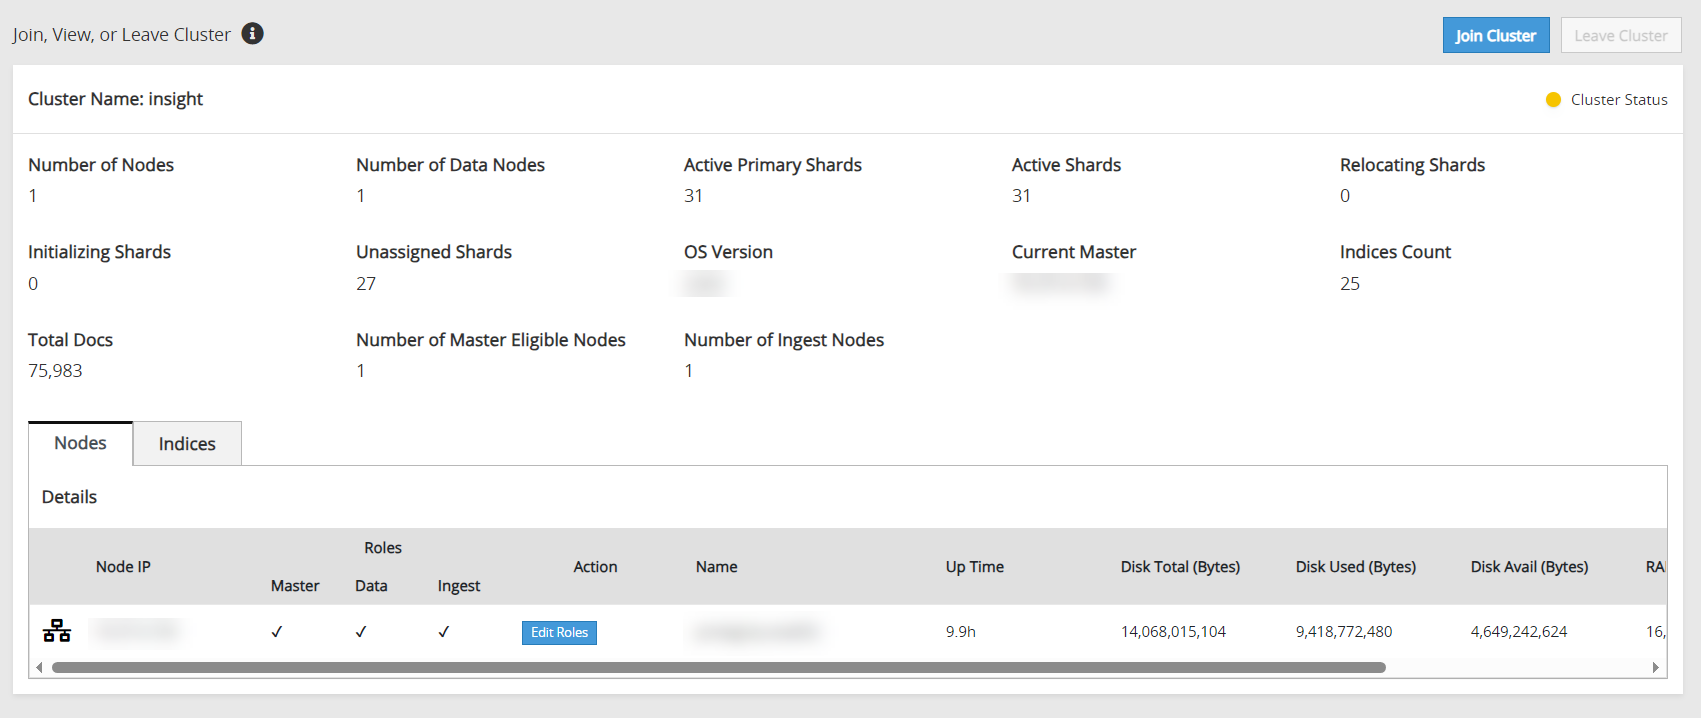
The Nodes tab on the Overview screen shows the status of the nodes in the Audit Store cluster. This tab displays important information about the node. The Nodes tab is shown in the following figure.

The following information is shown on the Nodes tab:
- Node IP: The IP address of the node.
- Role: The roles assigned to the node. By default, nodes are assigned all the roles. The following roles are available:
- Master: This is the master-eligible role. The nodes having this role can be elected as the cluster master to control the Audit Store cluster.
- Data: The nodes having the data role hold data and perform data-related operations.
- Ingest: The nodes having the ingest role process the logs received before the logs are stored in the Audit Store.
- Action: The button to edit the roles for the current node. For more information about roles, refer to Working with Audit Store roles.
- Name: The name for the node.
- Up Time: The uptime for the node.
- Disk Total (Bytes): The total disk space in bytes.
- Disk Used (Bytes): The disk space used in bytes.
- Disk Avail (Bytes): The available disk space in bytes.
- RAM Max (Bytes): The total RAM available in bytes.
- RAM Current (Bytes): The current RAM used in bytes.
Viewing the index status
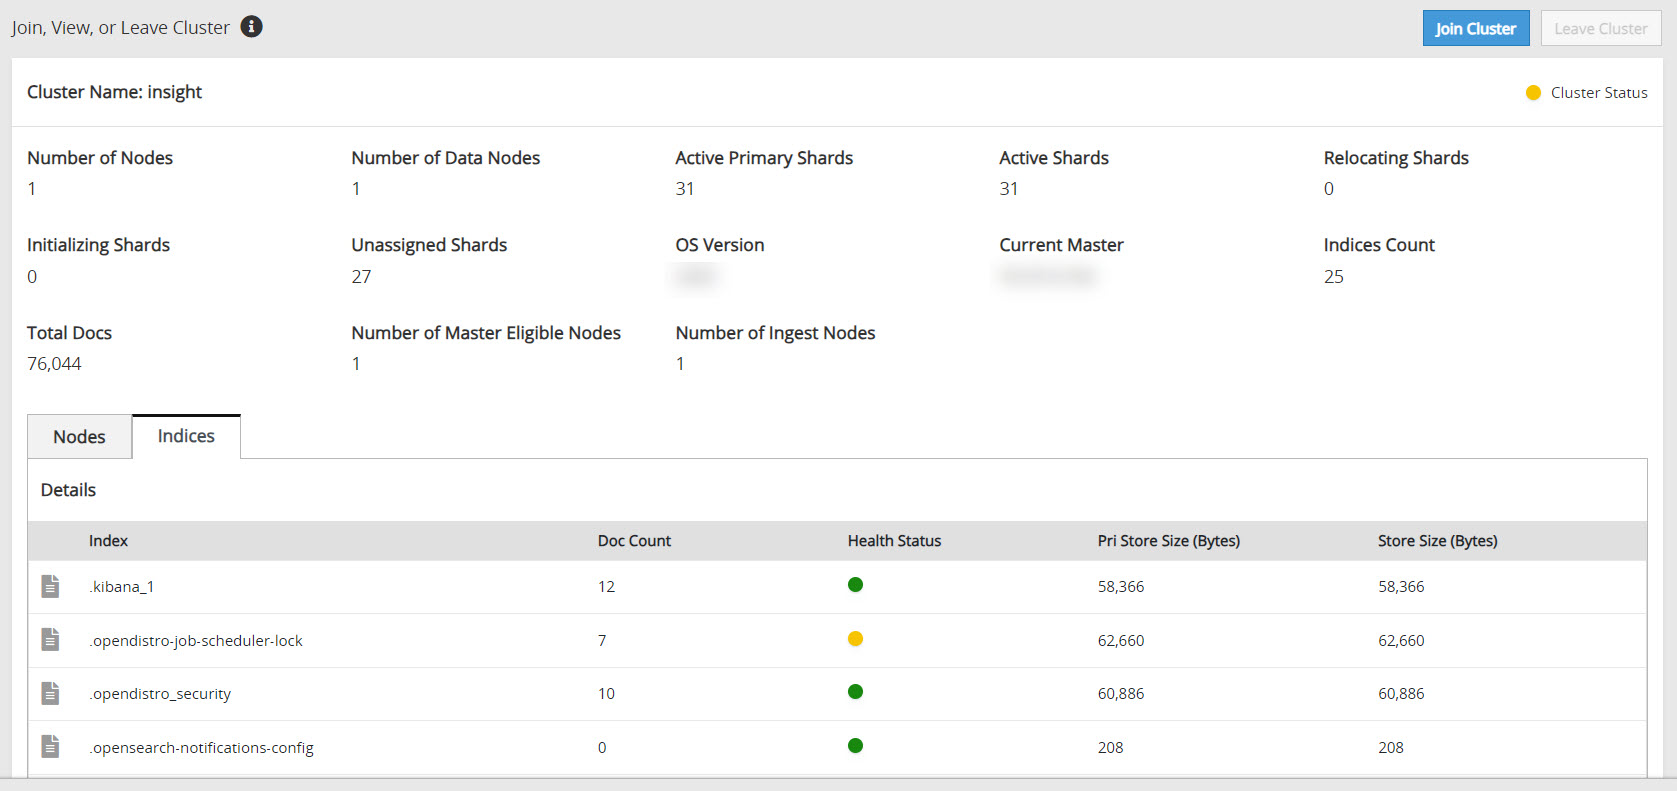
The Indices tab on the Overview screen shows the status of the indexes on the Audit Store cluster. This tab displays important information about the indexes. The Indices tab is shown in following figure.

The following information is shown on the Indices tab:
- Index: The index name.
- Doc Count: The number of documents in the index.
- Health Status: The index health per index. The index level health status is controlled by the worst shard status. Accordingly, the following status information appears:
- Red status indicates that the specific shard is not allocated in the Audit Store cluster.
- Yellow status indicates that the primary shard is allocated but replicas are not allocated.
- Green status indicates that all shards are allocated.
- Pri Store Size (Bytes): The primary store size in bytes for all shards, including shard replicas of the index.
- Store Size (Bytes): The total store size in bytes for all shards, including shard replicas of the index.
Feedback
Was this page helpful?