Logging follows a fixed routine. The system generates logs, which are collected and then forwarded to Insight. Insight stores the logs in the Audit Store. These log records are used in various areas, such as, alerts, reports, dashboards, and so on. This section explains the logging architecture.
This is the multi-page printable view of this section. Click here to print.
Maintaining Insight
- 1: Working with alerts
- 2: Index lifecycle management (ILM)
- 3: Viewing policy reports
- 4: Verifying signatures
- 5: Using the scheduler
1 - Working with alerts
Viewing alerts
Generated alerts are displayed on the Audit Store Dashboards. View and acknowledge the alerts from the alerting dashboard by navigating to OpenSearch Plugins > Alerting > Alerts. The alerting dashboard is shown in the following figure.
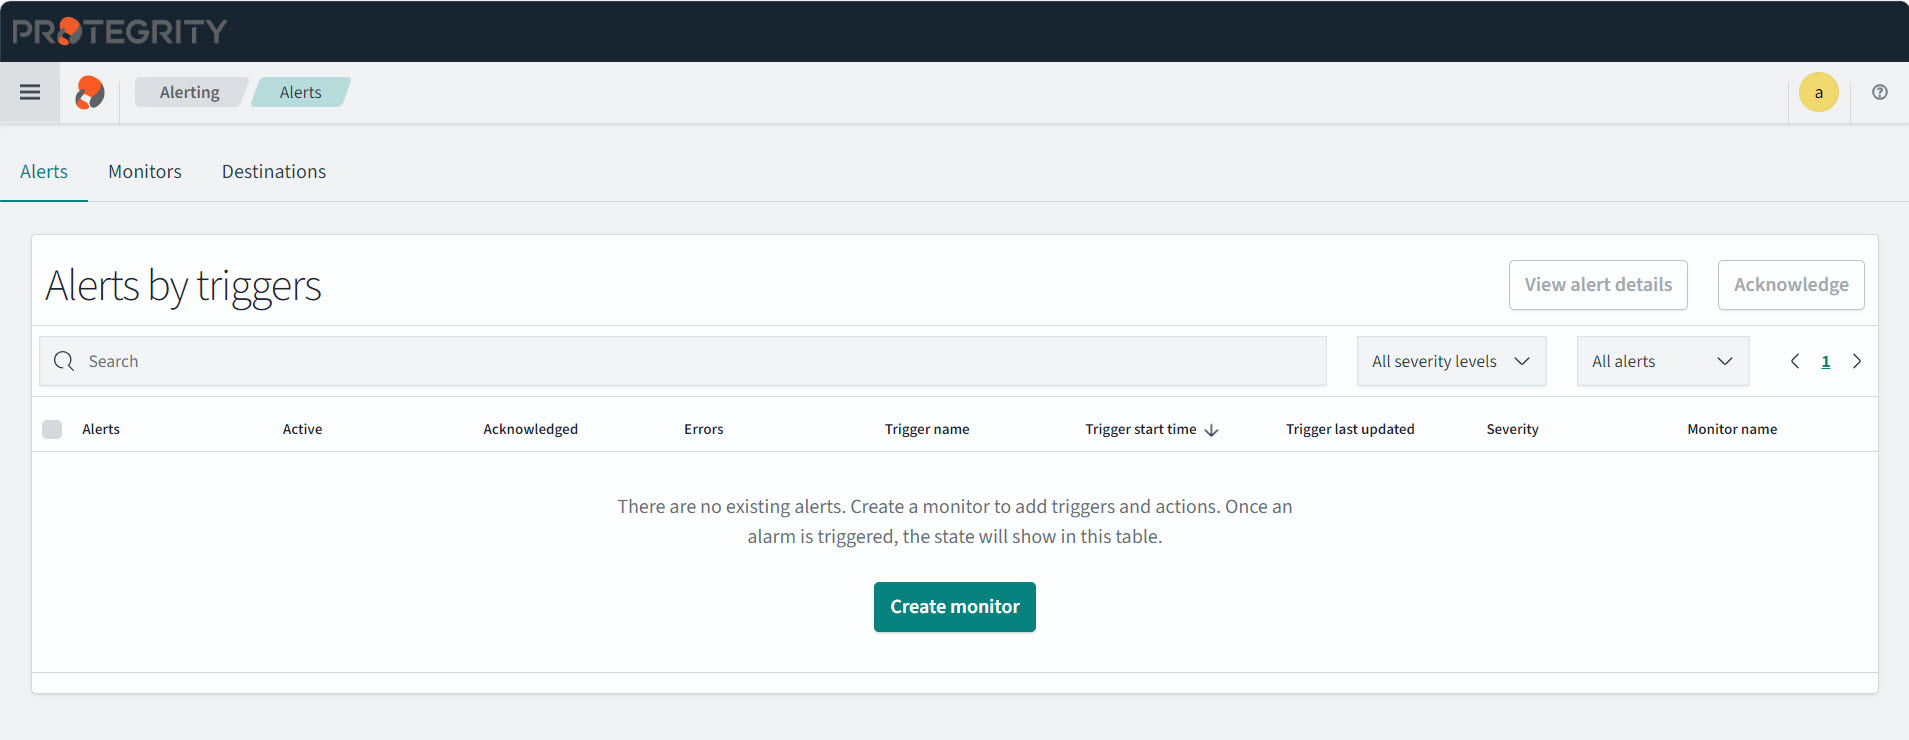
Destinations for alerts are moved to channels in Notifications. For more information about working with Monitors, Alerts, and Notifications, refer to the section Monitors in https://opensearch.org/docs/2.18/dashboards/.
Creating notifications
Create notification channels to receive alerts as per individual requirements. The alerts are sent to the destination specified in the channel.
Creating a custom webhook notification
A webhook notification sends the alerts generated by a monitor to a destination, such as, a web page.
Perform the following steps to configure the notification channel for generating webhook alerts:
Log in to the ESA Web UI.
Navigate to Audit Store > Dashboard.
The Audit Store Dashboards appears. If a new tab does not automatically open, click Open in a new tab.
From the menu, navigate to Management > Notifications > Channels.
Click Create channel.
Specify the following information under Name and description.
- Name: Http_webhook
- Description: For generating http webhook alerts.
Specify the following information under Configurations.
- Channel type: Custom webhook
- Method: POST
- Define endpoints by: Webhook URL
- Webhook URL: Specify the URL that receives the alert. For example https://webhook.site/9385a259-3b82-4e99-ad1e-1eb875f00734.
- Webhook headers: Specify the key value pairs for the webhook.
Click Send test message to send a message to the email recipients.
Click Create to create the channel.
The webhook is set up successfully.
Proceed to create a monitor and attach the channel created using the steps from Creating the monitor.
Creating email alerts using custom webhook
An email notification sends alerts generated by a monitor to an email address. It is also possible to configure the SMTP channel for sending an email alert. It is recommended to send email alerts using custom webhooks, which offers added security. The email alerts can be encrypted or non-encrypted. Accordingly, the required SMTP settings for email notifications must be configured on the ESA.
Perform the following steps to configure the notification channel for generating email alerts using custom webhooks:
Ensure that the following is configured as per the requirement:
- Configuring SMTP on the ESA, refer here.
Log in to the ESA Web UI.
Navigate to Audit Store > Dashboard.
The Audit Store Dashboards appears. If a new tab does not automatically open, click Open in a new tab.
From the menu, navigate to OpenSearch Plugins > Notifications > Channels.
Click Create channel.
Specify the following information under Name and description.
- Name: Unsecure_smtp_email
- Description: For generating unsecured SMTP email alerts.
Specify the following information under Configurations.
- Channel type: Custom webhook
- Define endpoints by: Custom attributes URL
- Type: HTTP
- Host: <ESA_IP>
- Port: 8588
- Path: rest/alerts/alerts/send_smtp_email_alerts
Under Query parameters, click Add parameter and specify the following information. Click Add parameter and add cc and bcc, if required.
- Key: to
- Value: <email_ID>
Under Webhook headers, click Add header and specify the following information.
- Key: Pty-Username
- Value:
%internal_scheduler;
Under Webhook headers, click Add header and specify the following information.
- Key: Pty-Roles
- Value: auditstore_admin
Click Create to save the channel configuration.
CAUTION: Do not click Send test message because the configuration for the channel is not complete.
The success message appears and the channel is created. The webhook for the email alerts is set up successfully.
Proceed to create a monitor and attach the channel created using the steps from Creating the monitor.
Perform the following steps to configure the notification channel for generating secure email alerts using custom webhooks:
Ensure that the following is configured as per the requirement:
- Configuring SMTP on the ESA, refer here.
Configure the certificates, if not already configured.
Download the CA certificate of your SMTP server.
Log in to the ESA Web UI.
Upload the SMTP CA certificate on the ESA.
Navigate to Settings > Network > Certificate Repository.
Upload your CA certificate to the ESA.
Select and activate your certificates in Management & Web Services from Settings > Network > Manage Certificates. For more information about ESA certificates, refer here.
Update the smtp_config.json configuration file.
Navigate to Settings > System > Files > smtp_config.json.
Click the Edit the product file (
 ) icon.
Update the following SMTP settings and the certificate information in the file. Sample values are provided in the following code, ensure that you use values as per individual requirements.
Set enabled to true to enable SMTP settings.
"enabled": true,Specify the host address for the SMTP connection.
"host": "192.168.1.10",Specify the port for the SMTP connection.
"port": "25",Specify the email address of the sender for the SMTP connection.
"sender_email_address": "<Email_ID>",Enable STARTTLS.
"use_start_tls": "true",Enable server certificate validation.
"verify_server_cert": "true",Specify the location for the CA certificate.
"ca_file_path": "/etc/ksa/certificates/mng/CA.pem",
Click Save.
Repeat the steps on the remaining nodes of the Audit Store cluster.
Navigate to Audit Store > Dashboard.
The Audit Store Dashboards appears. If a new tab does not automatically open, click Open in a new tab.
From the menu, navigate to OpenSearch Plugins > Notifications > Channels.
Click Create channel.
Specify the following information under Name and description.
- Name: Secure_smtp_email
- Description: For generating secured SMTP email alerts.
Specify the following information under Configurations.
- Channel type: Custom webhook
- Define endpoints by: Custom attributes URL
- Type: HTTP
- Host: <ESA_IP>
- Port: 8588
- Path: rest/alerts/alerts/send_secure_smtp_email_alerts
Under Query parameters, click Add parameter and specify the following information. Click Add parameter and add cc and bcc, if required.
- Key: to
- Value: <email_ID>
Under Webhook headers, click Add header and specify the following information.
- Key: Pty-Username
- Value:
%internal_scheduler;
Under Webhook headers, click Add header and specify the following information.
- Key: Pty-Roles
- Value: auditstore_admin
Click Create to save the channel configuration.
CAUTION: Do not click Send test message because the configuration for the channel is not complete.
The success message appears and the channel is created. The webhook for the email alerts is set up successfully.
Proceed to create a monitor and attach the channel created using the steps from Creating the monitor.
Creating an email notification
Perform the following steps to configure the notification channel for generating email alerts:
Log in to the ESA Web UI.
Navigate to Audit Store > Dashboard.
The Audit Store Dashboards appears. If a new tab does not automatically open, click Open in a new tab.
From the menu, navigate to Management > Notifications > Channels.
Click Create channel.
Specify the following information under Name and description.
- Name: Email_alert
- Description: For generating email alerts.
Specify the following information under Configurations.
- Channel type: Email
- Sender type: SMTP sender
- Default recipients: Specify the list of email addresses for receiving the alerts.
Click Create SMTP sender and add the following parameters.
- Sender name: Specify a descriptive name for sender.
- Email address: Specify the email address that must receive the alerts.
- Host: Specify the host name of the email server.
- Port: 25
- Encryption method: None
Click Create.
Click Send test message to send a message to the email recipients.
Click Create to create the channel.
The email alert is set up successfully.
Proceed to create a monitor and attach the channel created using the steps from Creating the monitor.
Creating the monitor
A monitor tracks the system and sends an alert when a trigger is activated. Triggers cause actions to occur when certain criteria are met. Those criteria are set when a trigger is created. For more information about monitors, actions, and triggers, refer to Alerting.
Perform the following steps to create a monitor. The configuration specified here is just an example. For real use, create whatever configuration is needed, per individual requirements:
Ensure that a notification is created using the steps from Creating notifications.
From the menu, navigate to OpenSearch Plugins > Alerting > Monitors.
Click Create Monitor.
Specify a name for the monitor.
For the Monitor defining method, select Extraction query editor.
For the Schedule, select 30 Minutes.
For the Index, select the required index.
Specify the following query for the monitor. Modify the query as per the requirement.
{
    "size": 0,
    "query": {
        "match_all": {
            "boost": 1
        }
    }
}
Click Add trigger and specify the information provided here.
Specify a trigger name.
Specify a severity level.
Specify the following code for the trigger condition:
ctx.results[0].hits.total.value > 0
Click Add action.
From the Channels list, select the required channel.
Add the following code in the Message field. The default message displayed might not be formatted properly. Update the message by replacing the Line spaces with the n escape code. The message value is a JSON value, use escape characters to structure the email properly using valid JSON syntax.
```
{
"message": "Please investigate the issue.\n  - Trigger: {{ctx.trigger.name}}\n  - Severity: {{ctx.trigger.severity}}\n  - Period start: {{ctx.periodStart}}\n  - Period end: {{ctx.periodEnd}}",
"subject": "Monitor {{ctx.monitor.name}} just entered alert status"
}
```
>   The **message** value is a JSON value. Be sure to use escape characters to structure the email properly using valid JSON syntax. The default message displayed might not be formatted properly. Update the message by replacing the Line spaces with the **\\n** escape code.
- Select the Preview message check box to view the formatted email message.
- Click Send test message and verify the recipient’s inbox for the message.
- Click Save to update the configuration.
2 - Index lifecycle management (ILM)
In the earlier versions of the ESA, the UI for Index Lifecycle Management was named as Information Lifecycle Management.
The following figure shows the ILM system components and the workflow.
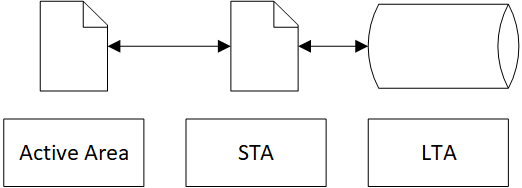
The ILM log repository is divided into the following parts:
- Active logs that may be required for immediate reporting. These logs are accessed regularly for high frequency reporting.
- Logs that are pushed to Short Term Archive (STA). These logs are accessed occasionally for moderate reporting frequency.
- Logs that are pushed to Long Term Archive (LTA). These logs are accessed rarely for low reporting frequency. The logs are stored where they can be backed up by the backup mechanism used by the enterprise.
The ILM feature in Protegrity Analytics is used to archive the log entries from the index. The logs generated for the ILM operations appear on this page. Only logs generated by ILM operation on the ESA v9.2.0.0 and above appear on the page after upgrading to the latest version of the ESA. For ILM logs generated on an earlier version of the ESA, navigate to Audit Store > Dashboard > Open in new tab, select Discover from the menu, select the time period, and search for the ILM logs using keywords for the additional_info.procedure field, such as, export, process_post_export_log, or scroll_index_for_export.
Use the search bar to filter logs. Click the Reset Search (![]() ) icon to clear the search filter and view all the entries. To search for the ILM logs using the origin time, specify the Origin Time(UTC) term within double quotes.
) icon to clear the search filter and view all the entries. To search for the ILM logs using the origin time, specify the Origin Time(UTC) term within double quotes.

Move entries out of the index when not required and import them back into the index when required using the export and import feature. Only one operation can be run at a time for each node for exporting logs or importing logs. The ILM screen is shown in the following figure.

The Viewer role user or a user with the viewer role can only view data on the ILM screen. Admin rights are required to use the import, export, migrate, and delete features of the ILM.
Use the ILM for managing indexes, such as, the audit index, the policy log index, the protector status index, and the troubleshooting index. The Audit Store Dashboards has the ISM feature for managing the other indexes. Using the ISM feature might result in a loss of logs and it is not advised to use the ILM feature where possible.
Exporting logs
As log entries fill the Audit Store, the size of the log index increases. This slows down log operations for searching and retrieving log entries. To speed up these operations, export log entries out of the index and store them in an external file. If required, import the entries again for audit and analysis.
Moving index entries out of the index file, removes the entries from the index file and places them in a backup file. This backup file is the STA and reduces the load and processing time for the main index. The backup file is created in the /opt/protegrity/insight/archive/ directory. To store the file at a different location, mount the destination in the /opt/protegrity/insight/archive/ directory. In this case, specify the directory name, for example, /opt/protegrity/insight/archive/
If the location is on the same drive or volume as the main index, then the size of the index would reduce. However, this would not be an effective solution for saving space on the current volume. To save space, move the backup file to a remote system or into LTA.
Only one export operation can be run at a time. Empty indexes cannot de exported and must be manually deleted.
On the ESA, navigate to Audit Store > Analytics > Index Lifecycle Management.
Click Export.
The Export Data screen appears.
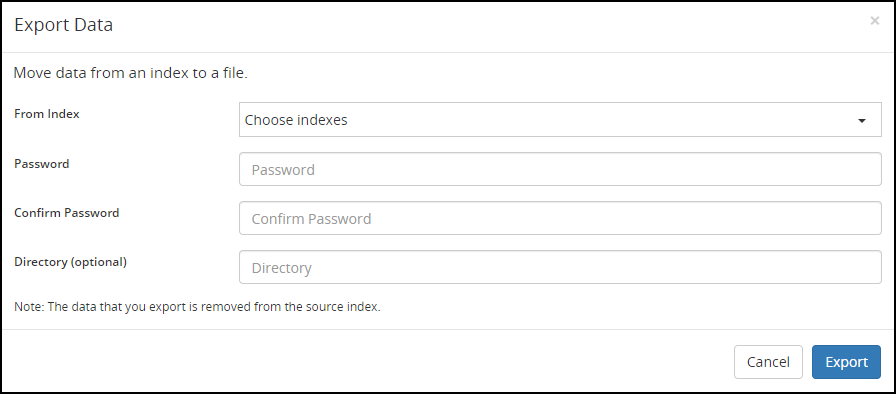
Complete the fields for exporting the log data from the default index.
The available fields are:
- From Index: Select the index to export data from.
- Password: Specify the password for securing the backup file.
- Confirm Password: Specify the password again for reconfirmation.
- Directory (optional): Specify the location to save the backup file. If a value is not specified, then the default directory
/opt/protegrity/insight/archive/is used.
Click Export.
Specify the root password.
Click Submit.
The log entries are extracted, then copied to the backup file, and protected using the password. After a successful export, the exported index will be deleted from Insight.
After the export is complete, move the backup file to a different location till the log entries are required. Import the entries in the index again for analysis or audit.
Importing logs
The exported log entires and secondary indexes are stored in a separate file. If these entries are required for analysis, then import them back into Insight. To be able to import, the archive file should be inside the archive directory or within a directory inside the archive directory.
Keep the passwords handy, in case the log entries were exported and protected using password protection. Do not rename the default index file name for this feature to work. Imported indexes are excluded and are not exported when the auto-export task is run from the scheduler.
On the ESA, navigate to Audit Store > Analytics > Index Lifecycle Management.
Click Import.
The Import Data screen appears.
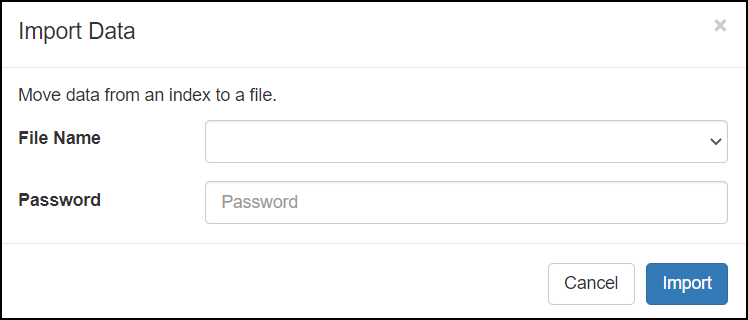
Complete the fields for importing the log data to the default index or secondary index.
The available fields are:
- File Name: Select the file name of the backup file.
- Password: Specify the password for the backup file.
Click Import.
Data will be imported to an index that is named using the file name or the index name. When importing a file which was exported in version 8.0.0.0 or later, then the new index name will be the date range of the entries in the index file using the format pty_insight_audit_ilm_(from_date)-(to_date). For example, pty_insight_audit_ilm_20191002_113038-20191004_083900.
Deleting indexes
Use the Delete option to delete indexes that are not required. Only delete custom indexes that are created and listed in the Source list. Deleting the index will lead to a permanent loss of data in the index. If the index was not archived earlier, then the logs from the index deleted cannot be recreated or retrieved.
On the ESA, navigate to Audit Store > Analytics > Index Lifecycle Management.
Click Delete.
The Delete Index screen appears.
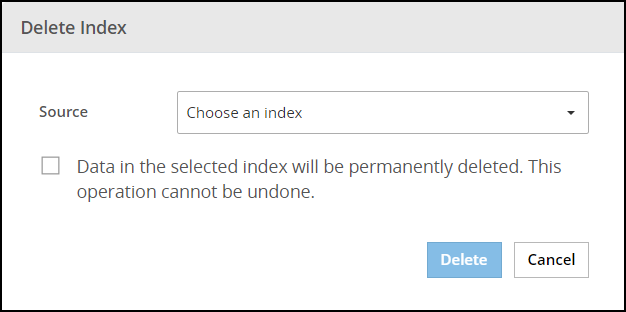
Select the index to delete from the Source list.
Select the Data in the selected index will be permanently deleted. This operation cannot be undone. check box.
Click Delete.
The Authentication screen appears.

Enter the root password.
Click Submit.
3 - Viewing policy reports
If a report is present where policies were not modified, then a breach might have occurred. These instances can be further analyzed to find and patch security issues. A new policy report is generated when this reporting agent is first installed on the ESA. This ensures that the initial state of all the policies on all the data stores in the ESA. A user can then use the Protegrity Analytics to list all the reports that were saved over time and select the required reports.
Ensure that the required policies that must be displayed in the report are deployed. Perform the following steps to view the policies deployed.
- Log in to the ESA Web UI.
- Navigate to Policy Management > Policies & Trusted Application > Policies.
- Verify that the policies to track are deployed and have the Deploy Status as OK.
If the reporting tool is installed when a policy is being deployed, then the policy status in the report might show up as Unknown or as a warning. In this case, manually deploy the policy again so that it is displayed in the Policy Report.
Perform the following steps to view the policy report.
In the ESA, navigate to Audit Store > Analytics > Policy Report.
The Policy screen appears.
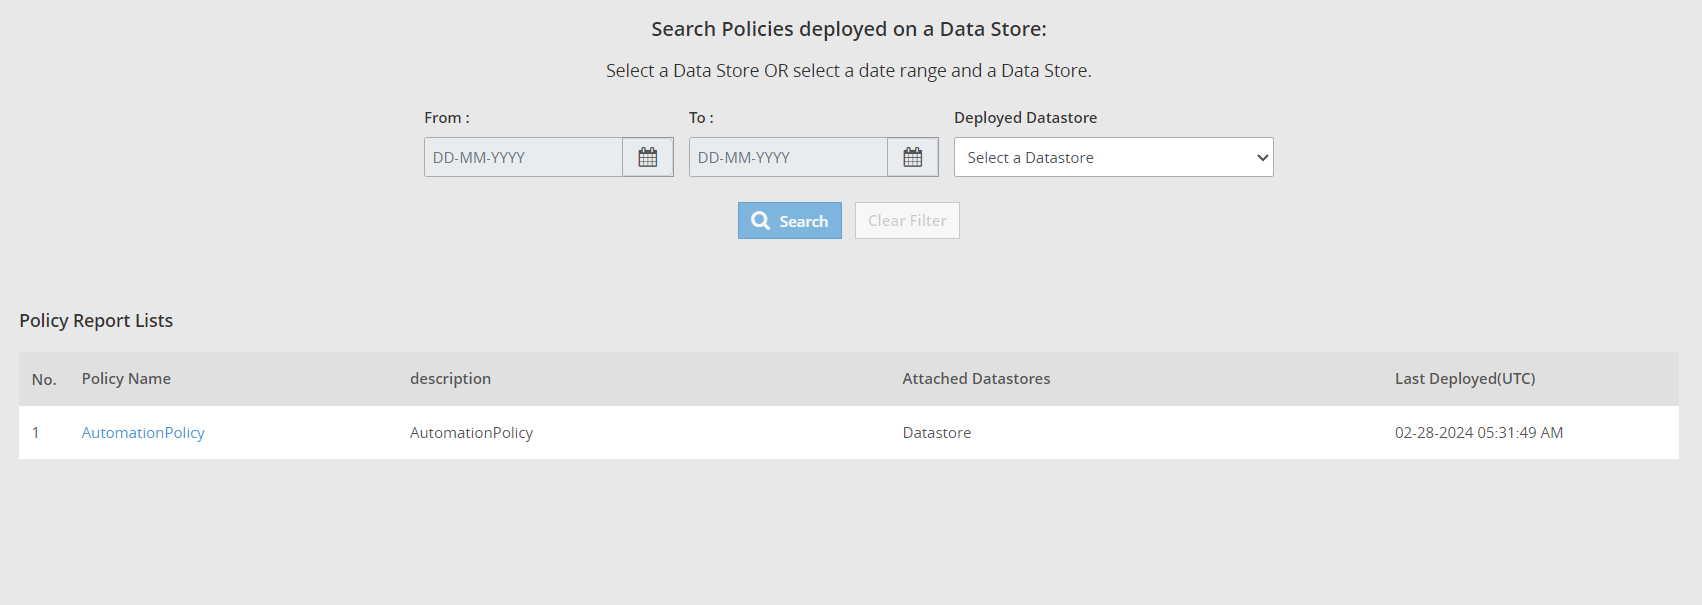
Select a time period for the reports using the From and To date picker. This is an optional step. The time period narrows the search results for the number of reports displayed for the selected data store.
Select a data store from the Deployed Datastore list.
Click Search.
The reports are filtered and listed based on the selection.

Click the link for the report to view.
For every policy deployed, the following information is displayed:
- Policy details: This section displays the name, type, status, and last modified time for the policy.
- List of Data Elements: This table displays the name, description, type, method, and last modified date and time for a data element in the policy.
- List of Data Stores: This table lists the name, description, and last modified date and time for the data store.
- List of Roles: This table lists the name, description, mode, and last modified date and time for a role.
- List of Permissions: This table lists the various roles and the permissions applicable with the role.
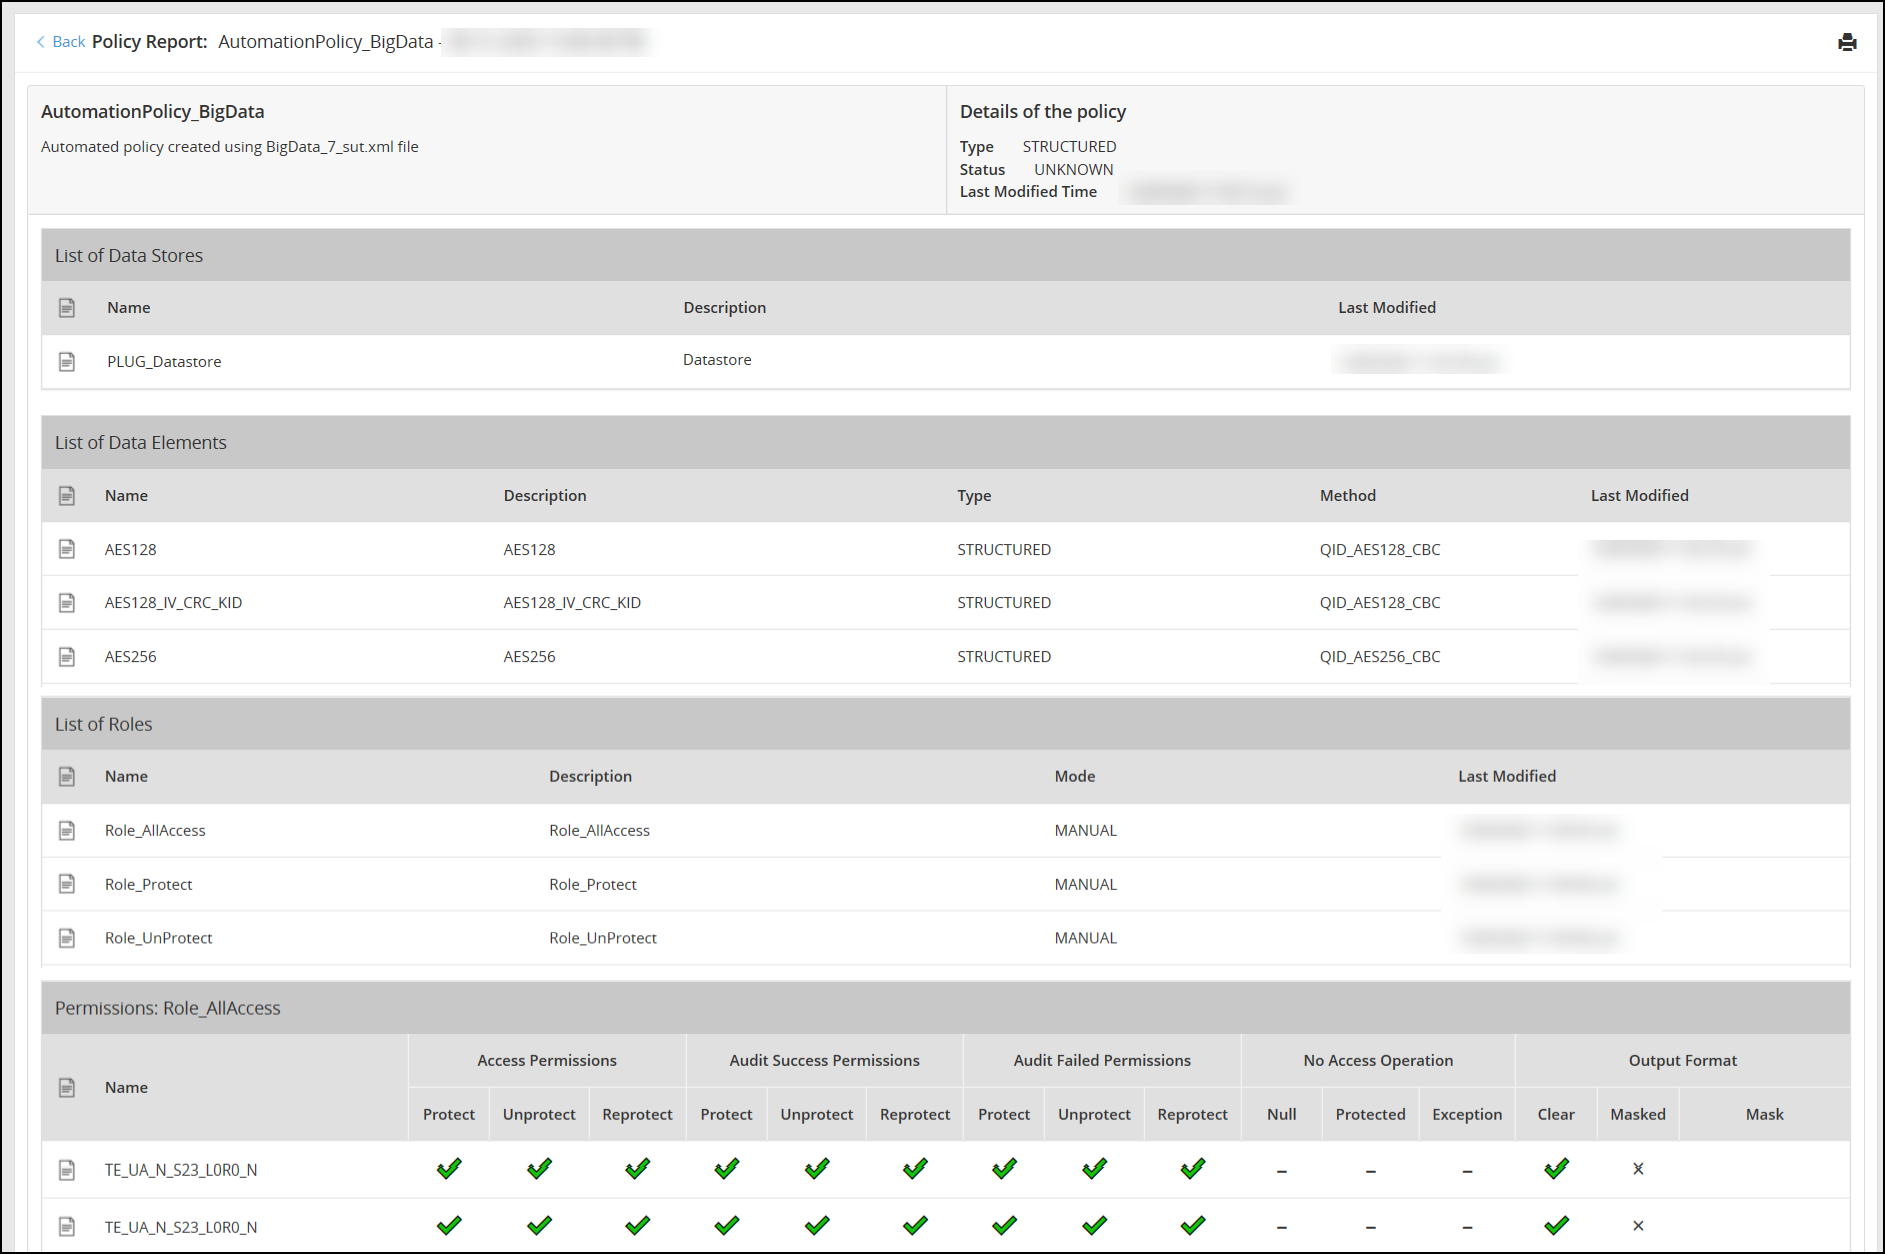
Print the report for comparing and analyzing the different reports that are generated when policies are deployed or undeployed. Alternatively, click the Back button to go back to the search results. Print the report using the landscape mode.
4 - Verifying signatures
The log entries having checksums are identified. These entries are then processed using the signature key and the checksum received in the log entry from the protector is checked. If both the checksum values match, then the log entry has not been tampered with. If a mismatch is found, then it might be possible that the log entry was tampered or there is an issue receiving logs from a protector. These can be viewed on the Discover screen by using the following search criteria.
logtype:verification
The Signature Verification screen is used to create jobs. These jobs can be run as per a schedule using the scheduler.
For more information about scheduling signature verification jobs, refer here.
To view the list of signature verification jobs created, from the Analytics screen, navigate to Signature Verification > Jobs.

The lifecycle of an Ad-Hoc job is shown in the following figure.
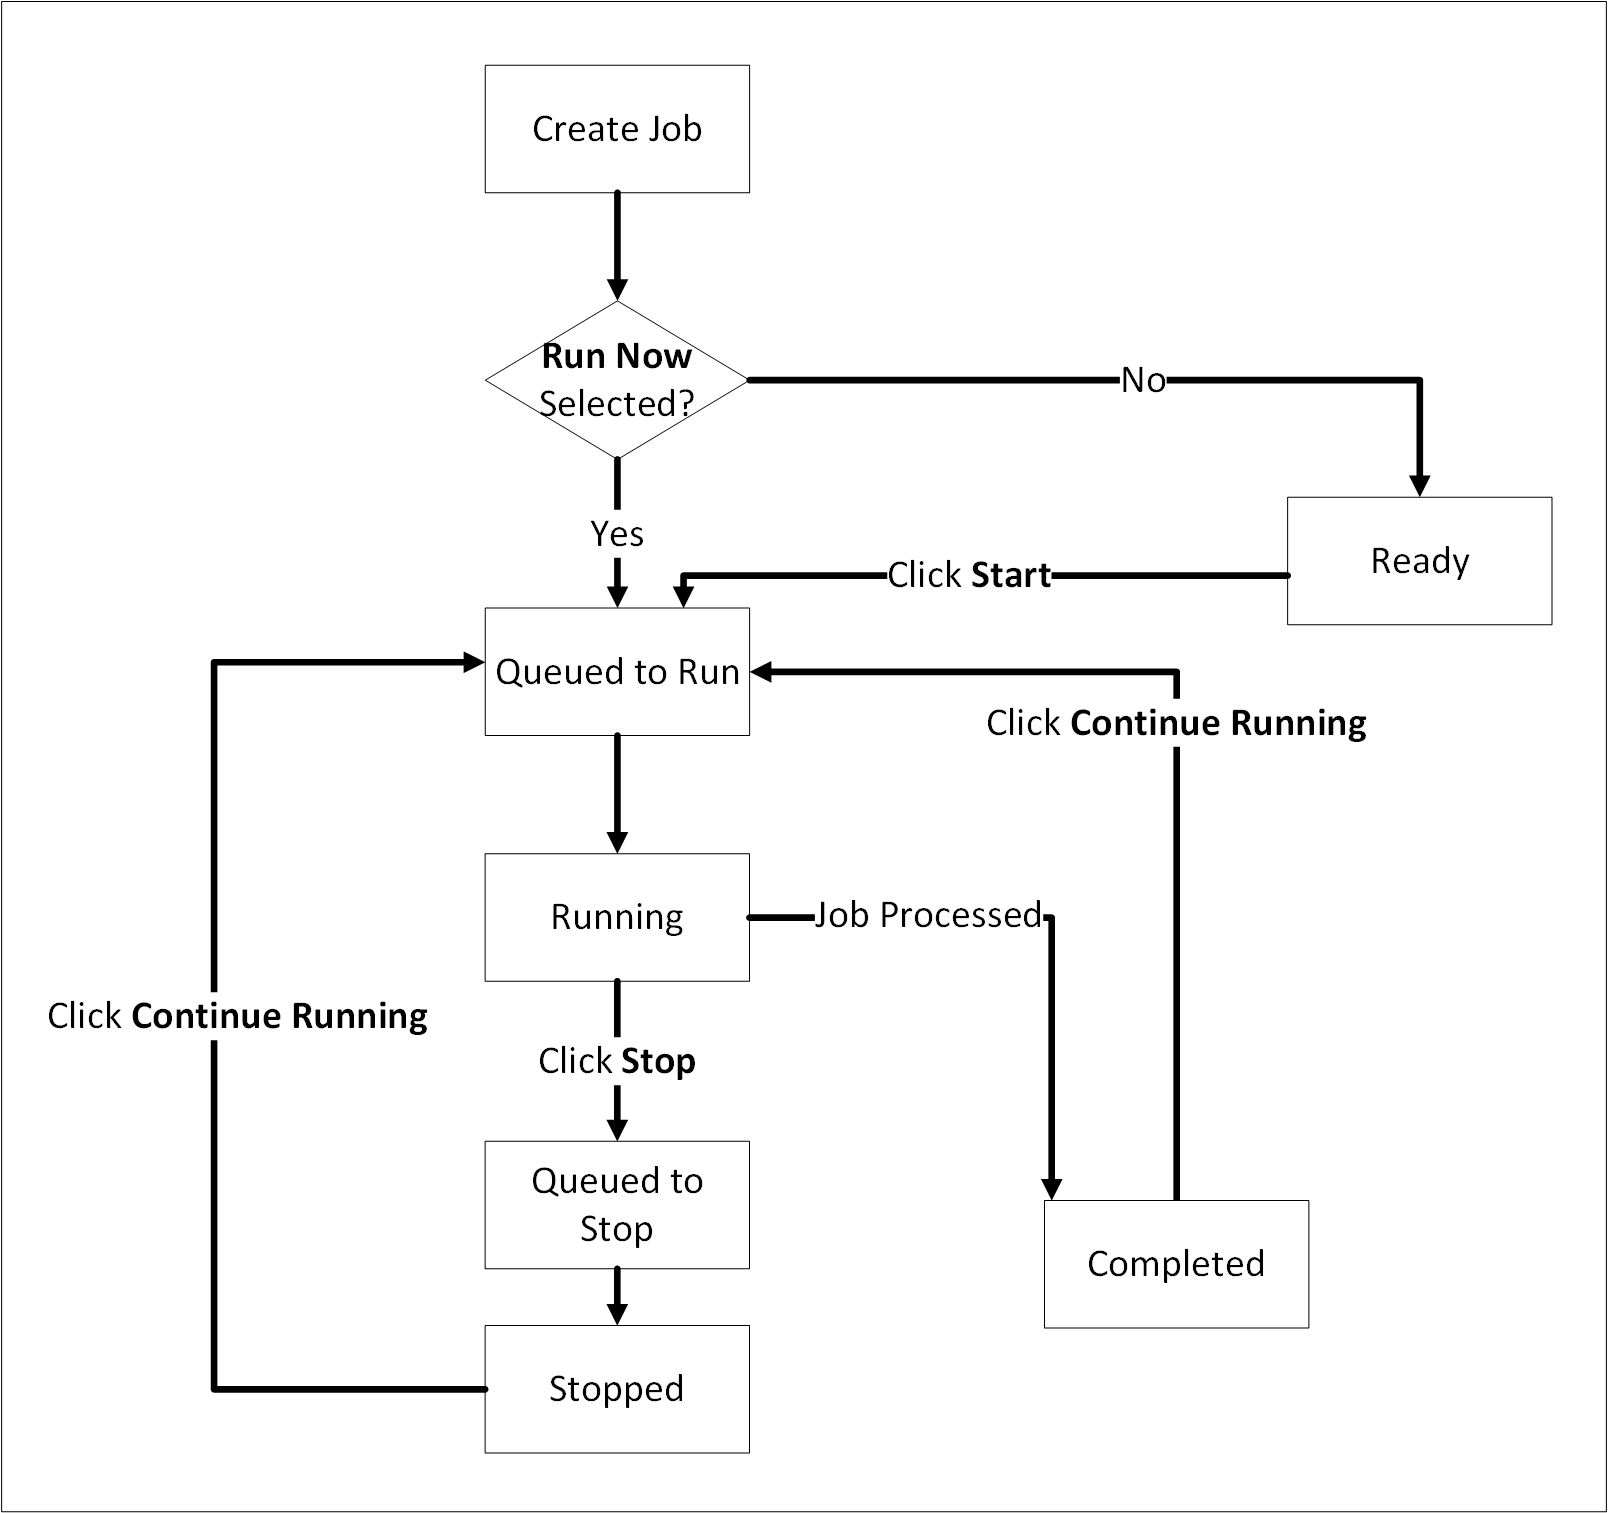
The Ad-Hoc job lifecycle is described here.
A job is created.
If Run Now is selected while creating the job, then the job enters the Queued to Run state.
If Run Now is not selected while creating the job, then the job enters the Ready state. The job will only be processed and enters the Queued to Run state by clicking the Start button.
When the scheduler runs, based on the scheduler configuration, the Queued to Run jobs enter the Running state.
After the job processing completes, the job enters the Completed state. Click Continue Running to move the job to the Queued to Run state for processing any new logs generated.
If Stop is clicked while the job is running, then the job moves to the Queued to Stop state, and then moves to the Stopped state.
Click Continue Running to re-queue the job and move the job to the Queued to Run state.
A System job is created by default for verifying signatures. This job runs as per the signature verification schedule to processes the audit log signatures.
The logs that fail verification are displayed in the following locations for analysis.
- In Discover using the query logtype:verification.
- On the Signature Verification > Logs tab.
When the signature verification for an audit log fails, the failure logs are logged in Insight. Alerts can be generated by using monitors that query the failed logs.
The lifecycle of a System job is shown in the following figure.
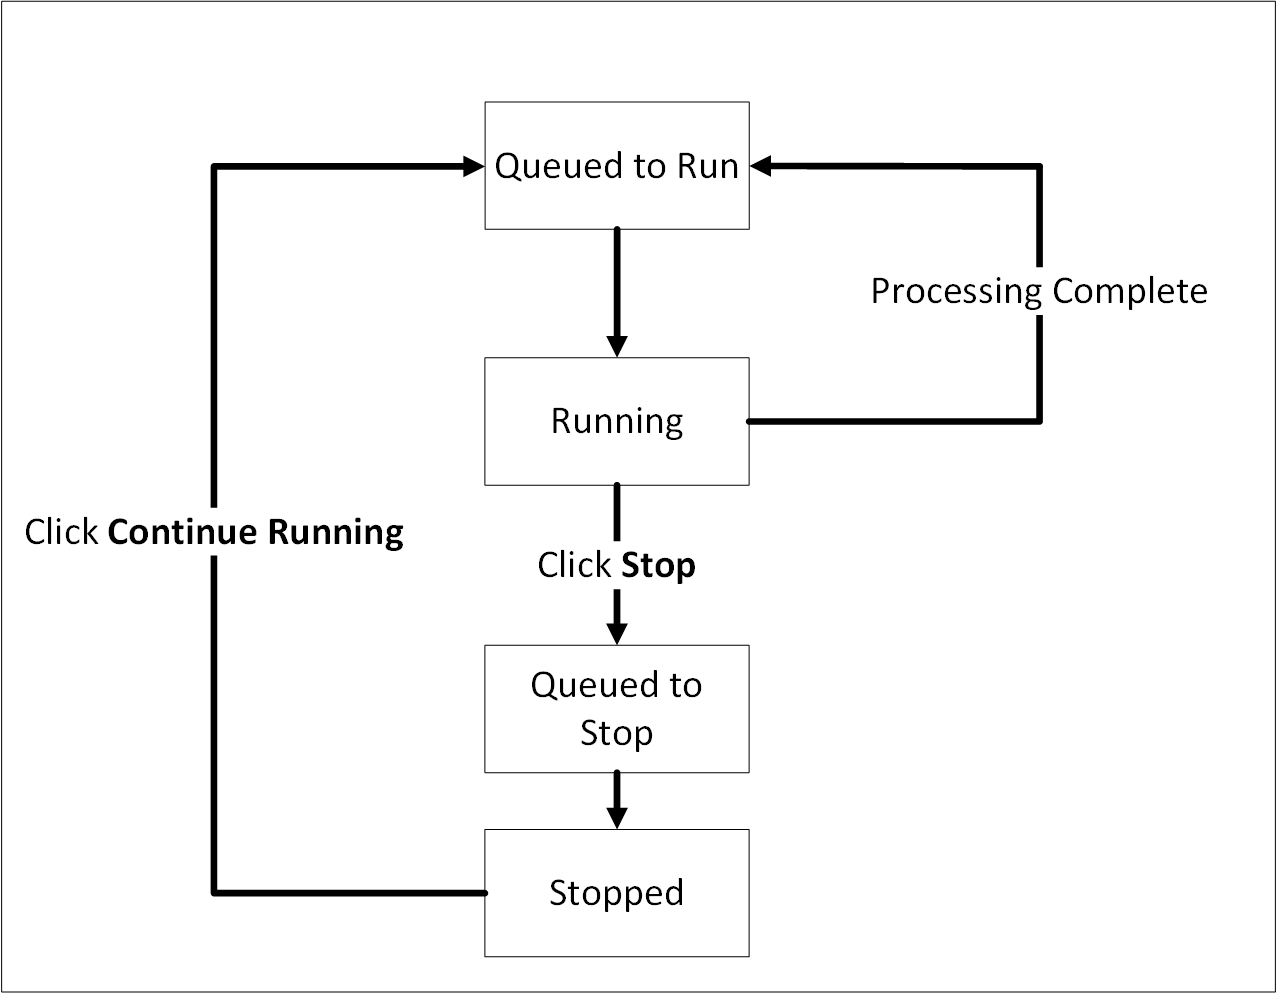
The System job lifecycle is described here.
- The System job is created when Analytics is initialized or the ESA is upgraded and enters the Queued to Run state.
- When the scheduler runs, then the job enters the Running state.
- After processing is complete, then the job returns to the Queued to Run state because it is a system job that needs to keep processing records as they arrive.
- While the job is running, clicking Stop moves the job to the Queued to Stop state followed by the Stopped state.
- If the job is in the Stopped state, then clicking Continue Running moves the job to the Queued to Run state.
Working with signatures
The list of signature verification jobs created is available on the Signature Verification tab. From this tab, view, create, edit, and execute the jobs. Jobs can also be stopped or continued from this tab.
To view the list of signature verification jobs, from the Analytics screen, navigate to Signature Verification > Jobs.
The viewer role user or a user with the viewer role can only view the signature verification jobs. The admin rights are required to create or modify signature verification jobs.
After initializing Analytics during a fresh installation, ensure that the priority IP list for the default signature verification jobs is updated. The list is updated by editing the task from Analytics > Scheduler > Signature Verification Job. During the upgrade from an earlier version of the ESA, if Analytics is initialized on an ESA, then the ESA will be used for the priority IP, else update the priority IP for the signature verification job after the upgrade is complete. If multiple ESAs are present in the priority list, then more ESAs are available to process the signature verifications jobs that must be processed.
For example, if the max jobs to run on an ESA is set to 4 and 10 jobs are queued to run on 2 ESAs, then 4 jobs are started on the first ESA, 4 jobs are started on the second ESA, and 2 jobs will be queued to run till an ESA job slot gets free to accept and run the queued job.

Use the search field to filter and find the required verification job. Click the Reset Search icon to clear the filter and view all jobs. Use the following information while using the search function:
- Type the entire word to view results containing the word.
- Use wildcard characters for searching. This is not applicable for wildcard characters used within double quotes.
- Search for a specific word by specifying the word within double quotes. This is required for words having the hyphen (-) character that the system treats as a space.
- Specify the entire word, if the word contains the underscore (_) character.
The following columns are available on this screen. Click a label to sort the items in the ascending or descending order. Sorting is available for the Name, Created, Modified, and Type columns.
| Column | Description |
|---|---|
| Name | A unique name for the signature verification job. |
| Indices | A list of indexes on which the signature verification job will run. |
| Query | The signature verification query. |
| Pending | The number of logs pending for signature verification. |
| Processed | The current number of logs processed. |
| Not-Verified | The number of logs that could not be verified. Only protector and PEP server logs for version 8.1.0.0 and higher can be verified. |
| Success | The number of verifiable logs where signature verification succeeded. |
| Failure | The number of verifiable logs where signature verification failed. |
| Created | The creation date of the signature verification job. |
| Modified | The date on which the signature verification job was modified. |
| Type | The type of the signature verification job. The available options are SYSTEM where the job is created by the system and ADHOC where the custom job is created by a user. |
| State | Shows the job status. |
| Action | The actions that can be performed on the signature verification job. |
The root or admin rights are required to create or modify signature verification jobs.
The available statuses are:
 : Queued to run. The job will run soon.
 : Ready. The job will run when the scheduler initiates the job.
 : Running. The job is running. Click Stop from Actions to stop the job.
 : Queued to stop. The job processing will stop soon.
 : Stopped. The job has been stopped. Click Continue Running from Actions to continue the job. If a signature verification scheduler job is stopped from the Scheduler > Monitor page, then the status might be updated on this page after about 5 minutes.
 : Completed. The job is complete. Click Continue Running from Actions to run the job again.
The available actions are:
- Click the Edit icon (
 ) to update the job.
 - Click the Start icon (
 ) to run the job.
 - Click the Stop icon (
 ) to stop the job.
 - Click the Continue Running icon (
 ) to resume the job.
Creating a signature verification job
Specify a query for creating the signature verification job. Additionally, select the indexes that the signature verification job needs to run on.
In Analytics, navigate to Signature Verification > Jobs.
The Signature Verification Jobs screen is displayed.
Click New Job.
The Create Job screen is displayed.
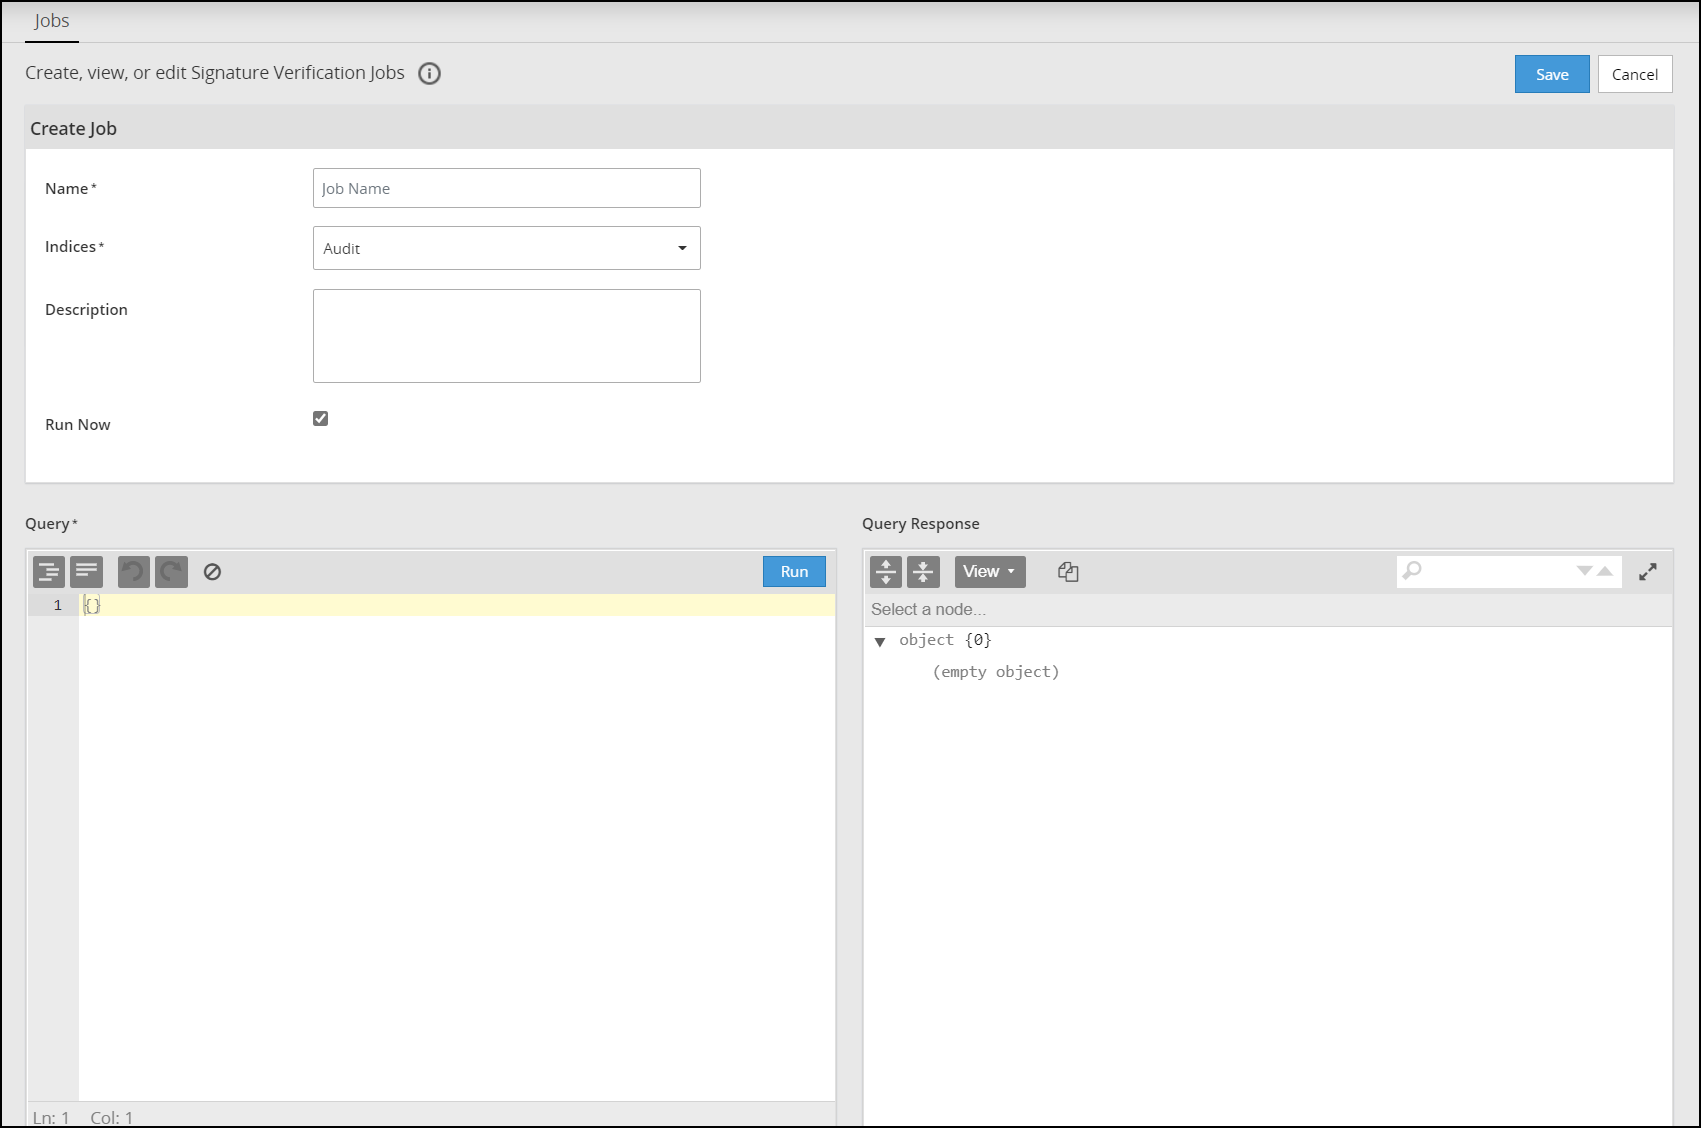
Specify a unique name for the job in the Name field.
Select the index or alias to query from the Indices list. An alias is a reference to one or more indexes available in the Indices list. The alias is generated and managed by the system and cannot be created or deleted.
Specify a description for the job in the Description field.
Select the Run Now check box to run the job after it is created.
Use the Query field to specify a JSON query. Errors in the code, if any, are marked with a red cross before the code line.
The following options are available for working with the query:
- Indent code (
 ): Click to format the code using tab spaces.
 - Remove white space from code (
 ): Click to format the code by removing the white spaces and displaying the query in a continuous line.
 - Undo (
 ): Click to undo the last change made.
 - Redo (
 ): Click to redo the last change made.
 - Clear (
 ): Click to clear the query text.
- Indent code (
Specify the contents of the query tag for creating the JSON query. For example, specify the query
```
{
   "query":{
      "match" : {
         "*field\_name*":"*field\_value*"
      }
   }
}
```

as

```
{
      "match" : {
         "*field\_name*":"*field\_value*"
      }
   }
```
Click Run to test the query.
View the result displayed in the Query Response field.
The following options are available to work with the output:
- Expand all fields (
 ): Click to expand all fields in the result.
 - Collapse all fields (
 ): Click to collapse all fields in the result.
 - Switch Editor Mode (
 ): Click to select the editor mode. The following options are available:
- View: Switch to the tree view.
- Preview: Switch to the preview mode.
- Copy (
 ): Click to copy the contents of the output to the clipboard.
 - Search fields and values (
 ): Search for the required text in the output.
 - Maximize (
 ): Click to maximize the Query Response field. Click Minimize (
 ) to minimize the field to the original size when maximized.
- Expand all fields (
Click Save to save the job and return to the Signature Verification Jobs screen.
Editing a signature verification job
Edit an adhoc signature verification job to update the name and the description of the job.
In Analytics, navigate to Signature Verification > Jobs.
The Signature Verification Jobs screen is displayed.
Locate the job to update.
From the Actions column, click the Edit (
 ) icon.
The Job screen is displayed.
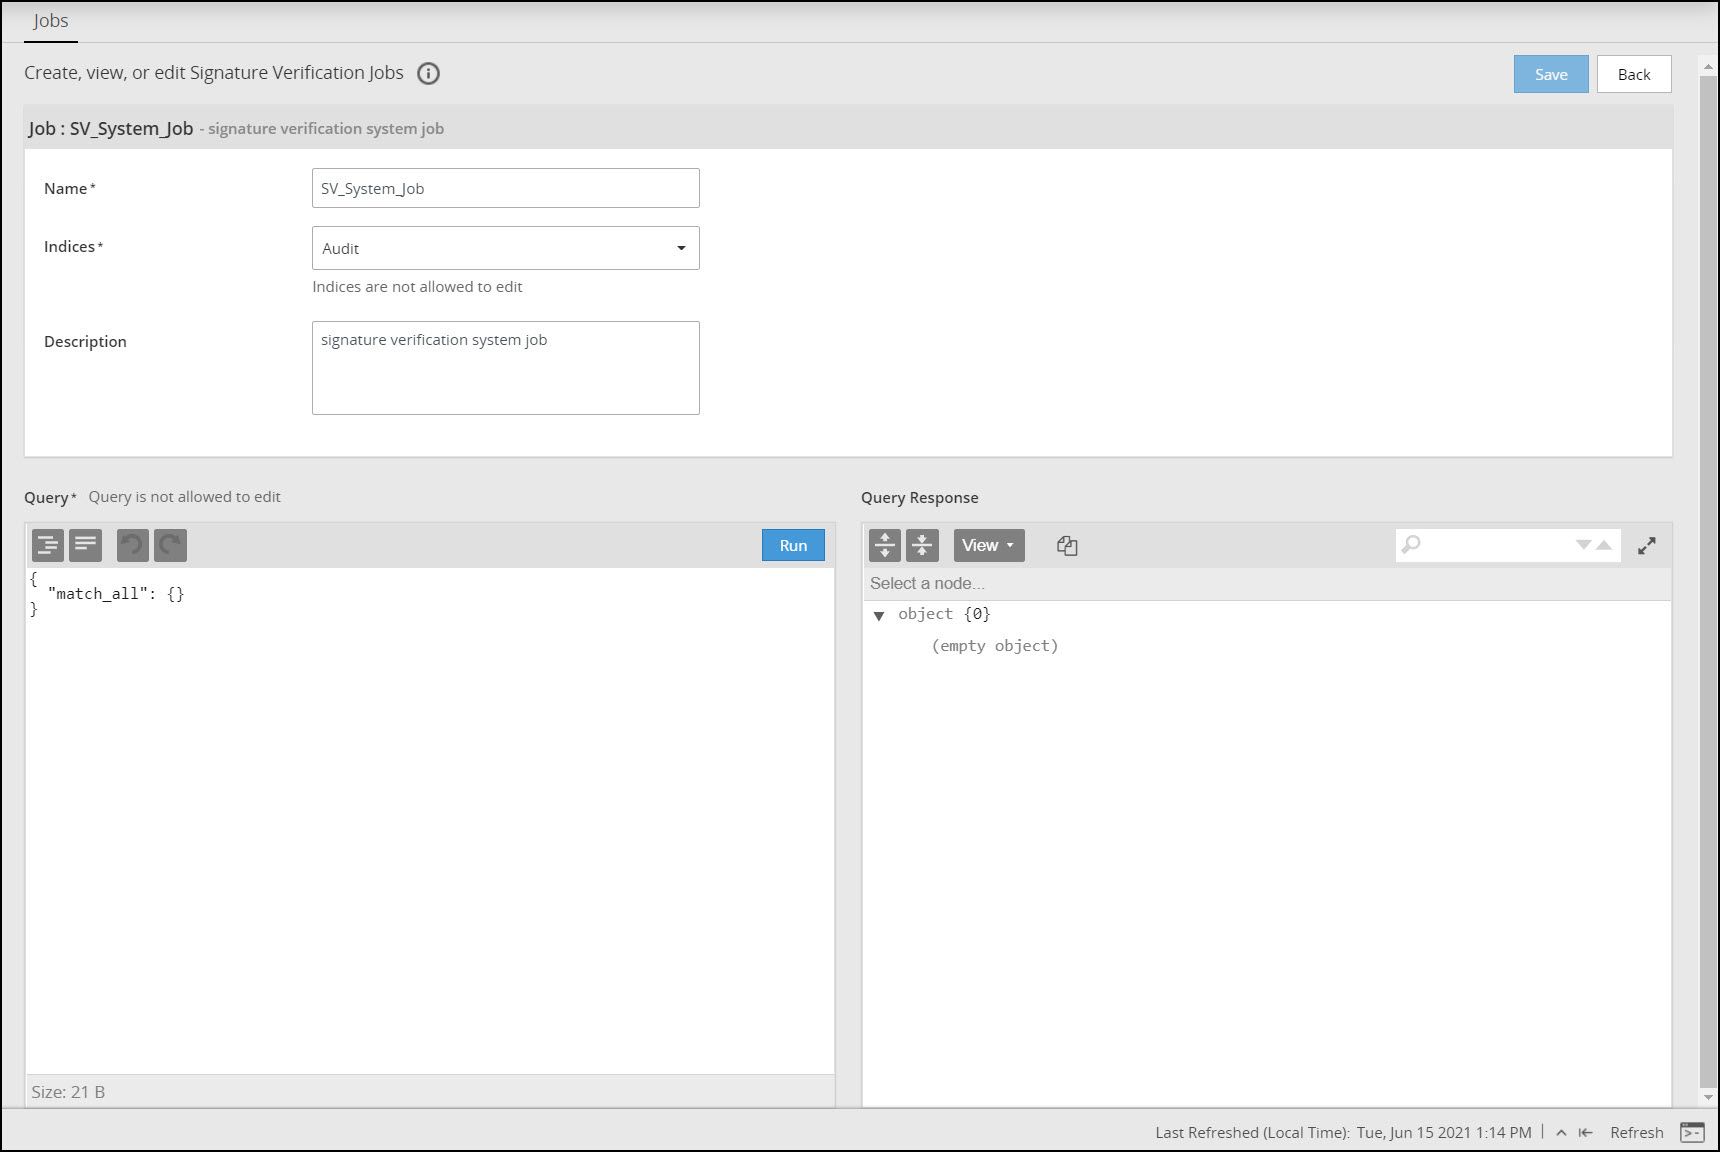
Update the name and description as required.
The Indices and Query options can be edited if the job is in the Ready state, else they are available in the read-only mode.
View the JSON query in the Query field.
The following options are available for working with the query:
- Indent code (
 ): Click to format the code using tab spaces.
 - Remove white space from code (
 ): Click to format the code by removing the white spaces and displaying the query in a continuous line.
 - Undo (
 ): Click to undo the last change made.
 - Redo (
 ): Click to redo the last change made.
- Indent code (
Click Run to test the query, if required.
View the result displayed in the Query Response field.
The following options are available to work with the output:
- Expand all fields (
 ): Click to expand all fields in the result.
 - Collapse all fields (
 ): Click to collapse all fields in the result.
 - Switch Editor Mode (
 ): Click to select the editor mode. The following options are available:
- View: Switch to the tree view.
- Preview: Switch to the preview mode.
- Copy (
 ): Click to copy the contents of the output to the clipboard.
 - Search fields and values (
 ): Search for the required text in the output.
 - Maximize (
 ): Click to maximize the Query Response field. Click Minimize (
 ) to minimize the field to the original size when maximized.
- Expand all fields (
Click Save to update the job and return to the Signature Verification Jobs screen.
5 - Using the scheduler
To view the list of tasks that are scheduled, from the Analytics screen, navigate to Scheduler > Tasks. The viewer role user or a user with the viewer role can only view logs and history related to the Scheduler. You need admin rights to create or modify schedules.
The following tasks are available by default:
| Task | Description |
|---|---|
| Export Troubleshooting Indices | Scheduled task for exporting logs from the troubleshooting index. |
| Export Policy Log Indices | Scheduled task for exporting logs from the policy index. |
| Export Protectors Status Indices | Scheduled task for exporting logs from the protector status index. |
| Delete Miscellaneous Indices | Scheduled task for deleting old versions of the miscellaneous index that are rolled over. |
| Delete DSG Error Indices | Scheduled task for deleting old versions of the DSG error index that are rolled over. |
| Delete DSG Usage Indices | Scheduled task for deleting old versions of the DSG usage matrix index that are rolled over. |
| Delete DSG Transaction Indices | Scheduled task for deleting old versions of the DSG transaction matrix index that are rolled over. |
| Signature Verification | Scheduled task for performing signature verification of log entries. |
| Export Audit Indices | Scheduled task for exporting logs from the audit index. |
| Rollover Index | Scheduled task for performing an index rollover. |
Ensure that the scheduled tasks are disabled on all the nodes before upgrading the ESA.
The scheduled task values on a new installation and an upgraded machine might differ. This is done to preserve any custom settings and modifications for the scheduled task. After upgrading the ESA, revisit the scheduled task parameters and modify them if required.
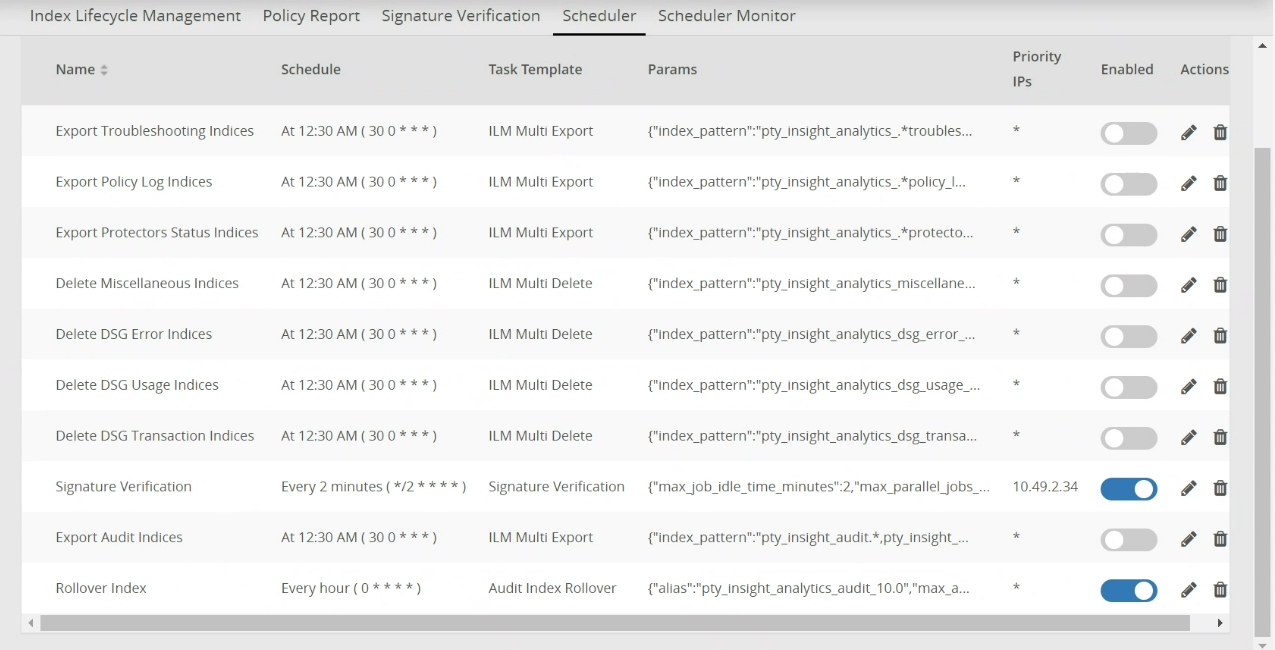
The list of scheduled tasks are displayed. You can create tasks, view, edit, enable or disable, and modify scheduled task properties from this screen. The following columns are available on this screen.
| Column | Description |
|---|---|
| Name | A unique name for the scheduled task. |
| Schedule | The frequency set for executing the task. |
| Task Template | The task template for creating the schedule. |
| Priority IPs | A list of IP addresses of the machines on which the task must be run. |
| Params | The parameters for the task that must be executed. |
| Enabled | Use this toggle switch to enable or disable the task from running as per the schedule. |
| Action | The actions that can be performed on the scheduled task. |
The available action options are:
- Click the Edit icon (
 ) to update the task.
 - Click the Delete icon (
 ) to delete the task.
Creating a Scheduled Task
Use the repository scheduler to create scheduled tasks. You can set a scheduled task to run after a fixed interval, every day at a particular time, a fixed day every week, or a fixed day of the month.
Complete the following steps to create a scheduled task.
From the Analytics screen, navigate to Scheduler > Tasks.
Click Add New Task.
The New Task screen appears.
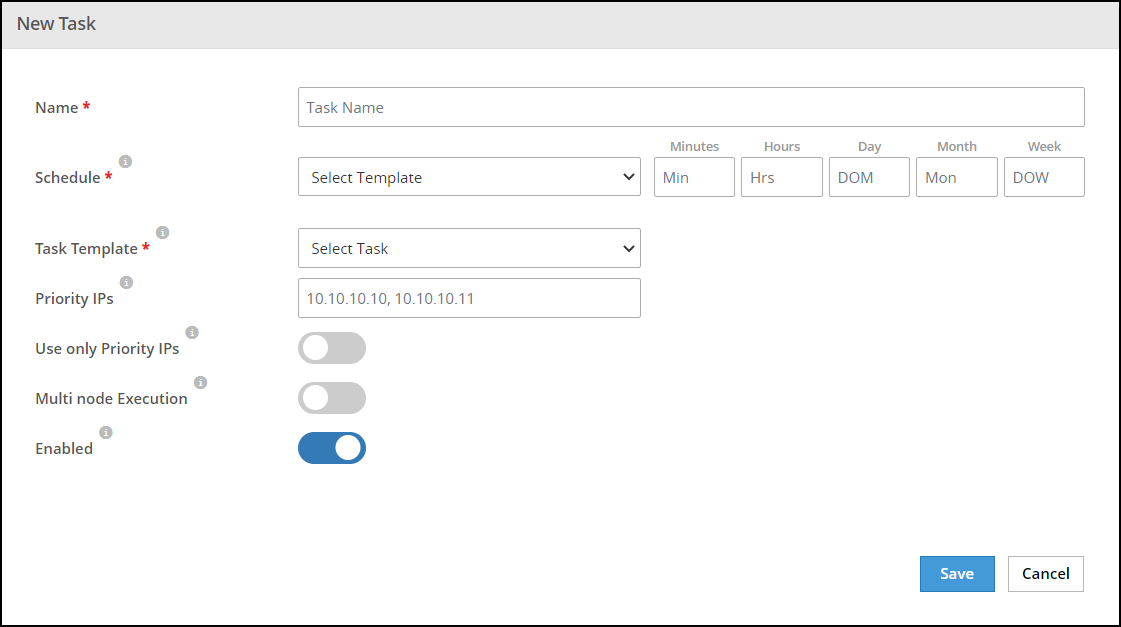
Complete the fields for creating a scheduled task.
The following fields are available:
- Name: Specify a unique name for the task.
- Schedule: Specify the template and time for running the command using cron. The date and time when the command will be run appears in the area below the Schedule field. The following settings are available:
Select Template: Select a template from the list. The following templates are available:
- Custom: Specify a custom schedule for executing the task.
- Every Minute: Set the task to execute every minute.
- Every 5 Minutes: Set the task to execute after every 5 minutes.
- Every 10 Minutes: Set the task to execute after every 10 minutes.
- Every Hour: Set the task to execute every hour.
- Every 2 Hours: Set the task to execute every 2 hours.
- Every 5 Hours: Set the task to execute every 5 hours.
- Every Day: Set the task to execute every day at 12 am.
- Every Alternate Day: Set the task to execute every alternate day at 12 am.
- Every Week: Set the task to execute once every week on Sunday at 12 am.
- Every Month: Set the task to execute at 12 am on the first day of every month.
- Every Alternate Month: Set the task to execute at 12 am on the first day of every alternate month.
- Every Year: Set the task to execute at 12 am on the first of January every year.
If a template is selcted and the date and time settings are modified, then the Custom template is used.
        The scheduler runs only one instance of a particular task. If the task is already running, then the scheduler skips running the task again. For example, if a task is set to run every 1 minute, and the earlier instance is not complete, then the scheduler skips running the task. The scheduled task will be run again at the scheduled time after the current task is complete.

    -   Date and time: Specify the date and the time when the command must be executed. The following fields are available:

        -   **Min**: Specify the time settings in minutes for executing the command.
        -   **Hrs**: Specify the time settings in hours for executing the command.
        -   **DOM**: Specify the day of the month for executing the command.
        -   **Mon**: Specify the month for executing the command.
        -   **DOW**: Specify the day of the week for executing the command.
        Some of the fields also accept the special syntax. For the special syntax, refer [here](#special-syntax).

-   **Task Template**: Select a task template to view and specify the parameters for the scheduled task. The following task templates are available:
    -   **ILM Multi Delete**
    -   **ILM Multi Export**
    -   **Audit index Rollover**
    -   **Signature Verification**
-   **Priority IPs**: Specify a list of the ESA IP addresses in the order of priority for execution. The task is executed on the first IP address that is specified in this list. If the IP is not available to execute the task, then the job is executed on the next prioritized IP address in the list.
-   **Use Only Priority IPs**: Enable this toggle switch to only execute the task on any one node from the list of the ESA IP addresses specified in the priority field. If this toggle switch is disabled, then the task execution is first attempted on the list of IPs specified in the **Priority IPs** field. If a machine is not available, then the task is run on any machine that is available on the Audit Store cluster which might not be mentioned in the **Priority IPs** field.
-   **Multi node Execution**: If disabled, then the task is run on a single machine. Enable this toggle switch to run the task on all available machines.
-   **Enabled**: Use this toggle switch to enable or disable the task from running as per the schedule.
- Specify the parameters for the scheduled task and click Save. The parameters are based on the OR condition. The task is run when any one of the conditions specified is satisfied.
The scheduled task is created and enabled. The job executes on the date and time set.
ILM Multi Delete:
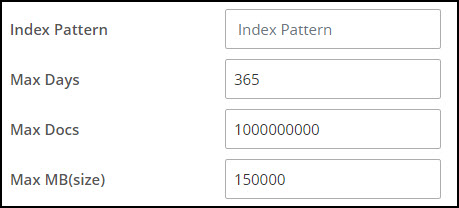
This task is used for automatically deleting indexes when the criteria specified is fulfilled. It displays the required fields for specifying the criteria parameters for deleting indexes. You can use a regex expression for the index pattern.
- Index Pattern: A regex pattern for specifying the indexes that must be monitored.
- Max Days: The maximum number of days to retain the index after which they must be deleted. The default is 365 (365 days).
- Max Docs: The maximum document limit for the index. If the number of docs exceeds this number, then the index is deleted. The default is 1000000000 (1 Billion).
- Max MB(size): The maximum size of the index in MB. If the size of the index exceeds this number, then the index is deleted. The default is 150000 (150 GB).
Specify one or multiple options for the parameters.
The fields for ILM entries is shown in the following figure.
ILM Multi Export:
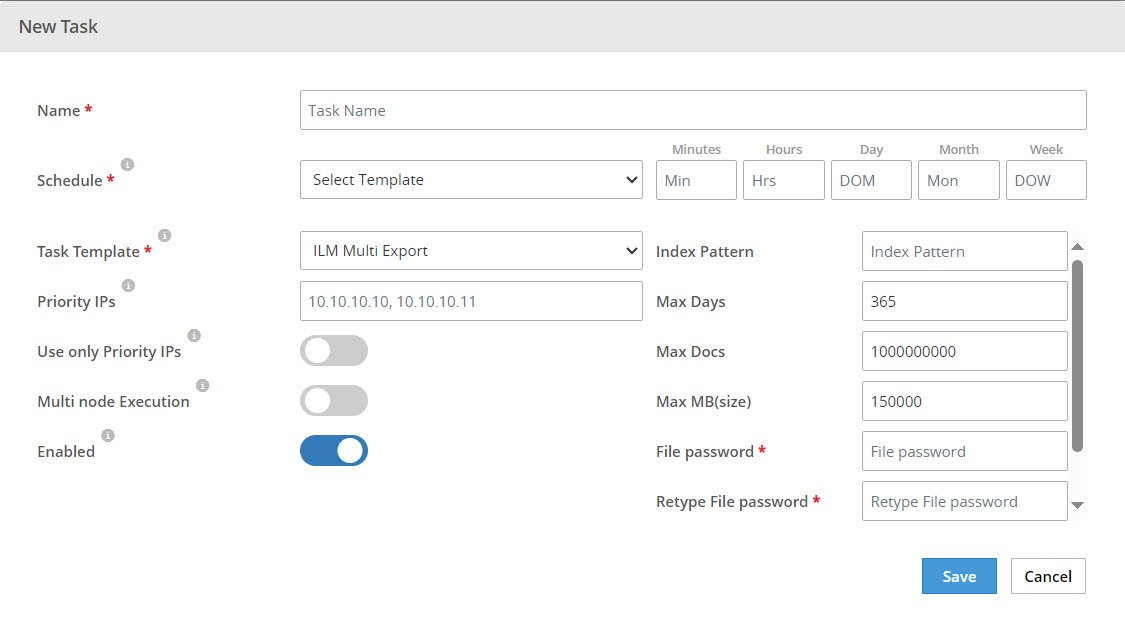
This task is used for automatically exporting logs when the criteria specified is fulfilled. It displays the required fields for specifying the criteria parameters for exporting indexes. This task is disabled by default after it is created. Enable the Use Only Priority IPs and specify specific ESA machines in the Priority IPs field this task is created to improve performance. Any indexes imported into ILM are not exported using this scheduled task. The Audit index export task is enhanced to support multiple indexes and is renamed to ILM Multi Export.
This task is available for processing the audit, troubleshooting, policy log, and protector status indexes.
- Index Pattern: The pattern for the indexes that must be exported. Use regex to specify multiple indexes.
- Max Days: The number of days to store indexes. Any index beyond this age is exported. The default age specified is 365 days.
- Max Docs: The maximum docs present over all the indexes. If the number of docs exceeds this number, then the indexes are exported. The default is 1000000000 (1 Billion).
- Max MB(size): The maximum size of the index in MB. If the size of the index exceeds this number, then the index is exported. The default is 150000 (150 GB).
- File password: The password for the exported file. The password is hidden. Keep the password safe. A lost password cannot be retrieved.
- Retype File password: The password confirmation for the exported file.
- Dir Path: The directory for storing the exported index in the default path. The default path specified is /opt/protegrity/insight/archive/. You can specify and create nested folders using this parameter. Also, if the directory specified does not exist, then the directory is created in the /opt/protegrity/insight/archive/ directory.
You can specify one or multiple options for the Max Days, Max Docs, and Max MB(size) parameters.
The fields for the entries is shown in the following figure.
Audit Index Rollover:
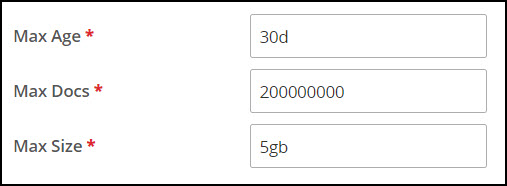
This task performs an index rollover on the index referred by the alias when any of the specified conditions are fulfilled. The conditions are index age, number of documents in the index, or the index size crosses the specified value.
This task is available for processing the audit, troubleshooting, policy log, protector status, and DSG-related indexes.
- Max Age: The maximum age after which the index must be rolled over. This default is 30d, that is 30 days. The values supported are, y for years, M for months, w for weeks, d for days, h or H for hours, m for minutes, and s for seconds.
- Max Docs: The maximum number of docs that an index can contain. An index rollover is performed when this limit is reached. The default is 200000000, that is 200 million.
- Max Size: The maximum index size of the index that is allowed. An index rollover is performed when the size limit is reached. The default is 5gb. The units supported are, b for bytes, kb for kilobytes, mb for megabytes, gb for gigabytes, tb for terabytes, and pb for petabytes.
The fields for the Audit Index Rollover entries is shown in the following figure.
Signature Verification:
This task runs the signature verification tasks after the time interval that is set. It runs the default signature-related job and the ad-hoc jobs created on the Signature Verification tab.
- Max Job Idle Time Minutes: The maximum time to keep the jobs idle. After the jobs are idle for the time specified, the idle jobs are cleared and re-queued. The default specified is 2 minutes.
- Max Parallel Jobs Per Node: The maximum number of signature verification jobs to run in parallel on each system. If number of jobs specified here is reached, then new scheduled jobs are not started. This default is 4 jobs. For example, if 10 jobs are queued to run on 2 ESAs, then 4 jobs are started on the first ESA, 4 jobs are started on the second ESA, and 2 jobs will be queued to run till an ESA job slot gets free to accept and run the queued job.
The fields for the Manage Signature Verification Jobs entries is shown in the following figure.

Working with scheduled tasks
After creating a scheduled task, specify whether the task must be enabled or disabled for running. You can edit the task to modify the commands or the task schedule.
Complete the following steps to modify a task.
From the Analytics screen, navigate to Scheduler > Tasks.
The list of scheduled tasks appears.

Use the search field to search for a specific task from the list.
Click the Enabled toggle switch to enable or disable the task for running as per the schedule.
Alternatively, clear the Enabled toggle switch to prevent the task from running as per the schedule.
Click the Edit icon (
 ) to update the task.
The Edit Task page is displayed.
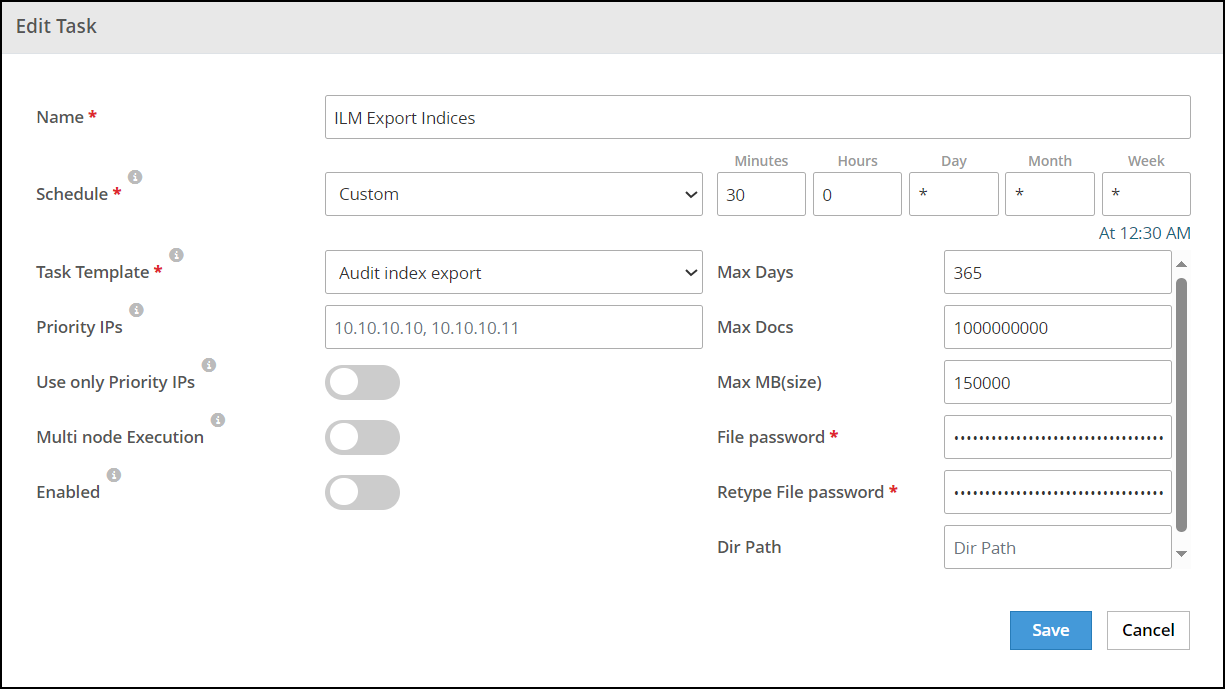
Update the task as required and click Save.
The task is saved and run as per the defined schedule.
Viewing the scheduler monitor
The Monitor screen shows a list of all the scheduled tasks. It also displays whether the task is running or was executed successfully. You can also stop a running task or restart a stopped task from this screen.
Complete the following steps to monitor the tasks.
From the Analytics screen, navigate to Scheduler > Monitor.
The list of scheduled tasks appears.
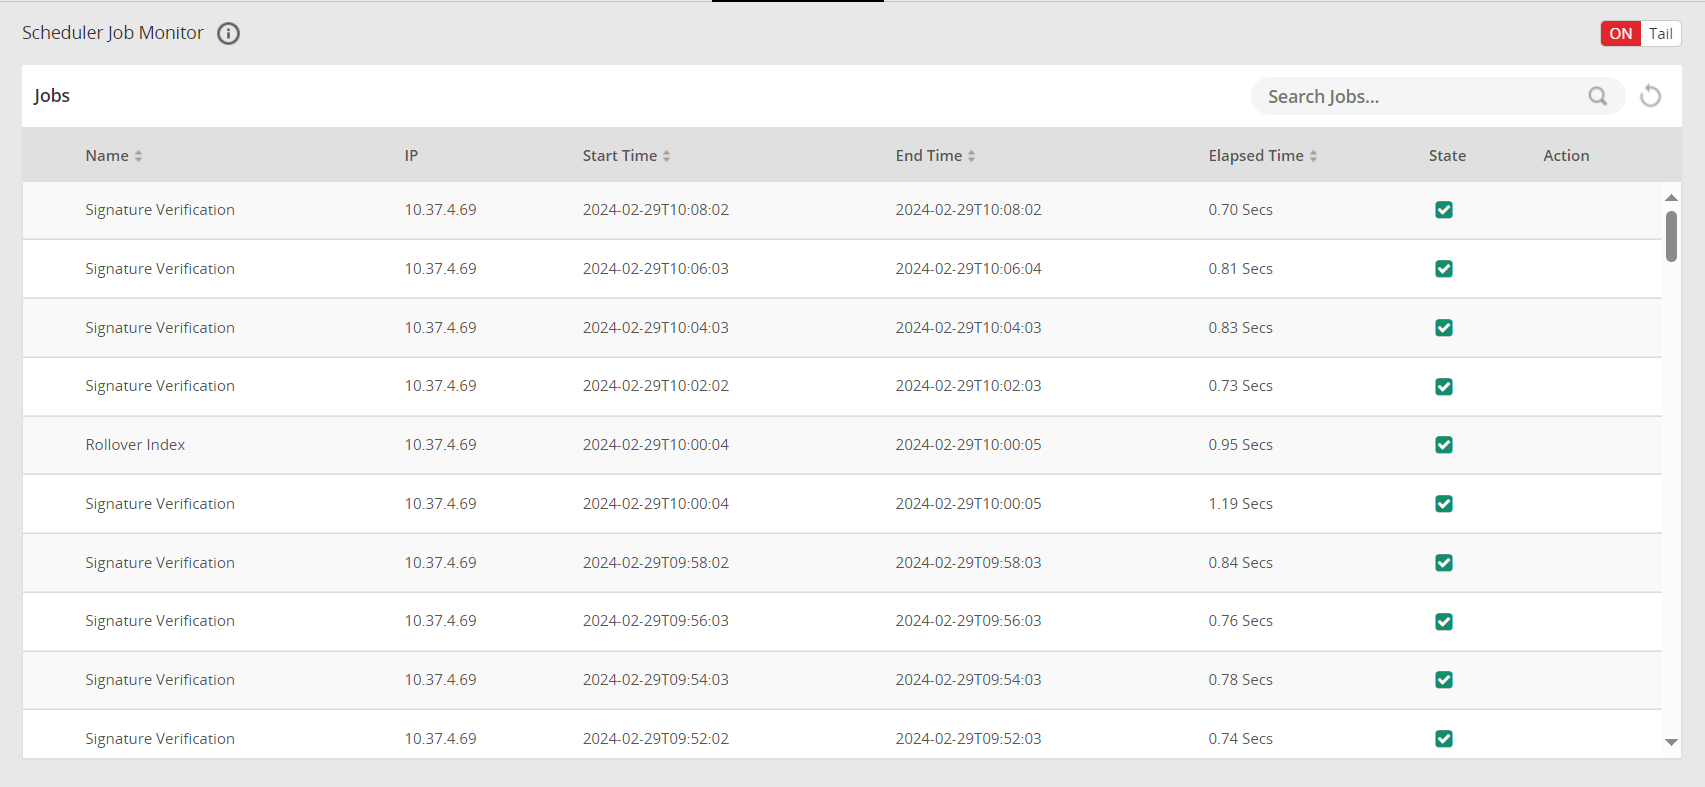
The Tail option can be set from the upper-right corner of the screen. Setting the Tail option to ON updates the scheduler history list with the latest scheduled tasks that are run.
You can use the search field to search for specific tasks from the list.
Scroll to view the list of scheduled tasks executed. The following information appears:
- Name: This is the name of the task that was executed.
- IP: This is the host IP of the system that executed the task.
- Start Time: This is the time when the scheduled task started executing.
- End Time: This is the end time when the scheduled task finished executing.
- Elapsed Time: This is the execution time in seconds for the scheduled task.
- State: This is the state displayed for the task. The available states are:
 : Running. The task is running. You can click Stop from Actions to stop the task.
 : Queued to stop. The task processing will stop soon.
 : Stopped. The task has been stopped. The job might take about 20 seconds to stop the process.
If an ILM Multi Export job is stopped, then the next ILM Multi Export job cannot be started within 2 minutes of stopping a previous running job.
If a signature verification scheduler job is stopped from the Scheduler > Monitor page, then the status might be updated on this page after about 5 minutes.
 : Completed. The task is complete.
- Action: Click Stop to abort the running task. This button is only displayed for tasks that are running.
Using the Index State Management
Use the scheduler and the Analytics ILM for managing indexes. The Index State Management can be used to manage indexes not supported by the scheduler or ILM. However, it is not recommended to use the Index State Management for managing indexes. The Index State Management provides configurations and settings for rotating the index.
Perform the following steps to configure the index:
- Log in to the ESA Web UI.
- Navigate to Audit Store > Dashboard. The Audit Store Dashboards appears. If a new tab does not automatically open, click Open in a new tab.
- Update the index definition.
- From the menu, navigate to Index Management.
- Click the required index entry.
- Click Edit.
- Select JSON editor.
- Click Continue.
- Update the required configuration under rollover.
- Click Update.
- Update the policy definition for the index.
- From the menu, navigate to Index Management.
- Click Policy managed indexes.
- Select the check box for the index that was updated.
- CLick Change Policy.
- Select the index from the Managed indices list.
- From the State filter, select Rollover.
- Select the index from the New policy list.
- Ensure that the Keep indices in their current state after the policy takes effect option is selected.
- Click Change.
Special syntax
The special syntax for specifying the schedule is provided in the following table.
| Character | Definition | Fields | Example |
|---|---|---|---|
| , | Specifies a list of values. | All | 1, 2, 5, 6. |
| - | Specifies a range of values. | All | 3-5 specifies 3, 4, 5. |
| / | Specifies the values to skip. | All | */4 specifies 0, 4, 8, and so on. |
| * | Specifies all values. | All | * specifies all the values in the field where it is used. |
| ? | Specifies no specific value. | DOM, DOW | 4 in the day-of-month field and ? in the day-of-week field specifies to run on the 4th day of the month. |
| # | Specifies the nth day of the month. | DOW | 2#4 specifies 2 for Monday and 4 for 4th week in the month. |
| L | Specifies the last day in the week or month. | DOM, DOW | 7L specifies the last Saturday in the month. |
| W | Specifies the weekday closest to the specified day. | DOM | 12W specifies to run on the 12th of the month. If 12 is a Saturday, then run on Friday the 11th. If 12th is a Sunday, then run on Monday the 13th. |