Performance
Performance Considerations
The following factors may cause variation in real performance versus benchmarks:
- Cold startup: The Lambda spends additional time on the initial invocation to decrypt and load the policy into memory. This time can vary depending on the policy size. Once the Lambda is initialized, subsequent “warm executions” should process quickly.
- Size of policy: The size of the policy impacts cold start performance. Larger policies take more time to initialize.
- Lambda memory: AWS provides more virtual cores based on the memory configuration. The initial configuration of 1728 MB provides a good tradeoff between performance and cost with the benchmarked policy. Memory can be increased to optimize for your individual cases.
- Cluster size: Cluster size may make a significant difference depending on the workload.
- Number of security operations (protect or unprotect).
- Lambda concurrency and burst quotas: AWS limits the number of concurrent executions and how quickly lambda can scale to meet demand. This is discussed in an upcoming section of the document.
- Size of data element: Operations on larger text consume time.
Sample Benchmarks
The following benchmarks were performed against different cluster sizes. These are median times of approximately five runs each. The query unprotected six columns per row (first_name, last_name, email, postal_code, ssn, iban):
| Rows x Cols | # Ops | dc2.large (24 nodes) | ra3.4xl (3 nodes) | ra3.4xl (7 nodes) | ra3.16xl (7 nodes) |
|---|---|---|---|---|---|
| 1M x 6 cols | 6M | 1.6 | 1.7 | 1.5 | 1.2 |
| 10M x 6 cols | 60M | 6.0 | 6.3 | 2.8 | 3.3 |
| 100M x 6 cols | 600M | 44.3 | 49.8 | 23.4 | 15.1 |
Lambda Tuning
AWS maintains quotas for Lambda concurrent execution. Two of these quotas impact concurrency and compete with other Lambdas in the same account and region:
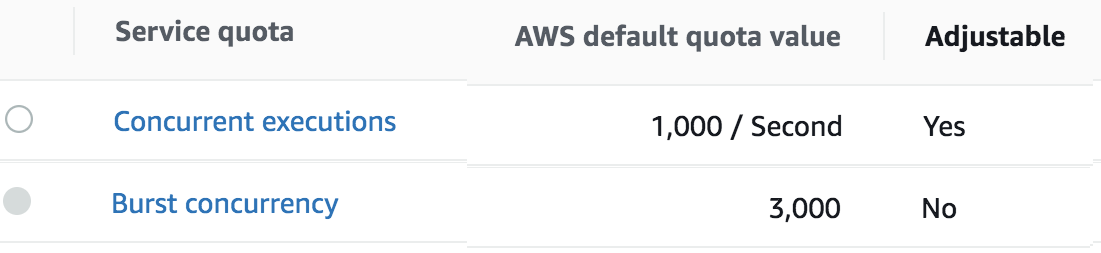
The Concurrent executions quota cap is the maximum number of Lambda instances that can serve requests for an account and region. The default AWS quota may be inadequate based on peak concurrency based on the table in the previous section. This quota can be increased with an AWS support ticket.
The Burst concurrency quota limits the rate at which Lambda will scale to accommodate demand. This quota is also per account and region. The burst quota cannot be adjusted. AWS will quickly scale until the burst limit is reached. After the burst limit is reached, functions will scale at a reduced rate per minute (e.g. 500). If no Lambda instances can serve a request, the request will fail with a 429 Too Many Requests response. Redshift will generally retry until all requests succeed but may abort if a high percentage of failed responses occur.
The burst limit is a fixed value and varies significantly by AWS region. The highest burst (3,000) is currently available in the following regions: US West (Oregon), US East (N.Virginia), and Europe (Ireland). Other regions can burst between 500 and 1,000. It is recommended to select a Redshift AWS region with the highest burst limits.
Concurrency Troubleshooting
Hitting up against quota limits may indicate that quota adjustments are required. Exceeding quota limits may cause a Redshift query to fail or reduce performance. In the worst case, significant throttling can impact the performance of all your Lambda services in the region.
Redshift is tolerant of a certain ratio of failed requests and automatically retries. If a high percentage of requests fail, then the query may abort and the last error code will display in the console. For example, 429 Too Many Requests.
CloudWatch Metrics can be manually enabled on the Lambda to reveal if quotas are being reached. Metrics aggregate errors into two buckets that are 4xx. CloudWatch logs can be used to access the actual error code.
Log Forwarder Performance
Log forwarder architecture is optimized to minimize the amount of connections and reduce the overall network bandwidth required to send audit logs to ESA. This is achieved with batching and aggregation taking place on two levels. The first level is in protect function instances, where audit logs from consecutive requests to an instance are batched and aggregated. The second level of batching takes place in Amazon Kinesis Stream where log records from different protect function instances are additionally batched and sent to log forwarder function where they are aggregated. This section shows how to configure the deployment to accommodate different patterns of anticipated audit log stream. It also shows how to monitor deployment resources to detect problems before audit records are lost.
Protector Cloud Formation Parameters
AuditLogFlushInterval: Determines the minimum amount of time required for the audit log to be sent to Amazon Kinesis. Changing flush interval may affect the level of aggregation, which in turn may result in different number of connections and different data rates to Amazon Kinesis. Default value is 30 seconds.
Increasing the flush interval may result in higher aggregation of audit logs, in fewer connections to Amazon Kinesis, in higher latency of audit logs arriving to ESA and in higher data throughput.
Lowering the flush interval may result in lower aggregation of audit logs, in more connections to Amazon Kinesis, in lower latency of audit logs arriving to ESA and in lower data throughput.
It is not recommended to reduce the flush interval from default value in production environment as it may overload the Amazon Kinesis service. However, it may be beneficial to reduce flush interval during testing to make audit records appear on ESA faster.
Log Forwarder Cloud Formation Parameters
Amazon KinesisLogStreamShardCount: The number of shards represents the level of parallel streams in the Amazon Kinesis and it is proportional to the throughput capacity of the stream. If the number of shards is too low and the volume of audit logs is too high, Amazon Kinesis service may be overloaded and some audit records sent from protect function may be lost.
Default value is 10, however you are advised to test with a production-like load to determine whether this is sufficient or not.
Amazon KinesisLogStreamRetentionPeriodHours: The time for the audit records to be retained in Amazon Kinesis log stream in cases where log forwarder function is unable to read records from the Kinesis stream or send records to ESA, for example due to a connectivity outage. Amazon Kinesis will retain failed audit records and retry periodically until connectivity with ESA is restored or retention period expires.
Default value is 24 hours, however you are advised to review this value to align it with your Recovery Time Objective and Recovery Point Objective SLAs.
Monitoring Log Forwarder Resources
Amazon Kinesis Stream Metrics: Any positive value in Amazon Kinesis PutRecords throttled records metric indicates that audit logs rate from protect function is too high. The recommended action is to increase the Amazon KinesisLogStreamShardCount or optionally increase the AuditLogFlushInterval.
Log Forwarder Function CloudWatch Logs: If log forwarder function is unable to send logs to ESA, it will log the following message:
[SEVERE] Dropped records: x.Note
When the error message above occurs, the dropped audit records will be preserved in the Amazon Kinesis data stream and retried again according to Amazon Kinesis retry schedule. Records will be retried until Amazon KinesisLogStreamRetentionPeriodHours expires.Protect Function CloudWatch Logs: If protect function is unable to send logs to Amazon Kinesis, it will log the following message:
[SEVERE] Amazon Kinesis error, retrying in x ms (retry: y/z) ..."Any dropped audit log records will be reported with the following log message:
[SEVERE] Failed to send x/y audit logs to Amazon Kinesis.
Feedback
Was this page helpful?