Concurrency Tuning
Lambda Tuning
AWS maintains quotas for Lambda concurrent execution. Two of these quotas impact concurrency and compete with other Lambdas in the same account and region:

The concurrent executions quota cap is the maximum number of Lambda instances that can serve requests for an account and region. The default AWS quota may be inadequate based on peak concurrency based on the table in the previous section. This quota can be increased with an AWS support ticket.
The Burst concurrency quota limits the rate at which Lambda will scale to accommodate demand. This quota is also per account and region. The burst quota cannot be adjusted. AWS will quickly scale until the burst limit is reached. After the burst limit is reached, functions will scale at a reduced rate per minute (e.g. 500). If no Lambda instances can serve a request, the request will fail with a 429 Too Many Requests response. Snowflake will generally retry until all requests succeed but may abort if a high percentage of failed responses occur.
The burst limit is a fixed value and varies significantly by AWS region. The highest burst (3,000) is currently available in the following regions: US West (Oregon), US East (N.Virginia), and Europe (Ireland). Other regions can burst between 500 and 1,000. It is recommended to select a Snowflake AWS region with the highest burst limits.
API Gateway Tuning
AWS maintains a Throttle quota for the API Gateway. By default, API Gateway limits concurrent requests to 10,000 requests per second and throttles subsequent traffic with a 429 Too Many Requests error response. This quota applies across all APIs in an account and region.
The API Gateway default quota may need to be increased based on the Concurrency table in Lambda Tuning. Keep in mind that hitting quota limits effectively throttles any other API services in the region.
The API Gateway also limits burst. Burst is the maximum number of concurrent requests that API Gateway can fulfill at any instant without returning 429 Too Many Requests error responses. This limit can be increased by AWS, but is not normally an adjustable.
Enable CloudWatch metrics within the API Gateway to monitor max concurrency and investigate throttling errors. See the Concurrency Troubleshooting section on interpreting CloudWatch metrics.
Quotas adjustments are applied for region and account. Throttling is also enabled by default in the API Gateway stage used by the Protegrity Lambda function. The stage configuration throttling must be adjusted if the quota is modified. Stage throttling is shown in the following image.
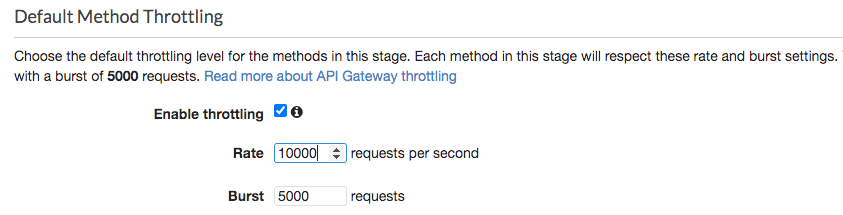
For example, a test query was executed against a 274 million record table on a 2X-Large Snowflake cluster using a query with 10 UDF columns. Using the reference table in the Concurrency table, the cluster would theoretically generate over 20,000 requests/sec to execute the given query. Using API Gateway’s default settings, the requests exceeding 10,000 requests/sec will be throttled. Therefore, this query may fail intermittently due to a high number of throttling errors.
After requesting a quota increase, AWS modified the account’s API Gateway throttling quota from 10,000 to 24,000, this same query succeeded without throttles. In addition, 8 concurrent queries also succeeded. Eight concurrent queries did not generate 8x the concurrent load due to the cluster’s own resource limitations. This indicates the cluster peaked.
Concurrency Troubleshooting
Hitting up against quota limits may indicate that quota adjustments are required. Exceeding quota limits may cause a Snowflake query to fail or reduce performance. In the worst case, significant throttling can impact the performance of all your API Gateway or Lambda services in the region.
Snowflake is tolerant of a certain ratio of failed requests and automatically retries. If a high percentage of requests fail, then the query may abort and the last error code will display in the console. For example, 429 Too Many Requests.
CloudWatch Metrics can be manually enabled on the API Gateway to reveal if quotas are being reached. Metrics aggregate errors into two buckets that are 4xx and 5xx. CloudWatch logs can be used to access the actual error code. The following table describes how to interpret the CloudWatch metrics.
| Error type | Possible issue | Remedy |
|---|---|---|
| 4xx errors | API Gateway burst or throttle quota exceeded | Request an increase to the API Gateway throttle quota. |
| 5xx errors | Lambda concurrent requests or burst quota exceeded. Verify 4xx errors in Lambda Metrics. | Request an increase the Lambda concurrent request quota |
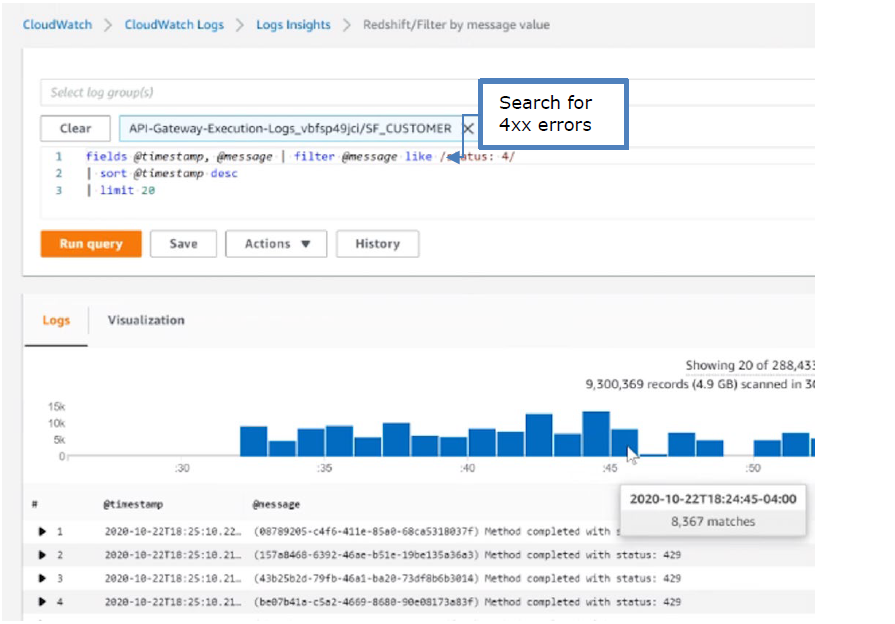
Note
The API Gateway Lambda proxy maps 429 errors from the Lambda service to 500 errors.The following screenshot shows an example of searching CloudWatch Logs using Log Insights:
Cold-Start Performance
Cold-start vs warm execution refers to the state of the Lambda when a request is received. A cold-start undergoes additional initialization, such as, loading the security policy. Warm execution applies to all subsequent requests served by the Lambda. The following table shows an example how these states impact latency and performance.
| Execution state | Avg. Execution Duration | Avg. Total (w/ network latency) |
|---|---|---|
| Cold execution | 438 ms | 522 ms |
| Warm execution | < 2ms | 84 ms |
Note
- Cold execution time will vary based on the physical size of the security policy. A large security policy will result in longer cold startup times.
Feedback
Was this page helpful?