Protegrity Data Security Gateway (DSG) provides logging metrics to help administrators monitor system behaviour, analyse performance, and troubleshoot operational issues. These metrics capture key aspects of gateway activity, including request processing, error conditions, and resource usage, and are grouped into transaction, error, and usage metrics.
This is the multi-page printable view of this section. Click here to print.
Working with Logging Metrics
Understanding the logging metrics in DSG.
1 - Transaction Metrics Logging
Describes transaction metrics logging in DSG.
The transaction metrics allows the user to view the detailed information of the operations performed by the DSG. The Transaction metrics logging feature can be enabled at the service level.
For more information about enabling the transaction metrics logging feature, refer to the Table: Service Fields.
The transaction metrics are logged in the gateway.log file in JSON format.
The sample transaction metrics for a REST request is as seen in the following snippet.
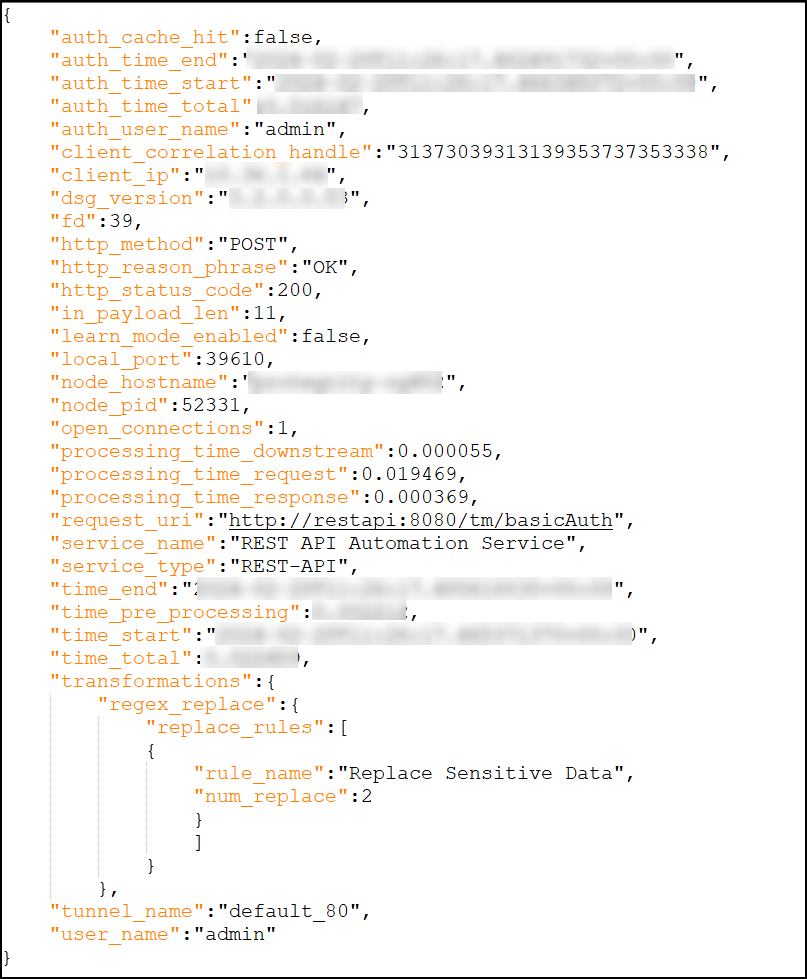
The following table describes the parameters available in the transaction metrics for different services.
| Parameter | Service Supported | Data Type in DSG | Data Type in the Audit Store | Description | Examples |
|---|---|---|---|---|---|
| auth_cache_hit | HTTP, REST | boolean | boolean | The credential cache status. True indicates that the basic authentication credentials were cached and False indicates that the credentials were not cached. | False |
| auth_end_time | HTTP, REST | string | string | The timestamp when the basic authentication was completed. | 2024-02-28T11:26:17.482491732+00:00 |
| auth_start_time | HTTP, REST | string | string | The timestamp when the basic authentication was started. | 2024-02-28T11:26:17.466345072+00:00 |
| auth_total_time | HTTP, REST | float | double | The difference in seconds between the auth_time_end and auth_time_start parameters. | 0.016147 |
| auth_user_name | HTTP, REST | string | string | The username used for basic authentication. | admin |
| bucket_name | S3 Out-of-Band | string | string | The name of the S3 bucket from where the DSG reads the object to be processed. | dsg-s3/incoming |
| client_correlation_handle | All | string | string | The ID used to uniquely identify a request. It is usually a UUID. This parameter is optional. | 31373039313139363333353837 |
| client_ip | All | string | string | The IP address of the client that sent the request to the DSG. | 192.168.1.10 |
| data_element_name | All | string | string | The name of the data element used to transform the sensitive data. | PTY_Unicode |
| data_protection | All | object | object | The object representing the Protegrity Data Protection transformation rule. | {"data_protection":{"data_elements":[{"data_element_name":"TE_A_N_S13_L1R3_N","num_unprotect":20,"len_unprotect":428}]}} |
| dsg_version | All | string | string | The version number of the gateway process. | 3.1.0.0.103 |
| file_name | S3 Out-of-Band, Mounted Out-ofBand | string | string | The name of the file that has been processed. | Sample_S3.csv |
| http_method | HTTP, REST | string | string | The HTTP method associated with request. | POST |
| http_outbound_available_clients | HTTP | integer | long | The number of outbound HTTP clients available for the requests. | 100 |
| http_outbound_count_new_connections | HTTP | integer | long | The number of new connections created to process the request.
| 1 |
| http_outbound_count_redirect | HTTP | integer | long | The number of redirects encountered while processing a request. | 0 |
| http_outbound_local_port | HTTP | integer | integer | The local port used for the outbound connection. | 60084 |
| http_outbound_response_code | HTTP | integer | integer | The HTTP status response code from downstream system. | 200 |
| http_outbound_size_download | HTTP | float | double | The size of the data received from the downstream system in bytes. | 76.00 |
| http_outbound_size_queue | HTTP | float | double | The number of requests waiting to be sent to downstream systems. | 0 |
| http_outbound_size_upload | HTTP | float | double | The size of data sent to downstream system in bytes. | 76.00 |
| http_outbound_speed_download | HTTP | float | double | Average download speed. Bytes per second. | 4.00 |
| http_outbound_speed_upload | HTTP | float | double | Average upload speed. Bytes per second. | 75697.00 |
| http_outbound_time_appconnect | HTTP | float | double | The time taken to complete the SSH/TLS handshake. | 0.000000000 |
| http_outbound_time_connect | HTTP | float | double | The time taken to connect to the remote host. | 0.000374000 |
| http_outbound_time_namelookup | HTTP | float | double | The time taken to resolve the name. | 0.000161000 |
| http_outbound_time_pretransfer | HTTP | float | double | The time from the start until before the first byte is sent. | 0.000397000 |
| http_outbound_time_queue | HTTP | float | double | The time that the requests spent in the queue before being processed. | 0.000008821 |
| http_outbound_time_request | HTTP | float | double | The time from when the request was popped off the queue to be processed to the time a response was sent back to the caller. | 0.001168013 |
| http_outbound_time_starttransfer | HTTP | float | double | The time taken from the start of the request until the first byte was received from the server. | 0.000398000 |
| http_outbound_time_total | HTTP | float | double | Total time that the client library took to process the HTTP request. | 0.001004000 |
| http_outbound_url | HTTP | string | string | The destination URL used for the outbound request. | http://tornadoserver:8889/passthrough |
| http_reason_phrase | HTTP, REST | string | string | The reason phrase associated with the HTTP status code. | OK |
| http_status_code | HTTP, REST | integer | integer | The HTTP status code sent to the HTTP client. | 200 |
| input_etag | S3 Out-of-Band | string | string | The Etag of the input object processed by the DSG. | a0b00e60cc87fff8537e68827c3f329a |
| input_size | S3 Out-of-Band | integer | long | The size of the input object, in bytes, processed by the DSG. | 81 |
| learn_mode_enabled | All | boolean | boolean | Indicates if the Learn mode is enabled. | false |
| len_protect | All | integer | long | The length of the sensitive data that is protected. | 30 |
| local_port | HTTP, REST | integer | integer | The local port used for the inbound connection, can be used with the open_connections parameter to identify new and unique connections. | 43004 |
| logtype* | All | NA | string | The value to identify type of metric, such as, dsg_metrics_transaction. | dsg_metrics_transaction |
| method | SFTP | string | string | The SFTP method associated with the request. The method can be either GET or PUT. | download |
| node_hostname | All | string | string | The hostname of the DSG. | protegrity-cg123 |
| node_pid | All | integer | integer | The process id of the gateway process that processed the request. | 56532 |
| num_protect | All | integer | long | The number of protect operations performed. | 3 |
| num_replace | All | integer | long | The number of regex replace performed. | 2 |
| open_connections | HTTP, REST | integer | long | The number of open connections associated with the tunnel in a process. | 1 |
| origin_time_utc* | All | NA | date | The time in UTC at which this log is ingested. | Feb 26, 2024 @ 03:51:54.416 |
| output_bucket_name | S3 Out-of-Band | string | string | The name of S3 bucket where the DSG writes the processed object. | dsg-s3/incoming |
| output_etag | S3 Out-of-Band | string | string | Etag of the output object processed by the DSG. | a0b00e60cc87fff8537e68827c3f329a |
| output_file_name | S3 Out-of-Band | string | string | The name of the object that is written to the new S3 bucket (i.e. The value of output_bucket_name parameter) by the DSG. | Sample_s3.csv |
| output_size | S3 Out-of-Band | integer | long | The size of the object, in bytes, written to the output S3 bucket. | 81 |
| processing_time_downstream | HTTP, SMTP, SFTP | float | double | The time is the difference between the start time of processing a response and the end time of processing a request. | 0.003696442 |
| processing_time_request | All | float | double | The time taken for the ruleset to process the request data. | 0.001080275 |
| processing_time_response | HTTP, SMTP, SFTP, S3 Out-of-Band | float | double | The time taken for the ruleset to process the response data. It is only applicable to the protocols where a response is expected from a downstream system. | 0.000162601 |
| regex_replace | All | object | object | The object representing the Regex Replace transformation rule. | {"regex_replace":{"replace_rules":[{"rule_name":"Hello -> HELLO","num_replace":6},{"rule_name":"World -> dlroW","num_replace":6}]}} |
| request_uri | HTTP, REST | string | string | The URI of the request being processed by the DSG. | http://httpservice/passthrough |
| rule_name | All | string | string | The name of the rule used to transform the sensitive data. | Sample Rule1 |
| server_ip | SFTP | string | string | The IP address orhostname of the SFTP server that the DSG is communicating with. | sftp.server.com |
| service_name | All | string | string | The name of the service processing the request. | Passthrough |
| service_type | All | string | string | The type of the service processing the request. | HTTP-GW |
| time_pre_processing | HTTP, REST | float | double | The time an HTTP or REST request waited before it was processed. | 0.010870 |
| time_start | All | date | date | The timestamp when the DSG received a request. | 2024-02-28T11:27:13.515926838+00:00 |
| time_end | All | date | date | The timestamp representing when a request was completed. | 2024-02-28T11:27:13.519971132+00:00 |
| time_lock | S3 Out-of-Band | float | double | The time taken to process the file from the time the lock was created. | 1708963670.43 |
| time_total | All | float | double | The difference, in seconds, between the time_end and time_start parameters. | 0.005429983 |
| transformations | All | object | object | The object representing the Regex Replace and Protegrity Data Protection transformation rules. | "transformations":{"data_protection":{"data_elements":[{"data_element_name":"TE_A_N_S13_L1R3_N","num_unprotect":20,"len_unprotect":428}]}} |
| tunnel_name | All | string | string | The name of the tunnel processing the request. | default_80 |
| user_name | All | string | string | The username used for the protection, unprotection, or reprotection. | jack123 |
* -The origin_time_utc and logtype parameters will only be displayed on the Audit Store Dashboards.
By default, the normalize-time-labels flag is configured in the features.json file. If the normalize-time-labels flag is configured, then it converts the default timestamp parameters to normalized timestamp parameters, as shown in the Table: Default and Normalized timestamp parameters.
To access the features.json file, navigate to Settings > System > Files, and under the Cloud Gateway - Settings area, access the features.json file.
The following table shows the default timestamp parameters and the normalized timestamp parameters.
Default and Normalized timestamp parameters
| Default Timestamp Parameters | Normalized Timestamp Parameters |
|---|---|
| auth_end_time | auth_time_end |
| auth_start_time | auth_time_start |
| auth_total_time | auth_time_total |
| end_time | time_end |
| start_time | time_start |
| total_time | time_total |
| pre_processing_time | time_pre_processing |
Forwarding Transaction Metrics to Audit Store
The transaction metrics are also forwarded to the Audit Store and can be viewed on the Audit Store Dashboards.
Ensure that the following prerequisites are met before you view the logs on the Audit Store Dashboards:
The Analytics component is initialized on the ESA. The initialization of Analytics is required for displaying the Audit Store information on the Audit Store Dashboards.
For more information about initializing Analytics, refer Initializing Analytics on the ESA.
For more information about the audit indexes, refer to the section Understanding the audit index fields.
The logs are forwarded to the Audit Store.
For more information about forwarding the logs, refer to the section Forwarding Audit Logs to Insight.
The following figure shows the sample transaction metrics on the Discover screen of the Audit Store Dashboards.
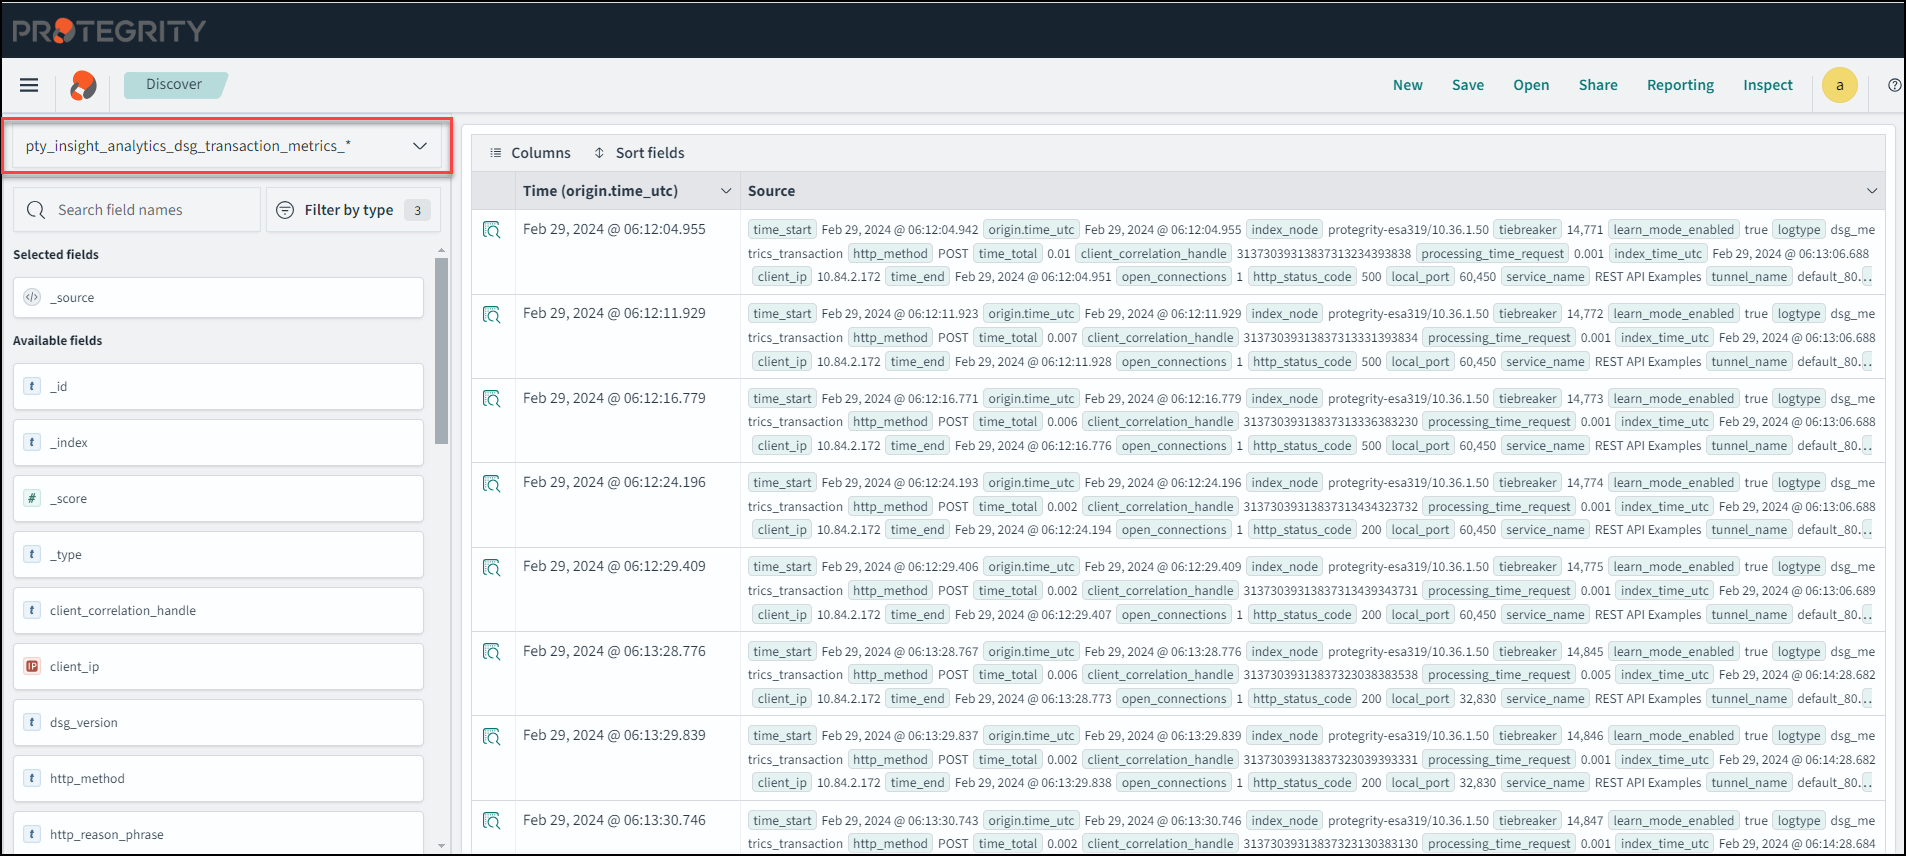
Note: The index_node, tiebreaker, and index_time_utc parameters are only logged on the Audit Store Dashboards.
The DSG transaction logs are stored in the pty_insight_analytics_dsg_transaction_metrics_9.2 index file. It is recommended to enable the scheduled task to free up the space used by old index files that you do not require. For transaction metrics, edit the Delete DSG Transaction Indices task and enable the task. The scheduled task can be set to n days based on your preference.
For more information about scheduled tasks, refer to the section Using the scheduler.
Total Time Breakdown for HTTP Request
This section describes the total time taken for processing the HTTP request.
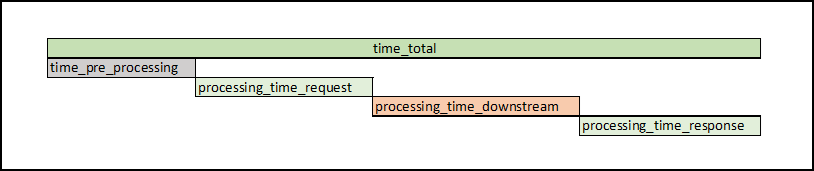
The total_time value is calculated by adding the time taken by the following parameters:
- time_pre_processing: The time an HTTP or REST request waited before it was processed.
- processing_time_request: The time taken for the ruleset to process the request data.
- processing_time_downstream: The time taken to send a request to a downstream system and receive a response from the client.
- processing_time_response: The time taken for the ruleset to process the response data.
The following chart depicts the breakdown of the total time taken for an HTTP request.
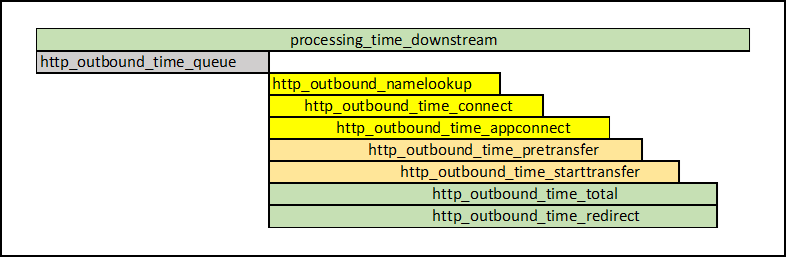
The processing_time_downstream value is the difference between the start time of processing the response and the end time of processing a request. The processing_time_dowstream is calculated by considering the time taken by any the following parameters:
- http_outbound_time_queue: The time that the request spent in the queue before being processed.
- http_outbound_namelookup: The time taken to resolve the name.
- http_outbound_time_connect: The time taken to connect to the remote host.
- http_outbound_time_appconnect: The time taken to complete the SSH/TLS handshake.
- http_outbound_time_pretransfer: The time from the start until before the first byte is sent.
- http_outbound_time_starttransfer: The time taken from the start of the request until the first byte was received from the server.
- http_outbound_time_total: Total time that the client library took to process the HTTP request.
- http_outbound_time_redirect: The time, in seconds, it took for all redirection steps including name lookup, connect, pretransfer, and transfer before the final transaction was started.
The following chart depicts the processing time downstream for an HTTP request.
2 - Usage Metrics Logging
Describes usage metrics logging in DSG.
Usage metrics provide information about the usage of tunnels, services, profiles, and rules. By default, the usage metrics feature is enabled in the gateway.json file.
For more information about the gateway.json file, refer to the section Gateway.json file.
The following snippet shows how the usage metrics feature is enabled in the gateway.json file.
"stats": {
    "enabled": true
}
The metrics are recorded in CSV format in the gateway.log file, and then parsed to JSON and sent to Insight.
For more information about viewing the usage metrics on Insight, refer to the section Forwarding Usage Metrics to Insight.
The logs are emitted at a default interval of 120 seconds. During this 120-second window, all requests processed by the gateway process will be recorded. To modify the time window, configure the usageLogInterval parameter in the stats setting in gateway.json file.
Note:
The time interval is calculated once the gateway restarts.
The usage metrics will only be logged when there is a transaction.
The following table describes the usage metrics for Tunnels.
| Parameter | Data Type in DSG | Data Type in Insight | Description | Example |
|---|---|---|---|---|
| metrics_type | string | string | The metric type is displayed as tunnel. | Tunnel |
| version | integer | integer | A version for the tunnel metric type. | 0 |
| tunnel_type | string | string | The type of tunnel used to process a request is displayed. | HTTP |
| logtype | string | string | The value to identify type of metric such as dsg_metrics_usage_tunnel. | dsg_metrics_usage_tunnel |
| log_time | epoch_millis | date | The time when the usage is reported. | 1707242725766 |
| log_interval | integer | long | The time difference between the current and previous logs. | 30003 |
| tunnel_id | string | string | The unique ID of the tunnel. | t-808715e0-b725-4781-8bf3-429220dd46d5 |
| uptime | float | double | The time in seconds since the tunnel loaded. | 22670.46733236313 |
| bytes_processed | integer | long | The frontend and backend bytes the tunnel processed since the last time usage was reported. | 38 |
| frontend_bytes_processed | integer | long | The frontend bytes the tunnel has processed since the last time usage was reported. | 38 |
| backend_bytes_processed | integer | long | The backend bytes the tunnel has processed since the last time usage was reported. | 0 |
| total_bytes_processed | integer | long | The total number of frontend and backend bytes the tunnel has processed during the time the tunnel has been loaded. | 38 |
| total_frontend_bytes_processed | integer | long | The total number of frontend bytes the tunnel has processed during the time the tunnel has been loaded. | 38 |
| total_backend_bytes-_processed | integer | long | The total number of backend bytes the tunnel has processed during the time the tunnel has been loaded. | 0 |
| message_count | integer | long | The number of requests the tunnel received since the last time usage was reported. | 1 |
| total_message_count | integer | long | The total number of requests the tunnel received during the time the tunnel has been loaded. | 1 |
| origin_time_utc* | NA | date | The time in UTC at which this log is ingested. | Feb 26, 2024 @ 03:51:54.416 |
* -The origin_time_utc parameter will only be displayed on the Insight Dashboards.
The following table describes the usage metrics for Services.
| Parameter | Data Type in DSG | Data Type in Insight | Description | Example |
|---|---|---|---|---|
| metrics_type | string | string | The metric type is displayed as Service. | Service |
| version | integer | integer | A version for the service metric type. | 0 |
| service_type | string | string | The type of service used to process a request is displayed. | REST-API |
| logtype | string | string | The value to identify type of metric such as dsg_metrics_usage_service. | dsg_metrics_usage_service |
| log_time | epoch_millis | date | The time when the usage is reported. | 1707242 725766 |
| log_interval | integer | long | The time difference between the current and previous logs. | 30003 |
| service_id | string | string | The unique ID of the service. | s-62a3a161-6bd7-42fa-a9c6-6357d77824ca |
| parent_id | string | string | The unique ID of the tunnel rule. | t-808715e0-b725-4781-8bf3-429220dd46d5 |
| calls | integer | long | The number of times the service processed frontend and backend requests since the time the usage was last reported. | 38 |
| frontend_calls | integer | long | The number of times the service processed frontend requests since the time the usage was last reported. | 38 |
| backend_calls | integer | long | The number of times the service processed backend requests since the time the usage was last reported. | 0 |
| total_calls | integer | long | The total number of times the service processed frontend and backend requests since the service has been loaded. | 38 |
| total_frontend_calls | integer | long | The total number of times the service processed frontend and backend requests since the service has been loaded. | 38 |
| total_backend_calls | integer | long | The total number of times the service processed frontend and backend requests since the service has been loaded. | 0 |
| bytes_processed | integer | long | The frontend and backend bytes the service processed since the last time usage was reported. | 2 |
| frontend_bytes_processed | integer | long | The frontend bytes the tunnel processed since the last time usage was reported. | 1 |
| backend_bytes_processed | integer | long | The backend bytes the tunnel processed since the last time usage was reported. | 1 |
| total_bytes_processed | integer | long | The total number of frontend and backend bytes the service has processed during the time the service has been loaded. | 2 |
| total_frontend_bytes_processed | integer | long | The total number of frontend bytes the tunnel has processed during the time the tunnel has been loaded. | 1 |
| total_backend_bytes_processed | integer | long | The total number of backend bytes the tunnel has processed during the time the tunnel has been loaded. | 1 |
| origin_time_utc* | NA | date | The time in UTC at which this log is ingested. | Feb 26, 2024 @ 03:51:54.416 |
* -The origin_time_utc parameter will only be displayed on the Insight Dashboards.
The following table describes the usage metrics for Profile.
| Parameter | Data Type in DSG | Data Type in Insight | Description | Example |
|---|---|---|---|---|
| metrics_type | string | string | The metric type is displayed as Profile. | Profile |
| version | integer | integer | A version for the profile metric type. | 0 |
| log_time | epoch_millis | date | The time when the usage is reported. | 1707242725766 |
| log_interval | integer | long | The time difference between the current and previous logs. | 339439 |
| logtype | string | string | The value to identify type of metric such as dsg_metrics_usage_profile. | dsg_metrics_usage_profile |
| parent_id | string | string | The unique ID of the service rule. | s-62a3a161-6bd7-42fa-a9c6-6357d77824ca |
| profile_id | string | string | The unique ID of the profile. | p-b335795f-8e77-4b15-9ba0-06002cc29bb9 |
| calls | integer | long | The number of times the profile processed a request since the time usage was last reported. | 1 |
| total_calls | integer | long | The total number of times the profile processed a request since profile has been loaded. | 1 |
| profile_reference_count | integer | long | The number of times this profile has been called through a profile reference since the time the usage was last reported. | 0 |
| total_profile_reference_count | integer | long | The total number of times this profile has been called through a profile reference since the profile has been loaded. | 0 |
| bytes_processed | integer | long | The bytes the profile processed since the last time the usage was reported. | 38 |
| total_bytes_processed | integer | long | The total bytes the profile processed since the profile has been loaded. | 38 |
| elapsed_time_sample_count | integer | long | The number of times the profile was sampled since the last time the usage was reported. | 1 |
| elapsed_time_average | integer | long | The average amount of time in nano-seconds it took to process a request based on elapsed-time-sample-count. | 13172454 |
| total_elapsed_time_sample_count | integer | long | The number of times the profile was sampled since the profile has been loaded. | 1 |
| total_elapsed_time_sample_average | integer | long | The average amount of time in nano-seconds it took to process a request based on total-elapsed-time-sample-count. | 13172454 |
| origin_time_utc* | NA | date | The time in UTC at which this log is ingested. | Feb 26, 2024 @ 03:51:54.420 |
* -The origin_time_utc parameter will only be displayed on the Insight Dashboards.
The following table describes the usage metrics for Rules.
| Name | Data Type in DSG | Data Type in Insight | Description | Example |
|---|---|---|---|---|
| metrics version | integer | integer | A version for the rule metric type. | 0 |
| rule-type | string | string | The type of rule used to process a request is displayed. | Extract |
| codec | string | string | It will display the type of payload extracted or the method used for data transformation. | Text |
| logtype | string | string | The value to identify type of metric such as dsg_metrics_usage_rule. | dsg_metrics_usage_rule |
| log_time | epoch_millis | date | The time when the usage is reported. | 1707242725766 |
| log_interval | date | date | The time difference between the current and previous logs. | 22670424 |
| broken | boolean | boolean | It indicates whether the rule is broken or not. | false |
| domain_name_rewrite | boolean | boolean | It indicates whether the rule is domain name rewrite or not. | false |
| rule_id | string | string | The unique ID of the rule. | r-38b72f16-f838-4602-81aa-cd881a76e418 |
| parent_id | string | string | The unique ID of the profile rule. | p-b335795f-8e77-4b15-9ba0-06002cc29bb9 |
| calls | integer | long | The number of times the rule processed a request since the time the usage was last reported. | 1 |
| total_calls | integer | long | The total number of times the rule processed a request since rule has been loaded. | 1 |
| profile_reference_count | integer | long | The number of times this rule has been called via a profile reference since the time the usage was last reported. | 0 |
| total_profile_reference_count | integer | long | The total number of times this rule has been called via a profile reference since the rule has been loaded. | 0 |
| bytes_processed | integer | long | The bytes the rule processed since the last time the usage was reported. | 1 |
| total_bytes_processed | integer | long | The total bytes the rule processed since the rule has been loaded. | 1 |
| elapsed_time_sample_count | integer | long | The number of times the rule was sampled since the last time usage was reported. | 1 |
| elapsed_time_sample_average | integer | long | The average amount of time in nano-seconds it took to process a data based on elapsed-time-sample-count. | 13137378 |
| total_elapsed_time_sample_count | integer | long | The number of times the rule was sampled since the rule has been loaded. | 1 |
| total_elapsed_time_sample_average | integer | long | The average amount of time in nano-seconds it took to process a data based on total-elapsed-time-sample-count. | 13137378 |
| origin_time_utc* | NA | date | The time in UTC at which this log is ingested. | Feb 26, 2024 @ 03:51:54.420 |
* -The origin_time_utc parameter will only be displayed on the Insight Dashboards.
Forwarding Usage Metrics to the Audit Store
The usage metrics is also forwarded to the Audit Store and can be viewed on the Audit Store Dashboards.
Ensure that the following prerequisites are met before you view the logs on the Audit Store Dashboards:
The Analytics component is initialized on the ESA. The initialization of Analytics is required for displaying the Audit Store information on the Audit Store Dashboards.
For more information about initializing Analytics, refer Initializing Analytics on the ESA.
For more information about the audit indexes, refer to the section Understanding the audit index fields.
The logs are forwarded to Insight.
For more information about forwarding the logs, refer to the section Forwarding Audit Logs to Insight.
The following figure shows the sample usage metrics on the Discover screen of the Audit Store Dashboards.
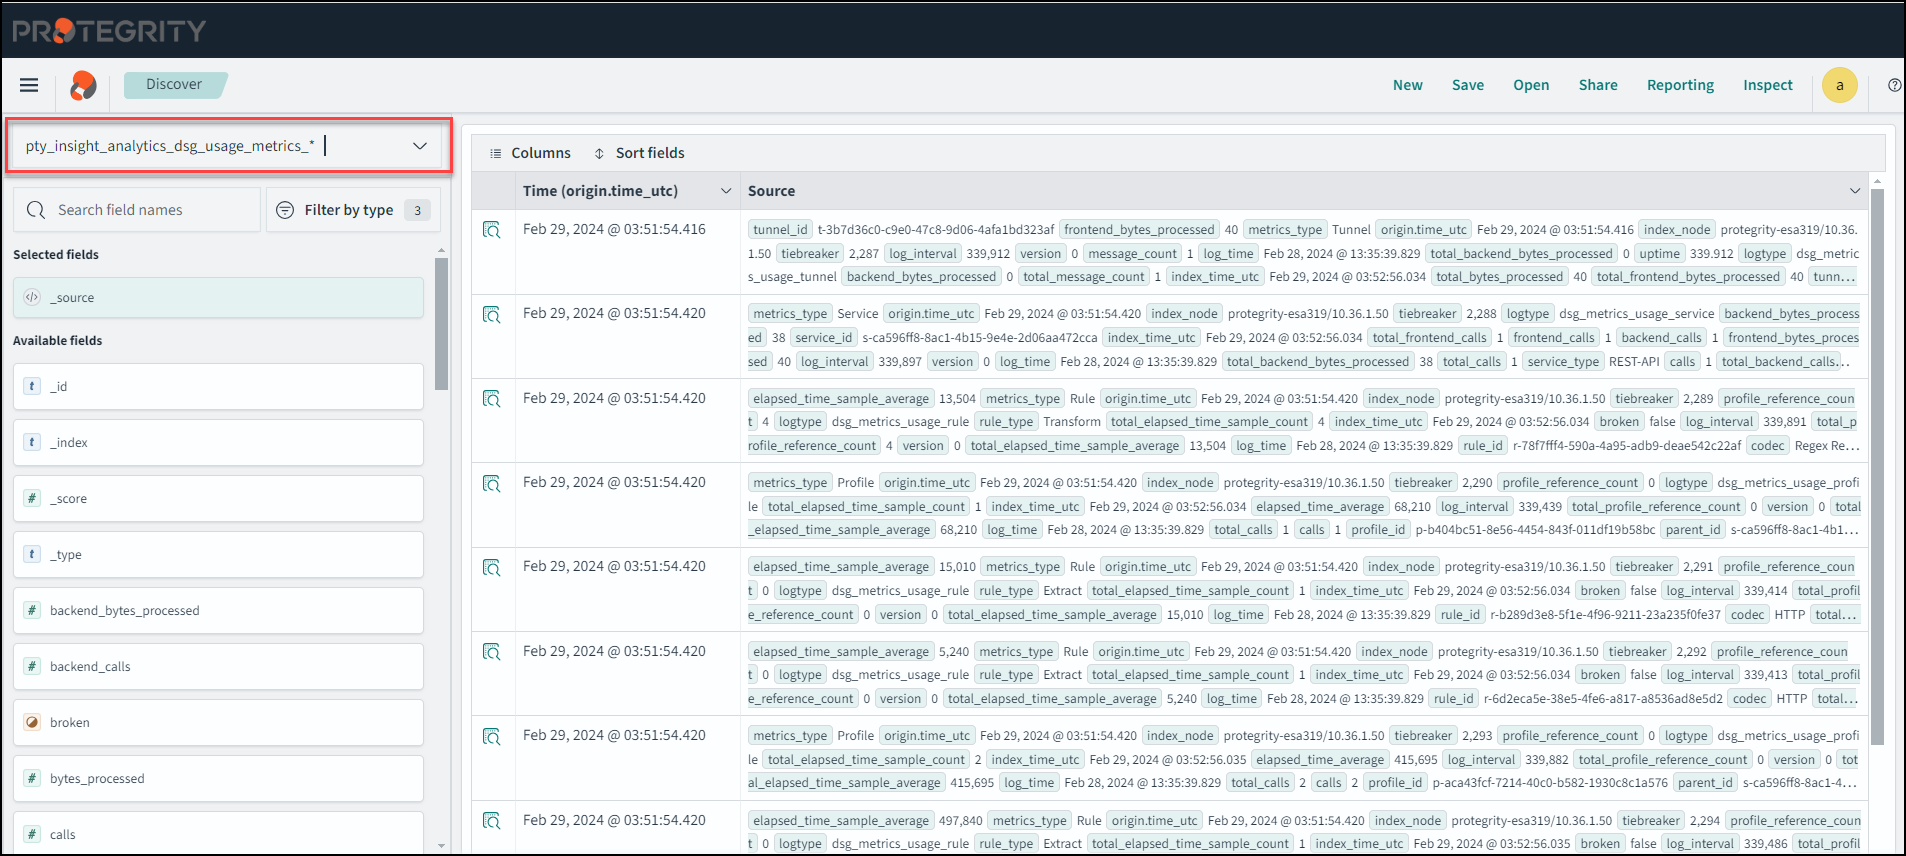
Note: The index_node, tiebreaker, and index_time_utc parameters are only logged on the Audit Store Dashboards.
The DSG usage metrics logs are stored in the pty_insight_analytics_dsg_usage_metrics_9.2 index file. You can configure and enable the scheduled task to free up the space used by old index files that you do not require. For usage metrics, edit the Delete DSG Usage Indices task and enable the task. The scheduled task can be set to n days based on your preference.
For more information about scheduled tasks, refer to the section Using the scheduler.
3 - Error Metrics Logging
Describes error metrics logging in DSG.
Error Metrics allow a user to view details about errors, which are encountered while processing a file. The error metrics logging feature can be enabled at the service level.
When the Protegrity Data Protection Transform Rule is configured, certain error conditions can occur during processing. The following are some of the error conditions:
- The input is too short or long for a particular data element
- Invalid Email ID
- Invalid Data Type
- Invalid Credit Card Details
When these error conditions occur, the rule will stop processing. The permissive error handling feature is hence used to handle the errors and process the erroneous input file.
For more information about permissive error handling, refer to the Table: Protegrity Data Protection Method.
If there are a lot of erroneous data in an input file, it can be difficult to identify and categorize errors. In that situation, the error metrics can be used to understand the total number of errors, the offset of where the error was encountered, the reasons why the error was encountered, the ruleset details, and so on.
Error metrics is written to the gateway.log file and the Log Viewer screen in the JSON format.
In the case of NFS and CIFS protocols, a lock file is created for each file that is to be processed. Error metrics will also be appended to the lock files alongside the update details for each file. For example, if there are ten files to be processed, namely, Test1 to Test10, then ten respective lock files will be created, namely, Test1.lock to Test10.lock. If there are any errors encountered in the Test1 file, then the error metrics for this file will be appended to the Test1.lock file.
Important: The error metrics is only supported for the following payloads:
- CSV Payload
- Fixed Width
For more information about the CSV and Fixed Width payloads, refer to the sections CSV Payload and Fixed Width.
Important: The error metrics support is only available for the following services:
- HTTP
- REST
- NFS
- CIFS
Important: The following conditions should be met to use the error metrics logging feature:
- Users must use the Protegrity Data Protection method to transform the data.
- Permissive error handling should be configured at the transform rule.
- Error Metrics Logging field must be enabled at the service level.
Note: If the permissive error handling is disabled or a different transformation method is used, then the total_error_count will be 1 in the error metrics.
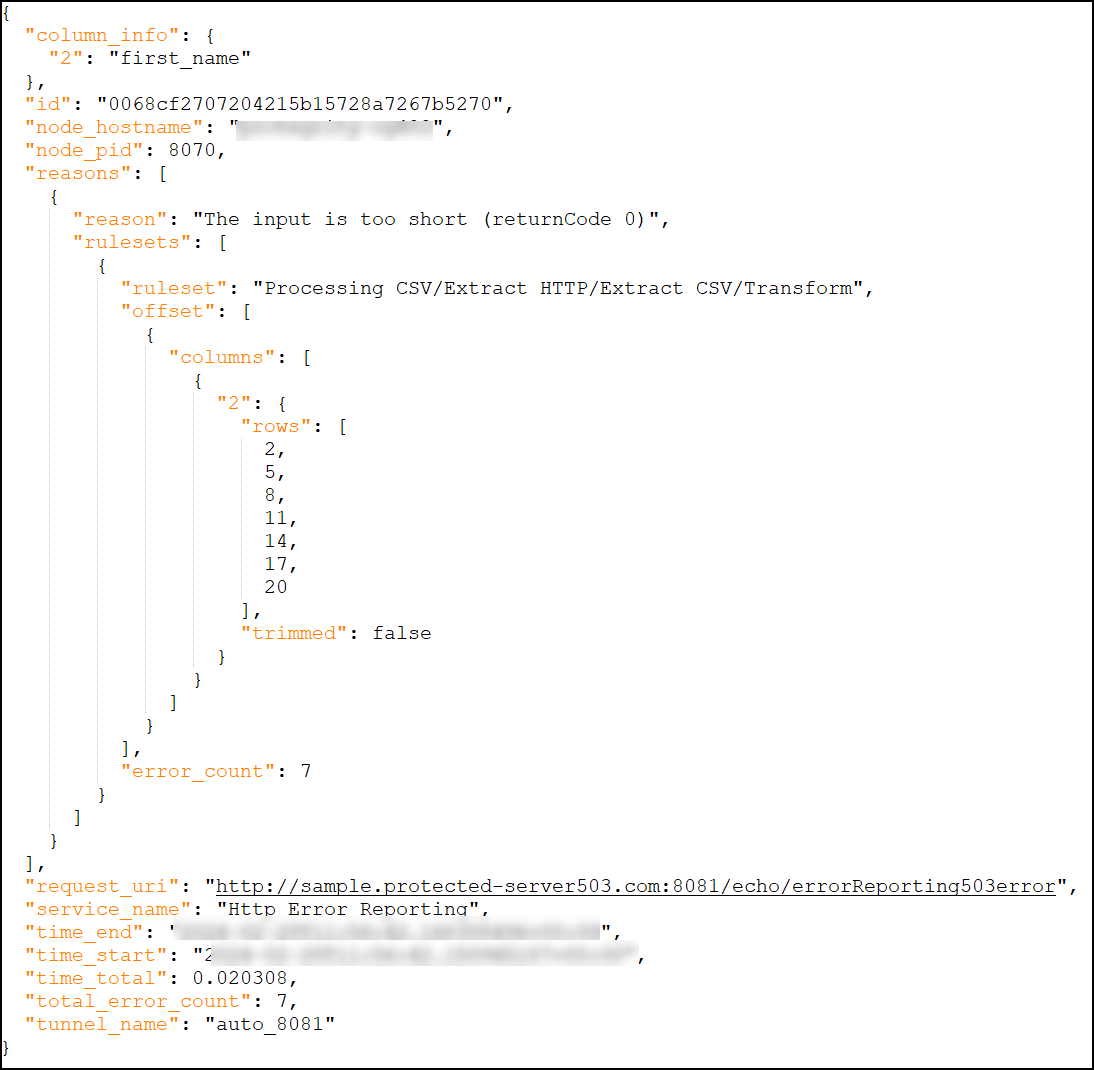
The sample error metrics for the REST request is as seen in the following log file snippet:
The following table describes the parameters available in the error metrics for different services.
| Parameter | Services Supported | Data Type in DSG | Data Type in the Audit Store | Description | Example |
| column_info | HTTP, REST, NFS, CIFS | integer, string | integer, string | For the CSV payload, a list of column numbers and column
names will be logged when the errors are encountered.NoteThe
Header will be taken from the CSV or the Fixed Width extract
rule. While configuring the CSV extract rule, if the Header is
set to -1, then the column_info parameter
will not be logged in the error metrics.The following snippets shows the
column_info parameter for the Fixed Width
payload:"column_info": {
"1": {
"column_start": 3,
"column_width": 17
}
}, | {"column_info":{"2":"first_name"} |
| columns | HTTP, REST, NFS, CIFS | integer | long | The column numbers where the error is encountered. | 2 |
| error_count | HTTP, REST, NFS, CIFS | integer | long | The total number of errors encountered for a particular reason. | 1 |
| file_name | NFS, CIFS | string | string | The name of the file that is being processed by the DSG. | Sample_NFS.csv |
| id | HTTP, REST, NFS, CIFS | string | string | A unique ID to identify the transaction. | a272d51b14df435eb67fdf46d2ecff83 |
| logtype* | All | NA | string | The value to identify type of metric such as
dsg_metrics_error. | dsg_metrics_error |
| node_hostname | HTTP, REST, NFS, CIFS | string | string | The hostname of the DSG. | protegrity-cg123 |
| node_pid | HTTP, REST, NFS, CIFS | integer | integer | The Process ID of the gateway process that processed request. | 5577 |
| origin_time_utc* | All | NA | date | The time in UTC at which this log is ingested. | Feb 26, 2024 @ 03:51:54.416 |
| reasons | All | object | object | The object representing the set of error reason, ruleset details, offset of columns or rows, and error count. | reasons":[{"reason":"The input is too short (returnCode 0)","rulesets":[{"ruleset":"CSV Rule","offset":[{"columns":[{"2":{"rows":[2,5,8,11,14,17,20],"trimmed":false}}]}],"error_count":7}]}] |
| reason | HTTP, REST, NFS, CIFS | string | string | The reason for a particular error will be displayed. | The input is too short (returnCode 0) |
| request_uri | HTTP, REST | string | string | The URI of the request being processed by the DSG. | http://testservice:8081/echo |
| rows | HTTP, REST, NFS, CIFS | integer | integer | The row numbers where the error is encountered. | 0 |
| ruleset | HTTP, REST, NFS, CIFS | string | string | The traversal of the transform rule, which induces the error. | Text Protection/Word by word data extraction/Data Protection |
| service_name | HTTP, REST, NFS, CIFS | string | string | The name of the service processing the request. | REST Demo Service |
| time_end | HTTP, REST, NFS, CIFS | string | date | The timestamp representing when a request was completed. | 2024-02-28T11:48:26.318685532+00:00 |
| total_error_count | HTTP, REST, NFS, CIFS | integer | long | The total number of errors encountered while processing a request. | 1 |
| time_start | HTTP, REST, NFS, CIFS | string | date | The timestamp when the DSG received a request. | 2024-02-28T11:48:18.148773909+00:00 |
| total_time | HTTP, REST, NFS, CIFS | float | double | The difference in seconds between the
time_end and time_start
parameters. | 8.17 |
| trimmed | HTTP, REST, NFS, CIFS | boolean | boolean | True indicates that the error metrics is trimmed. The
trimming of an error metrics depend on the
checkErrorLogAfterCount parameter, that is
configurable in the gateway.json file.For
more information about the
checkErrorLogAfterCount parameter, refer to
the Table: gateway.json configurations in the
Protegrity Data Security Gateway User Guide
3.2.0.0. | false |
| tunnel_name | HTTP, REST, NFS, CIFS | string | string | The name of the tunnel processing the request. | Tunnel_8081 |
Forwarding Error Metrics to Insight
The error metrics is also forwarded to the Audit Store and can be viewed on the Audit Store Dashboards.
Ensure that the following prerequisites are met before you view the logs on the Audit Store Dashboards:
The Analytics component is initialized on the ESA. The initialization of Analytics is required for displaying the Audit Store information in the Audit Store Dashboards.
For more information about initializing Analytics, refer Initializing Analytics on the ESA.
For more information about the audit indexes, refer to the section Understanding the audit index fields.
The logs are forwarded to Insight.
For more information about forwarding the logs, refer to the section Forwarding Audit Logs to Insight.
The following figure shows the sample error metrics on the Discover screen of the Audit Store Dashboards.
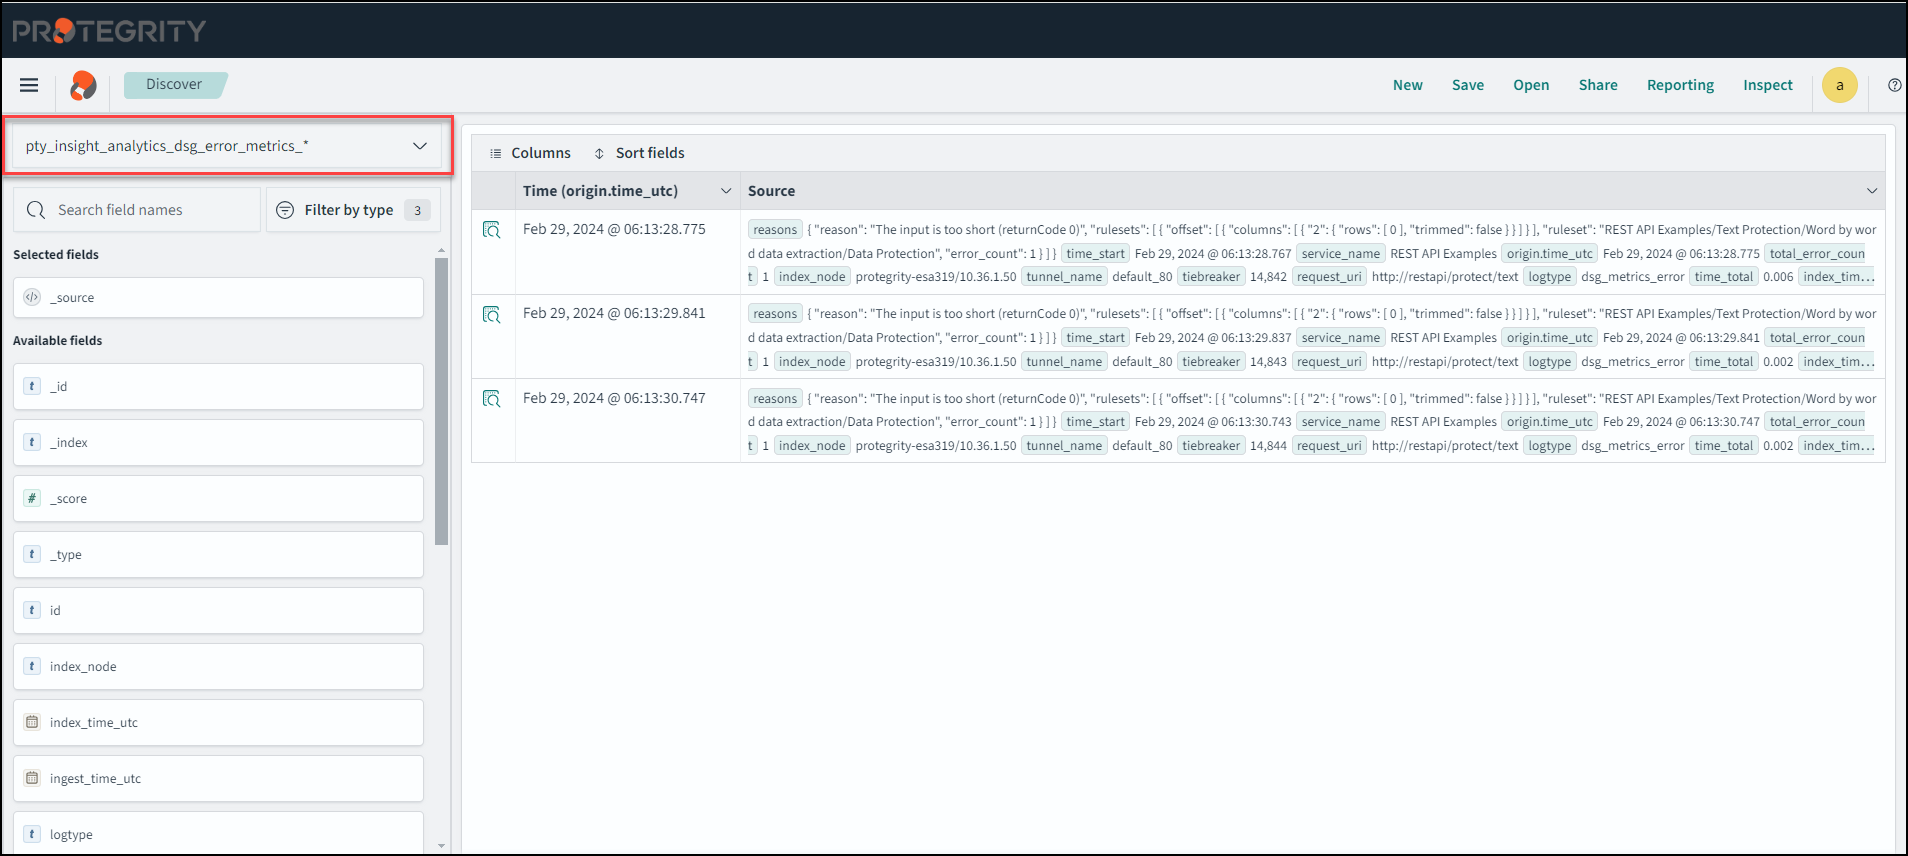
Note: The index_node, tiebreaker, and index_time_utc parameters are only logged on the Audit Store Dashboards.
The DSG error metrics logs are stored in the pty_insight_analytics_dsg_error_metrics_9.2 index file. You can configure and enable the scheduled task to free up the space used by old index files that you do not require. For error metrics, edit the Delete DSG Error Indices task and enable the task. The scheduled task can be set to n days based on your preference.
For more information about scheduled tasks, refer to the section Using the scheduler in the Protegrity Insight Guide 9.2.0.0.
Error Metrics with Non-Permissive Errors
This section describes how the non-permissive errors are logged in the error metrics.
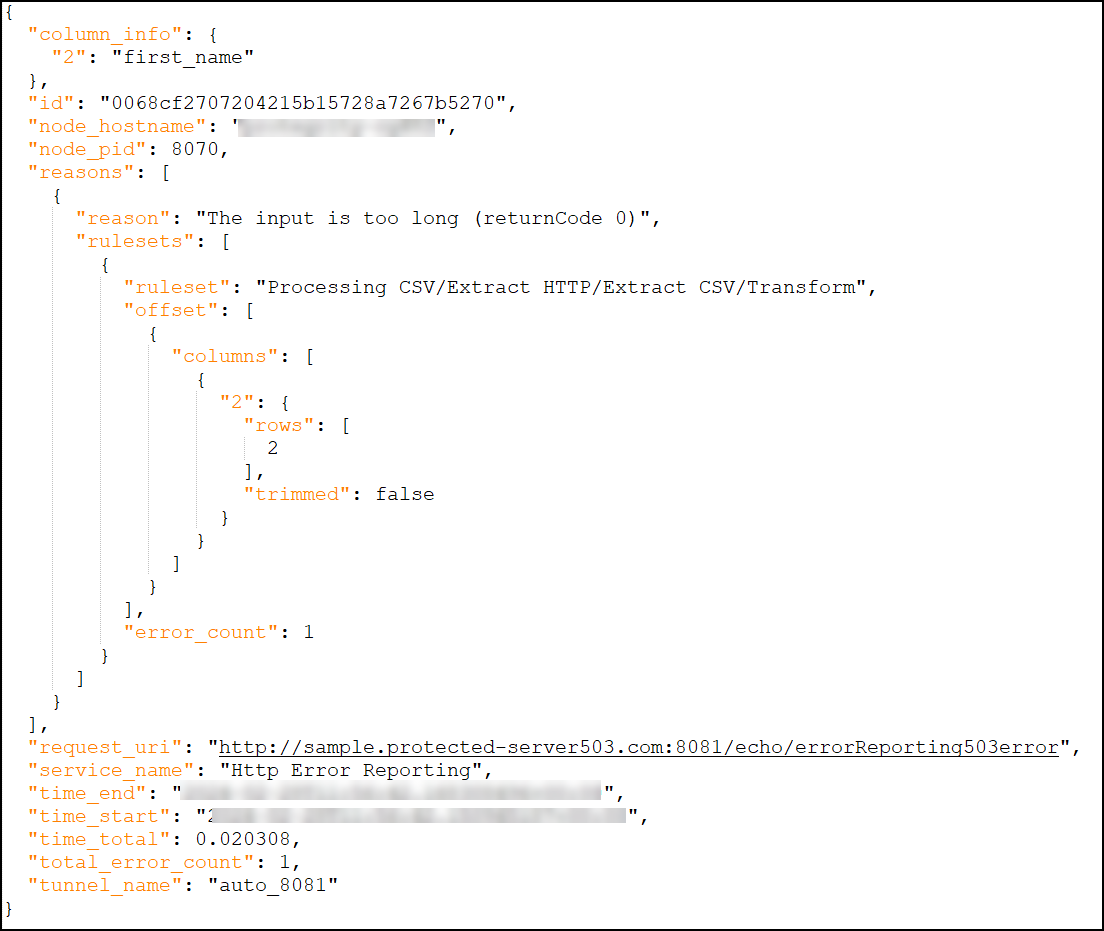
When the permissive error handling is disabled and an error is encountered while transforming data, it will capture the error once and stop processing the entire file. The error could be in the input file, ruleset, or any other configuration. In such scenarios, the error metrics will always be logged with a total_error_count = 1.
The sample error metrics with non-permissive errors are as seen in the following log file snippet:
Configuring the HTTP Status Codes
This section describes how to configure the HTTP status codes for the errors that may occur while processing a file.
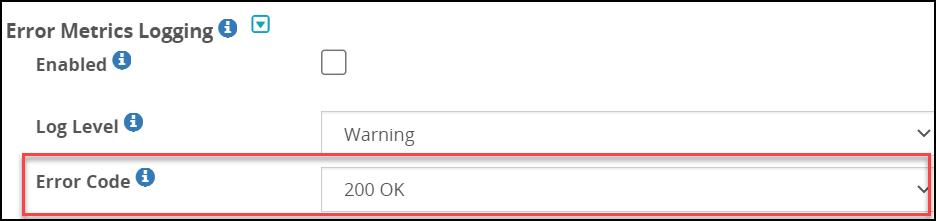
When errors are encountered and the user wants to handle them permissively, then different HTTP status codes can be configured in the Error Code field from the DSG Web UI. At the service level of the RuleSet page, an Error Code field is added for the HTTP and REST protocols to handle errors permissively.
Note: The Error Code field is not supported for the NFS and CIFS protocols.
The following are the HTTP status codes that can be configured from the Web UI:
- 200 OK
- 201 Created
- 202 Accepted
- 203 Non-Authoritative Information
- 205 Reset Content
- 206 Partial Content
- 400 Bad Request
- 401 Unauthorized
- 403 Forbidden
- 422 Unprocessable Entity
- 500 Internal Server Error
- 503 Service Unavailable
Note: By default, the Error Code is set to
200 OK.
The error metrics options for different protocols are as seen in the following figures: