This is the multi-page printable view of this section. Click here to print.
Protegrity AI Enterprise Edition
- 1: Installation
- 1.1: Overview of installation
- 1.2: System Requirements
- 1.3: Partitioning of Disk on ESA
- 1.4: Installing the ESA
- 1.4.1: Installing the ESA On-Premise
- 1.4.2: Installing ESA on Cloud Platforms
- 1.4.3: Installing ESA on VMware
- 1.5: Configuring the ESA
- 1.6: Configuring Load Balancer
- 1.7: Verifying the ESA installation from the Web UI
- 1.8: Initializing the Policy Information Management (PIM) Module
- 1.9: Configuring the ESA in a Trusted Appliances Cluster (TAC)
- 1.10: Creating an Audit Store Cluster
- 2: Configuration
- 2.1: Sending logs to an external security information and event management (SIEM)
- 2.2: Configuring a Trusted Appliance Cluster (TAC) without Consul Integration
- 2.3: Configuring the IP Address for the Docker Interface
- 2.4: Configuring ESA features
- 2.4.1: Rotating Insight certificates
- 2.4.2: Updating the IP address of the ESA
- 2.4.3: Updating the domain name of the ESA
- 2.4.4: Updating the hostname of the ESA
- 2.4.5: Updating Insight custom certificates
- 2.4.6: Removing an ESA from the Audit Store cluster
- 2.5: Identifying the protector version
- 3: Upgrading ESA to v10.2.0
- 3.1: System and License Requirements
- 3.2: Upgrade Paths to ESA v10.2.0
- 3.3: Prerequisites
- 3.4: Upgrading ESA to v10.2.0
- 3.4.1: Upgrading ESA from v9.1.0.x
- 3.4.2: Upgrading ESA from v9.2.0.x
- 3.4.3: Upgrading ESA from v10.0.x
- 3.4.4: Verifying the ESA Patch Installation
- 3.4.5: Verifying the health of Trusted Appliance Cluster
- 3.5: Restoring to the Previous Version of ESA
- 4: Enterprise Security Administrator (ESA)
- 4.1: Protegrity Appliance Overview
- 4.2: Installing ESA
- 4.3: Logging Into ESA
- 4.4: Command-Line Interface (CLI) Manager
- 4.4.1: Accessing the CLI Manager
- 4.4.2: CLI Manager Structure Overview
- 4.4.3: Working with Status and Logs
- 4.4.3.1: Monitoring System Statistics
- 4.4.3.2: Viewing the Top Processes
- 4.4.3.3: Working with System Statistics (SYSSTAT)
- 4.4.3.4: Auditing Service
- 4.4.3.5: Viewing Appliance Logs
- 4.4.3.6: Viewing User Notifications
- 4.4.4: Working with Administration
- 4.4.4.1: Working with Services
- 4.4.4.2: Setting Date and Time
- 4.4.4.3: Managing Accounts and Passwords
- 4.4.4.4: Working with Backup and Restore
- 4.4.4.5: Setting Up the Email Server
- 4.4.4.6: Working with Azure AD
- 4.4.4.6.1: Configuring Azure AD Settings
- 4.4.4.6.2: Enabling/Disabling Azure AD
- 4.4.4.7: Accessing REST API Resources
- 4.4.4.7.1: Using Basic Authentication
- 4.4.4.7.2: Using Client Certificates
- 4.4.4.7.3: Working with JSON Web Token (JWT)
- 4.4.4.7.3.1: Using JWT
- 4.4.4.7.3.2: Generating JWT for REST APIs
- 4.4.4.7.3.3: Refreshing JWT for REST APIs
- 4.4.4.8: Securing the GRand Unified Bootloader
- 4.4.4.8.1: Enabling the Credentials for the GRUB Menu
- 4.4.4.8.2: Disabling the GRUB Credentials
- 4.4.4.9: Working with Installations and Patches
- 4.4.4.9.1: Add/Remove Services
- 4.4.4.9.2: Uninstalling Products
- 4.4.4.9.3: Managing Patches
- 4.4.4.10: Managing LDAP
- 4.4.4.10.1: Working with the Protegrity LDAP Server
- 4.4.4.10.2: Changing the Bind User Password
- 4.4.4.10.3: Working with Proxy Authentication
- 4.4.4.10.4: Configuring Local LDAP Settings
- 4.4.4.10.5: Monitoring Local LDAP
- 4.4.4.10.6: Optimizing Local LDAP Settings
- 4.4.4.11: Rebooting and Shutting down
- 4.4.4.12: Accessing the OS Console
- 4.4.5: Working with Networking
- 4.4.5.1: Configuring Network Settings
- 4.4.5.2: Configuring SNMP
- 4.4.5.2.1: Configuring SNMPv3 as a USM Model
- 4.4.5.2.2: Configuring SNMPv3 as a TSM Model
- 4.4.5.3: Working with Bind Services and Addresses
- 4.4.5.3.1: Binding Interface for Management
- 4.4.5.3.2: Binding Interface for Services
- 4.4.5.4: Using Network Troubleshooting Tools
- 4.4.5.5: Managing Firewall Settings
- 4.4.5.6: Using the Management Interface Settings
- 4.4.5.7: Ports Allowlist
- 4.4.6: Working with Tools
- 4.4.6.1: Configuring the SSH
- 4.4.6.1.1: Specifying SSH Mode
- 4.4.6.1.2: Setting Up Advanced SSH Configuration
- 4.4.6.1.3: Managing SSH Known Hosts
- 4.4.6.1.4: Managing Authorized Keys
- 4.4.6.1.5: Managing Identities
- 4.4.6.1.6: Generating SSH Keys
- 4.4.6.1.7: Configuring the SSH
- 4.4.6.1.8: Customizing the SSH Configurations
- 4.4.6.1.9: Exporting/Importing the SSH Settings
- 4.4.6.1.10: Securing SSH Communication
- 4.4.6.2: Clustering Tool
- 4.4.6.2.1: Creating a TAC using the CLI Manager
- 4.4.6.2.2: Joining an Existing Cluster using the CLI Manager
- 4.4.6.2.3: Cluster Operations
- 4.4.6.2.4: Managing a site
- 4.4.6.2.5: Node Management
- 4.4.6.2.5.1: Show Cluster Nodes and Status
- 4.4.6.2.5.2: Viewing the Cluster Status using the CLI Manager
- 4.4.6.2.5.3: Adding a Remote Node to a Cluster
- 4.4.6.2.5.4: Updating Cluster Information using the CLI Manager
- 4.4.6.2.5.5: Managing Communication Methods for Local Node
- 4.4.6.2.5.6: Managing Local to Remote Node Communication
- 4.4.6.2.5.7: Removing a Node from a Cluster using CLI Manager
- 4.4.6.2.5.8: Uninstalling Cluster Services
- 4.4.6.2.6: Trusted Appliances Cluster
- 4.4.6.2.6.1: Updating Cluster Key
- 4.4.6.2.6.2: Redeploy Local Cluster Configuration to All Nodes
- 4.4.6.2.6.3: Cluster Service Interval
- 4.4.6.2.6.4: Execute Commands as OS Root User
- 4.4.6.3: Working with Xen Paravirtualization Tool
- 4.4.6.4: Working with the File Integrity Monitor Tool
- 4.4.6.5: Rotating Appliance OS Keys
- 4.4.6.6: Managing Removable Drives
- 4.4.6.7: Tuning the Web Services
- 4.4.6.8: Tuning the Service Dispatcher
- 4.4.6.9: Working with Antivirus
- 4.4.6.10: Forwarding system logs to Insight
- 4.4.6.11: Rotating Insight certificates
- 4.4.6.12: Applying Audit Store Security Configuration
- 4.4.6.13: Setting the total memory for the Audit Store Repository
- 4.4.6.14: Forwarding audit logs to Insight
- 4.4.6.15: Exporting alerting configurations
- 4.4.6.16: Importing alerting configurations
- 4.4.7: Working with Preferences
- 4.4.7.1: Viewing System Monitor on OS Console
- 4.4.7.2: Setting Password Requirements for CLI System Tools
- 4.4.7.3: Viewing user notifications on CLI load
- 4.4.7.4: Minimizing the Timing Differences
- 4.4.7.5: Setting a Uniform Response Time
- 4.4.7.6: Limiting Incorrect root Login
- 4.4.7.7: Enabling Mandatory Access Control
- 4.4.7.8: FIPS Mode
- 4.4.7.9: Basic Authentication for REST APIs
- 4.5: Web User Interface (Web UI) Management
- 4.5.1: Working with the Web UI
- 4.5.2: Description of ESA Web UI
- 4.5.3: Working with System
- 4.5.3.1: Working with Services
- 4.5.3.2: Viewing information, statistics, and graphs
- 4.5.3.3: Working with Trusted Appliances Cluster
- 4.5.3.4: Working with Backup and restore
- 4.5.3.4.1: Working with OS Full Backup and Restore
- 4.5.3.4.2: Backing up the data
- 4.5.3.4.3: Backing up custom files
- 4.5.3.4.4: Exporting the custom files
- 4.5.3.4.5: Importing the custom files
- 4.5.3.4.6: Working with the custom files
- 4.5.3.4.7: Restoring configurations
- 4.5.3.4.8: Viewing Export/Import logs
- 4.5.3.5: Scheduling appliance tasks
- 4.5.3.5.1: Viewing the scheduler page
- 4.5.3.5.2: Creating a scheduled task
- 4.5.3.5.3: Scheduling Configuration Export to Cluster Tasks
- 4.5.3.5.4: Deleting a scheduled task
- 4.5.4: Viewing the logs
- 4.5.5: Working with Settings
- 4.5.5.1: Working with Antivirus
- 4.5.5.1.1: Customizing Antivirus Scan Options
- 4.5.5.1.2: Scheduling Antivirus Scan
- 4.5.5.1.3: Updating the Antivirus Database
- 4.5.5.1.4: Working with Antivirus Logs
- 4.5.5.2: Configuring Appliance Two Factor Authentication
- 4.5.5.2.1: Working with Automatic Per-User Shared-Secret
- 4.5.5.2.2: Working with Host-Based Shared-Secret
- 4.5.5.2.3: Working with Remote Authentication Dial-up Service (RADIUS) Authentication
- 4.5.5.2.4: Working with Shared-Secret Lifecycle
- 4.5.5.2.5: Logging in Using Appliance Two Factor Authentication
- 4.5.5.2.6: Disabling Appliance Two Factor Authentication
- 4.5.5.3: Working with Configuration Files
- 4.5.5.4: Working with File Integrity
- 4.5.5.5: Managing File Uploads
- 4.5.5.6: Configuring Date and Time
- 4.5.5.7: Configuring Email
- 4.5.5.8: Configuring Network Settings
- 4.5.5.8.1: Managing Network Interfaces
- 4.5.5.8.2: NIC Bonding
- 4.5.5.9: Configuring Web Settings
- 4.5.5.9.1: General Settings
- 4.5.5.9.2: Session Management
- 4.5.5.9.3: Shell in a box settings
- 4.5.5.9.4: SSL cipher settings
- 4.5.5.9.5: Updating a protocol from the ESA Web UI
- 4.5.5.10: Working with Secure Shell (SSH) Keys
- 4.5.5.10.1: Configuring the authentication type for SSH keys
- 4.5.5.10.2: Configuring inbound communications
- 4.5.5.10.3: Configuring outbound communications
- 4.5.5.10.4: Configuring known hosts
- 4.5.6: Managing Appliance Users
- 4.5.7: Password Policy for all appliance users
- 4.5.7.1: Managing Users
- 4.5.7.1.1: Adding users to internal LDAP
- 4.5.7.1.2: Importing users to internal LDAP
- 4.5.7.1.3: Password policy configuration
- 4.5.7.1.4: Edit users
- 4.5.7.2: Managing Roles
- 4.5.7.3: Configuring the proxy authentication settings
- 4.5.7.4: Working with External Groups
- 4.5.7.5: Configuring the Azure AD Settings
- 4.5.7.5.1: Importing Azure AD Users
- 4.5.7.5.2: Working with External Azure Groups
- 4.6: Trusted Appliances Cluster (TAC)
- 4.6.1: TAC Topology
- 4.6.2: Cluster Configuration Files
- 4.6.3: Deploying Appliances in a Cluster
- 4.6.4: Cluster Security
- 4.6.5: Reinstalling Cluster Services
- 4.6.6: Uninstalling Cluster Services
- 4.6.7: FAQs on TAC
- 4.6.8: Creating a TAC using the Web UI
- 4.6.9: Connection Settings
- 4.6.10: Joining an Existing Cluster using the Web UI
- 4.6.11: Managing Communication Methods for Local Node
- 4.6.12: Viewing Cluster Information
- 4.6.13: Removing a Node from the Cluster using the Web UI
- 4.7: Appliance Virtualization
- 4.7.1: Xen Paravirtualization Setup
- 4.7.1.1: Pre-Conversion Tasks
- 4.7.1.2: Paravirtualization Process
- 4.7.2: Xen Server Configuration
- 4.7.3: Installing Xen Tools
- 4.7.4: Xen Source – Xen Community Version
- 4.8: Appliance Hardening
- 4.8.1: Open listening ports
- 4.9: VMware tools in appliances
- 4.10: Increasing the Appliance Disk Size
- 4.11: Mandatory Access Control
- 4.11.1: Working with profiles
- 4.11.2: Analyzing events
- 4.11.3: AppArmor permissions
- 4.11.4: Troubleshooting for AppArmor
- 4.12: Accessing Appliances using Single Sign-On (SSO)
- 4.12.1: What is Kerberos
- 4.12.1.1: Implementing Kerberos SSO for Protegrity Appliances
- 4.12.1.1.1: Prerequisites
- 4.12.1.1.2: Setting up Kerberos SSO
- 4.12.1.1.3: Logging to the Appliance
- 4.12.1.1.4: Scenarios for Implementing Kerberos SSO
- 4.12.1.1.5: Viewing Logs
- 4.12.1.1.6: Feature Limitations
- 4.12.1.1.7: Troubleshooting
- 4.12.2: What is SAML
- 4.12.2.1: Setting up SAML SSO
- 4.12.2.1.1: Workflow of SAML SSO on an Appliance
- 4.12.2.1.2: Logging on to the Appliance
- 4.12.2.1.3: Implementing SAML SSO on Azure IdP - An Example
- 4.12.2.1.4: Implementing SSO with a Load Balancer Setup
- 4.12.2.1.5: Viewing Logs
- 4.12.2.1.6: Feature Limitations
- 4.12.2.1.7: Troubleshooting
- 4.13: Sample External Directory Configurations
- 4.14: Partitioning of Disk on an Appliance
- 4.14.1: Partitioning the OS in the UEFI Boot Option
- 4.14.2: Partitioning the OS with the BIOS Boot Option
- 4.15: Working with Keys
- 4.16: Working with Certificates
- 4.17: Managing policies
- 4.18: Working with Insight
- 4.18.1: Understanding the Audit Store node status
- 4.18.2: Working with Audit Store nodes
- 4.18.3: Working with Audit Store roles
- 4.18.4: Working with Discover
- 4.18.5: Overview of the dashboards
- 4.18.6: Viewing the dashboards
- 4.18.7: Viewing visualizations
- 4.18.8: Viewing visualization templates
- 4.19: Maintaining Insight
- 4.19.1: Working with alerts
- 4.19.2: Index lifecycle management (ILM)
- 4.19.3: Viewing policy reports
- 4.19.4: Verifying signatures
- 4.19.5: Using the scheduler
- 4.20: Installing Protegrity Appliances on Cloud Platforms
- 4.20.1: Installing ESA on Amazon Web Services (AWS)
- 4.20.1.1: Verifying Prerequisites
- 4.20.1.2: Obtaining the AMI
- 4.20.1.3: Loading the Protegrity Appliance from an Amazon Machine Image (AMI)
- 4.20.1.3.1: Creating an ESA Instance from the AMI
- 4.20.1.3.2: Configuring the Virtual Private Cloud (VPC)
- 4.20.1.3.3: Adding a Subnet to the Virtual Private Cloud (VPC)
- 4.20.1.3.4: Finalizing the Installation of Protegrity Appliance on the Instance
- 4.20.1.3.4.1: Logging to the AWS Instance using the SSH Client
- 4.20.1.3.4.2: Finalizing an AWS Instance
- 4.20.1.4: Backing up and Restoring Data on AWS
- 4.20.1.5: Increasing Disk Space on the Appliance
- 4.20.1.6: Best Practices for Using Protegrity Appliances on AWS
- 4.20.1.7: Running the Appliance-Rotation-Tool
- 4.20.1.8: Working with Cloud-based Applications
- 4.20.1.8.1: Configuring Access for AWS Resources
- 4.20.1.8.2: Working with CloudWatch Console
- 4.20.1.8.2.1: Integrating CloudWatch with Protegrity Appliance
- 4.20.1.8.2.2: Configuring Custom Logs on AWS CloudWatch Console
- 4.20.1.8.2.3: Toggling the CloudWatch Service
- 4.20.1.8.2.4: Reloading the AWS CloudWatch Integration
- 4.20.1.8.2.5: Viewing Logs on AWS CloudWatch Console
- 4.20.1.8.2.6: Working with AWS CloudWatch Metrics
- 4.20.1.8.2.7: Viewing Metrics on AWS CloudWatch Console
- 4.20.1.8.2.8: Disabling AWS CloudWatch Integration
- 4.20.1.8.3: Working with the AWS Cloud Utility
- 4.20.1.8.3.1: Storing Backup Files on the AWS S3 Bucket
- 4.20.1.8.3.2: Set Metrics Based Alarms Using the AWS Management Console
- 4.20.1.8.4: FAQs for AWS Cloud Utility
- 4.20.1.8.5: Working with AWS Systems Manager
- 4.20.1.8.5.1: Setting up AWS Systems Manager
- 4.20.1.8.5.2: FAQs on AWS Systems Manager
- 4.20.1.8.6: Troubleshooting for the AWS Cloud Utility
- 4.20.2: Installing ESA on Google Cloud Platform (GCP)
- 4.20.2.1: Verifying Prerequisites
- 4.20.2.2: Configuring the Virtual Private Cloud (VPC)
- 4.20.2.3: Obtaining the GCP Image
- 4.20.2.4: Converting the Raw Disk to a GCP Image
- 4.20.2.5: Loading the Protegrity ESA Appliance from a GCP Image
- 4.20.2.5.1: Creating a VM Instance from an Image
- 4.20.2.5.2: Creating a VM Instance from a Disk
- 4.20.2.5.3: Accessing the Appliance
- 4.20.2.6: Finalizing the ESA Installation on the Instance
- 4.20.2.7: Deploying the Instance of the Protegrity Appliance with the Protectors
- 4.20.2.8: Backing up and Restoring Data on GCP
- 4.20.2.9: Increasing Disk Space on the Appliance
- 4.20.3: Installing Protegrity Appliances on Azure
- 4.20.3.1: Verifying Prerequisites
- 4.20.3.2: Azure Cloud Utility
- 4.20.3.3: Setting up Azure Virtual Network
- 4.20.3.4: Creating a Resource Group
- 4.20.3.5: Creating a Storage Account
- 4.20.3.6: Creating a Container
- 4.20.3.7: Obtaining the Azure BLOB
- 4.20.3.8: Creating Image from the Azure BLOB
- 4.20.3.9: Creating a VM from the Image
- 4.20.3.10: Accessing the Appliance
- 4.20.3.11: Finalizing the Installation of Protegrity Appliance on the Instance
- 4.20.3.12: Accelerated Networking
- 4.20.3.13: Backing up and Restoring VMs on Azure
- 4.20.3.14: Deploying the ESA Instance with the Protectors
- 4.21: Architectures
- 5: Key Management
- 5.1: Protegrity Key Management
- 5.2: Key Management Web UI
- 5.3: Working with Keys
- 5.4: Key Points for Key Management
- 5.5: Keys-Related Terminology
- 5.6: Key Store Management
- 5.6.1: Support Matrix
- 5.6.2: Configuring the ESA with HSMs supporting PKCS#11 Interface
- 5.6.3: Configuring the ESA with the Thales Luna HSM
- 5.6.4: Configuring the ESA with Thales Data Protection on Demand (DPoD) HSM
- 5.6.5: Configuring the ESA with AWS Key Management System (KMS)
- 5.6.6: Configuring the ESA with Google Cloud KMS
- 5.6.7: Configuring the ESA with Azure Key Vault Managed HSM
- 5.6.8: Switching Key Stores
- 5.6.9: Troubleshooting
- 5.6.10: TAC Replication of Key Store-specific Files and Certificates
- 6: Certificate Management
- 6.1: Certificates in the ESA
- 6.2: Certificate Requirements
- 6.3: Certificate Management in ESA
- 6.3.1: Certificate Repository
- 6.3.2: Uploading Certificates
- 6.3.3: Uploading Certificate Revocation List
- 6.3.4: Manage Certificates
- 6.3.5: Changing Certificates
- 6.3.6: Changing CRL
- 6.4: Certificates in DSG
- 6.5: Replicating Certificates in a Trusted Appliance Cluster
- 6.6: Insight Certificates
- 6.7: Validating Certificates
- 7: Protegrity REST APIs
- 7.1: Accessing the Protegrity REST APIs
- 7.2: View the Protegrity REST API Specification Document
- 7.3: Using the Common REST API Endpoints
- 7.4: Using the Policy Management REST APIs
- 7.5: Using the Encrypted Resilient Package REST APIs
- 8: Protegrity Data Security Platform Licensing
- 9: Troubleshooting
- 9.1: Policy and Key Audit logs
- 9.2: Known issues for the Audit Store
- 9.3: ESA Error Handling
- 9.3.1: ESA Upgrade Readiness Patch Error Messages and Resolutions
- 9.3.2: Common ESA Logs
- 9.3.3: Common ESA Errors
- 9.3.4: Understanding the Insight indexes
- 9.3.5: Understanding the index field values
- 9.3.6: Index entries
- 9.3.7: Log return codes
- 9.3.8: Policy Management Errors
- 9.3.9: Protectors security log codes
- 9.3.10: Additional log information
- 9.4: Known Issues for the td-agent
- 9.5: Known Issues for Protegrity Analytics
- 9.6: Known Issues for the Log Forwarder
- 9.7: Deprecations
- 10: Intellectual Property Attribution Statement
- 11: Policy Management
- 11.1: Protegrity Data Security Methodology
- 11.2: Policy Components
- 11.2.1: Data Elements
- 11.2.1.1: Example - Creating a Token Data Element
- 11.2.1.2: Example - Creating a FPE Data Element
- 11.2.1.3: Example - Creating a Data Element for Unstructured Data
- 11.2.2: Alphabets
- 11.2.3: Masks
- 11.2.4: Trusted Applications
- 11.2.5: Data Stores
- 11.2.5.1: Configuring Allowed Servers
- 11.2.5.2: Export Keys
- 11.2.5.3: Adding Trusted Applications to the Data Store
- 11.2.5.4: Adding Policies to the Data Store
- 11.2.6: Member Sources
- 11.2.6.1: Configuring Member Sources
- 11.2.6.1.1: Configuring Active Directory Member Source
- 11.2.6.1.2: Configuring File Member Source
- 11.2.6.1.3: Configuring LDAP Member Source
- 11.2.6.1.4: Configuring POSIX Member Source
- 11.2.6.1.5: Configuring Azure AD Member Source
- 11.2.6.1.6: Configuring Database Member Source
- 11.2.7: Roles
- 11.2.7.1: Role Refresh Modes
- 11.2.7.2: Adding Members to a Role
- 11.2.7.2.1: Filtering Members in a Role
- 11.2.7.2.1.1: Filtering Members from AD and LDAP Member Sources
- 11.2.7.2.1.2: Filtering Members from Azure AD Member Source
- 11.2.7.3: Managing Members in a Role
- 11.2.7.4: Searching Members
- 11.2.7.5: Searching Member Access
- 11.3: Policy Management
- 11.3.1: Creating Policies
- 11.3.2: Adding Data Elements to Policy
- 11.3.3: Adding Roles to Policy
- 11.3.4: Configuring Policy Permissions
- 11.3.4.1: Permission Conflicts
- 11.3.4.1.1: Inheriting Permissions
- 11.3.5: Deploying Policies
- 11.4: Policy Management Dashboard
- 11.5: Package Deployment
- 11.6: Legacy Features
- 12: Model Architecture
- 12.1: Overview
- 12.2: Model Architecture
- 12.2.1: Deployment with Default Audit Logging Flow to ESA
- 12.2.2: Deployment with Audit Logging Flow to External SIEM
- 12.2.3: Network Architecture Overview
- 12.2.4: Enterprise Security Administrator (ESA)
- 12.2.4.1: Infrastructure Requirements
- 12.2.4.2: Installing and Configuring ESA
- 12.2.4.3: ESA Upgrade Scenarios
- 12.2.4.3.1: Upgrading ESA
- 12.2.4.4: External Keystore Configuration
- 12.2.4.5: Scheduler Tasks
- 12.2.4.6: Backup and Restore
- 12.2.4.7: Insight
- 12.2.5: Recommended Traffic Manager
- 12.2.6: Disaster Recovery
- 12.2.6.1: Promoting Secondary ESA to Primary ESA
- 12.2.7: Fault Tolerance
- 12.2.8: Security
- 12.2.8.1: Open Ports
- 12.2.8.2: Certificate Requirements
- 12.2.8.3: FIPS Compliance Requirements
- 12.2.8.4: Users and Password Policy
- 12.2.8.5: File Integrity Monitoring
- 12.2.8.6: Delete Default System Certificates
- 12.2.8.7: Uninstall Consul
- 12.2.9: Data Security Gateway (DSG)
- 12.2.9.1: Installing and Configuring DSG
- 12.2.9.2: Upgrading ESA with DSG
- 12.2.10: Upgrading ESA with 9.1.0.0/10.x Protectors
- 12.2.11: Upgrading ESA with DSGs and 9.1.0.0/10.x Protectors
- 12.2.12: Standard Protectors
- 12.2.13: Forwarding Logs to External SIEM
1 - Installation
1.1 - Overview of installation
Audience
The installation steps is intended for the following stakeholders:
- Security professionals like security officers who are responsible for protecting business systems in organizations. They plan and ensure execution of security arrangement for their organization.
- System administrators and other technical personnel who are responsible for implementing data security solutions in their organization.
- System Architects who are responsible for providing expert guidance in designing, development and implementation of enterprise data security solution architecture for their business requirements.
Protegrity Data Security Platform
The Protegrity Data Security Platform is a comprehensive source of enterprise data protection solutions. Its design is based on a hub and spoke deployment architecture.
The Protegrity Data Security Platform has following components:
Enterprise Security Administrator (ESA) – that handles the management of policies, keys, monitoring, auditing and reporting of protected systems in the enterprise.
Data Protectors – that protect sensitive data in the enterprise and deploy security policy for enforcement on each installed system. Policy is deployed from ESA to the Data Protectors. The Audit Logs of all activity on sensitive data are reported and stored in the Audit Store cluster on the ESA.
General Overview
The following diagram shows the general overview of various Protegrity products.

1.2 - System Requirements
The following table lists the supported components and their compatibility settings.
| Component | Compatibility |
|---|---|
| Application Protocols | HTTP 1.0, HTTP 1.1, SSL/TLS |
| WebServices | SOAP 1.1 and WSDL 1.1 |
| Web Browsers | Minimum supported Web Browser versions are as follows: - Google Chrome version 129.0.6668.58/59 (64-bit) - Mozilla Firefox version 130.0.1 (64-bit) or higher - Microsoft Edge version 128.0.2739.90 (64-bit) |
The following table lists the minimum hardware configurations.
| Hardware Components | Configuration |
|---|---|
| CPU | Multicore Processor, with minimum 8 CPUs |
| RAM | 32 GB |
| Hard Disk | 320 GB |
| CPU Architecture | x86 |
Certificate Requirements
Certificates are used for secure communication between the ESA and protectors. The certificate-based communication and authentication involves a client certificate, server certificate, and a certifying authority that authenticates the client and server certificates.
The various components within the Protegrity Data Security Platform that communicate with and authenticate each other through digital certificates are:
- ESA Web UI and ESA
- Insight
- ESA and Protectors
- Protegrity Appliances and external REST clients
Protegrity client and server certificates are self-signed by Protegrity. However, these can be replaced by certificates signed by a trusted and commercial CA. These certificates are used for communication between various components in ESA.
Licensing Requirements
Ensure that a valid license is available before upgrading. After migration, if the license status is invalid, then contact Protegrity Support.
1.3 - Partitioning of Disk on ESA
BIOS is amongst the oldest systems used as a boot loader to perform the initialization of the hardware. UEFI is a comparatively newer system that defines a software interface between the operating system and the platform firmware. The UEFI is more advanced than the BIOS and most of the systems are built with support for UEFI and BIOS.
Disk Partitioning is a method of dividing the hard drive into logical partitions. When a new hard drive is installed on a system, the disk is segregated into partitions. These partitions are utilized to store data, which the operating system reads in a logical format. The information about these partitions is stored in the partition table.
There are two types of partition tables, the Master Boot Record (MBR) and the GUID Partition Table (GPT). These form a special boot section in the drive that provides information about the various disk partitions. They help in reading the partition in a logical manner.
Depending on the requirements, the size of the partitions in a physical volume can be extended to accommodate all the logs and other ESA related data. The Logical Volume Manager (LVM) can be utilized to increase the partitions in the physical volume. Using LVM, manage hard disk storage to allocate, mirror, or resize volumes.
In ESA, the physical volume is divided into the following three logical volume groups:
| Partition | Description |
|---|---|
| Boot | Contains the boot information. |
| PTYVG | Contains the files and information about OS and logs. |
| Data Volume Group | Contains the data that is in the /opt directory. |
1.4 - Installing the ESA
The ESA appliance can be installed on any of the following platforms.
- On-premise (ISO)
- Cloud platforms
- Amazon Web Services (AWS)
- Microsoft Azure
- Google Cloud Platform (GCP)
- VMWare (OVA)
1.4.1 - Installing the ESA On-Premise
1. Starting the installation
To install the ESA:
Insert the ESA installation media in the system disk drive.
Boot the system from the disk drive.
The following screen appears.
Press ENTER to start the installation.
The following screen appears.

The system will detect the number of hard drives that are present. If there are multiple hard drives, then it will allow you to choose the hard drive where you want to install the OS partition and the /opt partition.
If there are multiple hard drives, then the following screen appears.

For storing the operating system-related data, select the hard drive where you want to install the OS partition and select OK.
The following screen appears.

For storing the logs, configuration data, and so on select the hard drive where you want to install the /opt partition and select OK.
2. Selecting Network Interface Cards (NICs)
The Network Interface Card (NIC) is a device through which appliances, such as, the ESA or the DSG, connect to each other on a network. You can configure multiple network interface cards (NICs) on the appliance.
The ethMNG interface is generally used for managing the appliance and ethSRV interface is used for binding the appliances for using other services.
For example, the appliance can use the ethMNG interface for the ESA Web UI and the ethSRV interface for enabling communication with different applications in an enterprise.
The following task describes how to select management interfaces.
To select multiple NICs:
If there are multiple NICs, then the following screen appears.

Select the required NIC for management interface.
Choose Select and press ENTER.
3. Configuring Network Settings
After selecting the NIC for management, you configure the network for the ESA. During the network configuration, the system tries to connect to a DHCP server to obtain the hostname, default gateway, and IP addresses for the ESA. If the DHCP is not available, then you can configure the network information manually.
To configure the network settings:
If the DHCP server is configured, then the following screen containing the network information appears.

If the DHCP server is not available, then the following screen appears.

The Network Configuration Information screen appears.
Select Manual and press ENTER.
The following screen appears.

Select DHCP / Static address to configure the DHCP / Static address for the ESA and choose Edit.
Select Static address and choose Update.
If you want to change the hostname of the ESA, then perform the following steps.
- Select Hostname and select Edit.
- Change the Hostname and select OK.
Select Management IP to configure the management IP address for the ESA and choose Edit.

- Add the IP address assigned to the ethMNG interface. This IP address configures the ESA to use the Web UI.
- Enter the Netmask. The ethMNG interface must be connected to the LAN with this Netmask value.
- Select OK.
Select Default Route to configure the default route for the ESA and press Edit.

- Enter the IP address for the default network traffic.
- Select Apply.
Select Domain Name and press Edit.

- Enter the Domain Name. For example, protegrity.com.
- Press Apply.
Select Name Servers and press Edit.

- Add the IP address of the name server.
- Press OK.
If you want to configure the NTP, then perform the following steps.
- Select Time Server (NTP), and press Edit.
- Add NTP time server on a TCP/IP network.
- Select Apply.
Select Apply.
The network settings are configured.
4. Configuring Time Zone
After you configure the network settings, the Time Zone screen appears. This section explains how to set the time zone.
To set the Time Zone:
On the Time Zone screen, select the time zone.

Press Next.
The time zone is configured.
5. Configuring the Nearest Location
After configuring the time zone, the Nearest Location screen appears.
To Set the Nearest Location:
On the Nearest Location screen, enter the nearest location in GMT or UTC.

Press OK.
The following screen appears.

This screen also allows you to update the default settings of date and time, keyboard manufacturer, keyboard model, and keyboard layout.
6. Updating the Date and Time
To Update the Date and Time:
Press SPACE and select Update date and time.
Press ENTER.
The following screen appears.

Select the date.
Select Set Date and press ENTER.
The next screen appears.

Set the time.
Click Set Time and press ENTER.
The date and time settings are configured.
7. Updating the Keyboard Settings
To Update the Keyboard Settings:
Select Update Keyboard or Console settings.
Press ENTER.
Select the vendor and press the SPACEBAR.

Select Next.
If you select Generic, then a window with the list of generic keyboard models appears.
Select the model you use and press Next.

On the next window, select the keyboard language. The default is English (US).

Select Next.
On the next window, select the console font. The default is Lat15-Fixed16.

Press Next.
A confirmation message appears.
Press OK to confirm.

8. Configuring GRUB Settings
On the ESA, GRUB version 2 (GRUB2) is used for loading the kernel. If you want to protect the boot configurations, then you can secure it by enforcing a username and password combination for the GRUB menu.
During installation for the ESA on-premise, a screen to configure GRUB credentials appears. If you want to protect the boot configurations, then you can secure it by enforcing a username and password combination for the GRUB menu. While installing the ESA v9.2.0.0, you can secure the GRUB menu by creating a username and setting password as described in the following task.
To configure GRUB settings:
From the GRUB Credentials page, press the SPACEBAR to select Enable.

By default the Disable is selected. If you continue to choose Disable, then the security for the GRUB menu is disabled. It is recommended to enable GRUB to secure the ESA.
You can enable this feature from the CLI Manager after the installation is completed. On the CLI Manager, navigate to Administration > GRUB Credential Settings to enable the GRUB settings.
For more information about GRUB, refer to the section Securing the GRand Unified Bootloader (GRUB).
Select OK.
The following screen appears.

Enter a username in the Username text box.
Note:
The requirements for the Username are as follows:
- It should contain a minimum of three and maximum of 16 characters
- It should not contain numbers and special characters
Enter a password in the Password and Re-type Password text boxes.
Note:
The requirements for the Password are as follows:
- It must contain at least eight characters
- It must contain a combination of alphabets, numbers, and printable characters
Select OK and press ENTER.
A message
Credentials for the GRUB menu has been set successfullyappears.
Select OK.
9. Setting up Users and Passwords
Only authorized users can access the ESA. The Protegrity Data Security Platform defines a list of roles for each user who can access the ESA. These are system users and LDAP administrative users who have specific roles and permissions. When you install the ESA, the default users configured are as follows:
- root: Super user with access to all commands and files.
- admin: User with administrative privileges to perform all operations.
- viewer: User who can view, but does not have edit permissions.
- local_admin: Local administrator that can be used when the admin user is not accessible.
After completing the server settings, the Users Passwords screen appears that allows you set the passwords for the users.

To set the LDAP Users Passwords:
Add the passwords of the users.
Note: Ensure that the passwords for the users comply with the password polices.
For more information about the password policies, refer to the section Password Policy Configuration in the Protegrity Enterprise Security Administrator Guide 9.2.0.0.
Select Apply.
The user passwords are set.
10. Licensing
After the ESA components are installed, the Temporary License screen appears. This system takes time. It is recommended to wait for few minutes before proceeding.
Note: After the ESA is installed, you must apply for a valid license within 30 days.

For more information about licenses, refer Licensing.
11. Installing Products
In the final steps of installing the ESA, you are prompted to select the components to install.
To select products to install:
Press space and select the necessary products to install the following products.

Click OK.
The selected products are installed.
After installation is completed, the following screen appears.

Select Continue to view the CLI Login screen.
1.4.2 - Installing ESA on Cloud Platforms
This section describes installing the ESA on Cloud platforms, such as, Amazon Web Services (AWS), Azure, or Google Cloud Platform (GCP). For installing the ESA on cloud platforms, you must mount the image containing the ESA on a cloud instance or a virtual machine. After mounting the image, you must run the finalization procedure to install the ESA components.
Installing ESA on AWS
The following steps must be completed to run an ESA on AWS:
- Verifying the prerequisites.
- Obtaining the AMI.
- Creating an instance of the ESA from the AMI.
- Configuring the various inbound and outbound ports in the VPC.
- Logging to the AWS instance using the SSH Client.
- Finalizing the AWS instance.
- Logging into ESA.
Installing ESA on Azure
The following steps must be completed to run an ESA on Azure:
- Verifying the prerequisites.
- Creating a Resource Group.
- Creating a Storage Account.
- Creating a Container.
- Obtaining the Azure BLOB.
- Create an image from the BLOB.
- Create a VM from the image.
- Accessing the ESA.
- Finalizing the installation of ESA on the instance.
- Logging into ESA.
Installing ESA on GCP
The following steps must be completed to run an ESA on GCP:
1.4.3 - Installing ESA on VMware
This section describes the process to install the ESA using an OVA template.
For more information about the compatible VMware version, refer to the Release Notes of the relevant release.
1.4.3.1 - Creating an OVA Template
Perform the steps to create an Open Virtual Appliance (OVA) template:
Log in to the VMware Client console.
Navigate to Inventories > VMs and Templates.
From the left navigation pane, select the required project.
Right-click the project name and select Deploy OVF Template….The Deploy OVF Template screen appears.
From Select an OVF template, select the preferred method to upload the .ova file.The .ova file can be accessed using the URL or by uploading a local file.
Click Next.
From Select a name and folder, enter the name of the virtual machine in the Virtual machine name field and select the location for virtual machine. Click Next.
From Select a destination compute resource, select the required compute resource. Click Next.
From Review details, verify the publisher, download size, and size on disk. Click Next.
From Select storage, select the required disk formats, VM Storage Policy, Show datastores from Storage DRS clusters, and datastore to store the deployed OVF or OVA template.
Click Next.
From Select network, select the required network. Click Next.
From Ready to complete, verify the details and click Finish.
This may take sometime to successfully complete the creation of virtual machine. Ensure to proceed only once the virtual machine is created successfully.
After the instance is successfully created, from the left navigation pane, select the virtual machine name.
Right-click the virtual machine name and select Convert to Template.A Confirm Convert dialog box appears.
Click Yes.
The OVA template is successfully created.
1.4.3.2 - Creating a Virtual Machine using OVA template
Perform the steps to create a virtual machine using the OVA template:
Navigate to Inventories > VMs and Templates.
From the left navigation pane, select the required project.
Select the required OVA template.
Right-click the template name, and select New VM from This Template.
From Select a name and folder, enter the name of the virtual machine in the Virtual machine name field and select the location for virtual machine. Click Next.
From Select a destination compute resource, select the required compute resource. Click Next.
From Select storage, select the required storage.Select the required disk formats, VM Storage Policy, Show datastores from Storage DRS clusters, and datastore to store the deployed OVF or OVA template.
Click Next.
From Select clone options, select the required clone options.
If the Customize the operating option is selected, then the Customize guest OS screen appears.Configure the required OS for the virtual machine. Click Next.
If the Customize this virtual machine’s hardware option is selected, then the Customize hardware screen appears.Configure the required hardware for the virtual machine. Click Next.
From Ready to complete, verify the details and click Finish.
The virtual machine is created successfully.
1.4.3.3 - Installing the ESA on the Virtual Machine
1. Starting the installation
Ensure that the virtual machine is powered on before starting the installation process.
To install the ESA:
Select the virtual machine.
Click LAUNCH WEB CONSOLE.
2. Configuring Network Settings
After selecting the NIC for management, configure the network for the ESA. During the network configuration, the system tries to connect to a DHCP server to obtain the hostname, default gateway, and IP addresses for the ESA. If the DHCP is not available, then you can configure the network information manually.
To configure the network settings:
If the DHCP server is configured, then the screen containing the network information appears.
If the DHCP server is not available, then the Network Configuration Information screen appears.
Select Manual and press ENTER.
Select DHCP / Static address to configure the DHCP / Static address for the ESA and choose Edit.
Select Static address and choose Update.
If you want to change the hostname of the ESA, then perform the following steps.
- Select Hostname and select Edit.
- Change the hostname and select OK.
Select Management IP to configure the management IP address for the ESA and select Edit.
- Add the IP address assigned to the ethMNG interface. This IP address configures the ESA to use the Web UI.
- Enter the Netmask. The ethMNG interface must be connected to the LAN with this Netmask value.
- Select OK.
Select Default Route to configure the default route for the ESA and select Edit.
- Enter the IP address for the default network traffic.
- Select Apply.
Select Domain Name and select Edit.
- Enter the domain name. For example, protegrity.com.
- Select Apply.
Select Name Servers and select Edit.
- Add the IP address of the name server.
- Select OK.
To configure the NTP, then perform the following steps.
- Select Time Server (NTP), and press Edit.
- Add NTP time server on a TCP/IP network.
- Select Apply.
Select Apply.
The network settings are configured.
3. Configuring Time Zone
After you configure the network settings, the Time Zone screen appears.
To set the Time Zone:
On the Time Zone screen, select the time zone.
Select Next.
The time zone is configured.
4. Configuring the Nearest Location
After configuring the time zone, the Nearest Location screen appears.
To Set the Nearest Location:
On the Nearest Location screen, select the nearest location.
Select OK.The Initial Server Settings screen appears.This screen also allows you to update the default settings of date and time, keyboard manufacturer, keyboard model, and keyboard layout.
Edit the required settings. Select OK.
5. Updating the Date and Time
To Update the Date and Time:
Press SPACE and select Update date and time.
Press ENTER.
Select the date.
Select Set Date and press ENTER.
Set the time.
Click Set Time and press ENTER.
The date and time settings are configured.
6. Configuring GRUB Settings
On the ESA, GRUB version 2 (GRUB2) is used for loading the kernel. If you want to protect the boot configurations, then you can secure it by enforcing a username and password combination for the GRUB menu.
During installation for the ESA on-premise, a screen to configure GRUB credentials appears. If you want to protect the boot configurations, then you can secure it by enforcing a username and password combination for the GRUB menu. While installing the ESA, the GRUB menu can be secured by creating a username and setting password as described in the following task.
To configure GRUB settings:
From the GRUB Credentials page, press the SPACEBAR to select Enable.
By default the Disable is selected. If you continue to choose Disable, then the security for the GRUB menu is disabled. It is recommended to enable GRUB to secure the ESA.
You can enable this feature from the CLI Manager after the installation is completed. On the CLI Manager, navigate to Administration > GRUB Credential Settings to enable the GRUB settings.
For more information about GRUB, refer to the section Securing the GRand Unified Bootloader (GRUB).
Select OK.
Enter a username in the Username text box.
The requirements for the Username are as follows:
- It should contain a minimum of three and maximum of 16 characters.
- It should not contain numbers and special characters
Enter a password in the Password and Re-type Password text boxes.
The requirements for the Password are as follows:
- It must contain at least eight characters.
- It must contain a combination of alphabets, numbers, and printable characters.
Select OK and press ENTER.
A message
Credentials for the GRUB menu has been set successfullyappears.Select OK.
7. Setting up Users and Passwords
Only authorized users can access the ESA. The Protegrity Data Security Platform defines a list of roles for each user who can access the ESA. These are system users and LDAP administrative users who have specific roles and permissions. When you install the ESA, the default users configured are as follows:
- root: Super user with access to all commands and files.
- admin: User with administrative privileges to perform all operations.
- viewer: User who can view, but does not have edit permissions.
- local_admin: Local administrator that can be used when the admin user is not accessible.
After completing the server settings, the Users Passwords screen appears that allows you set the passwords for the users.
To set the LDAP user passwords:
Add the passwords of the users.
Ensure that the passwords for the users comply with the password polices.
For more information about the password policies, refer Password Policy Configuration
Select Apply.
The user passwords are set.
8. Licensing
After the ESA components are installed, the Temporary License screen appears. This screen takes time. It is recommended to wait for few minutes before proceeding.
After the ESA is installed, you must apply for a valid license within 30 days.
For more information about licenses, refer Licensing.
9. Installing Products
In the final steps of installing the ESA, select the components to install.
To select products to install:
Press space to select and install the required products.
Click OK.
The selected products are installed.After installation is completed, the
Welcome to Protegrity Appliancescreen appears.Select Continue to view the CLI Login screen.
1.5 - Configuring the ESA
Configuring authentication settings
User authentication is the process of identifying someone who wants to gain access to a resource. A server contains protected resources that are only accessible to authorized users. When accessing any resource on the server, the server uses different authentication mechanism to confirm the identity.
The authentication can be configured using any of the following methods.
Configuring accounts and passwords
The current password can be changed from the CLI Manager. The CLI Manager includes options to change passwords and permissions for multiple users.
For more information on configuring accounts and passwords, refer to section Accounts and Passwords Management.
Configuring Syslog
The Appliance Logs are available for Protegrity Appliances, such as, the ESA or the DSG. The Appliance Logs tool can be differentiated into appliance common logs and appliance-specific logs. Syslog is a log type that is common for all appliances.
For more information about configuring syslog, refer the section Working with Logs.
Configuring external certificates
External certificates or digital certificates are used to encrypt online communications securely between two entities over the Internet. It is a digitally signed statement that is used to assert the online identities of individuals, computers, and other entities on the network, utilizing the security applications of Public Key Infrastructure (PKI). Public Key Infrastructure (PKI) is the standard cryptographic system that is used to facilitate the secure exchange of information between entities.
For more information on configuring certificates, refer Uploading Certificate Revocation List.
Configuring SMTP
The Simple Mail Transfer Protocol (SMTP) setting allows the system to send emails. An email server can be set up that supports the notification features in Protegrity Reports.
To configure SMTP from Web UI:
Login to the ESA.
Navigate to Settings > Network.
Click the SMTP Settings tab.
The following screen appears.

For more information about configuring SMTP, refer Email Setup.
Configuring SNMP
Using Simple Network Management Protocol (SNMP), you can query the performance data.
By default, due to security reasons, the SNMP service is disabled. To enable the service and provide its basic configuration (listening address, community string) the SNMP tool available in the CLI Manager can be used.
To initialize SNMP configuration:
Login to the CLI Manager.
Navigate to Networking > SNMP Configuration.
Enter the root password to execute the SNMP configuration and click OK.
The following screen appears.

You can also start the SNMP Service from the Web UI. Navigate to System > Services to start the SNMP service.
For more information about configuring SNMP, refer Configuring SNMP.
1.6 - Configuring Load Balancer
Deploying ESAs on multiple sites
In case of a fault tolerance architecture, ESAs are deployed at multiple sites. To manage the protector requests towards ESA, ensure that a Layer-4 Proxy or Load Balancer or a DNS Switch is used.
1.7 - Verifying the ESA installation from the Web UI
To verify the ESA installation from the Web UI:
Login to the ESA Web UI.
The ESA dashboard appears.
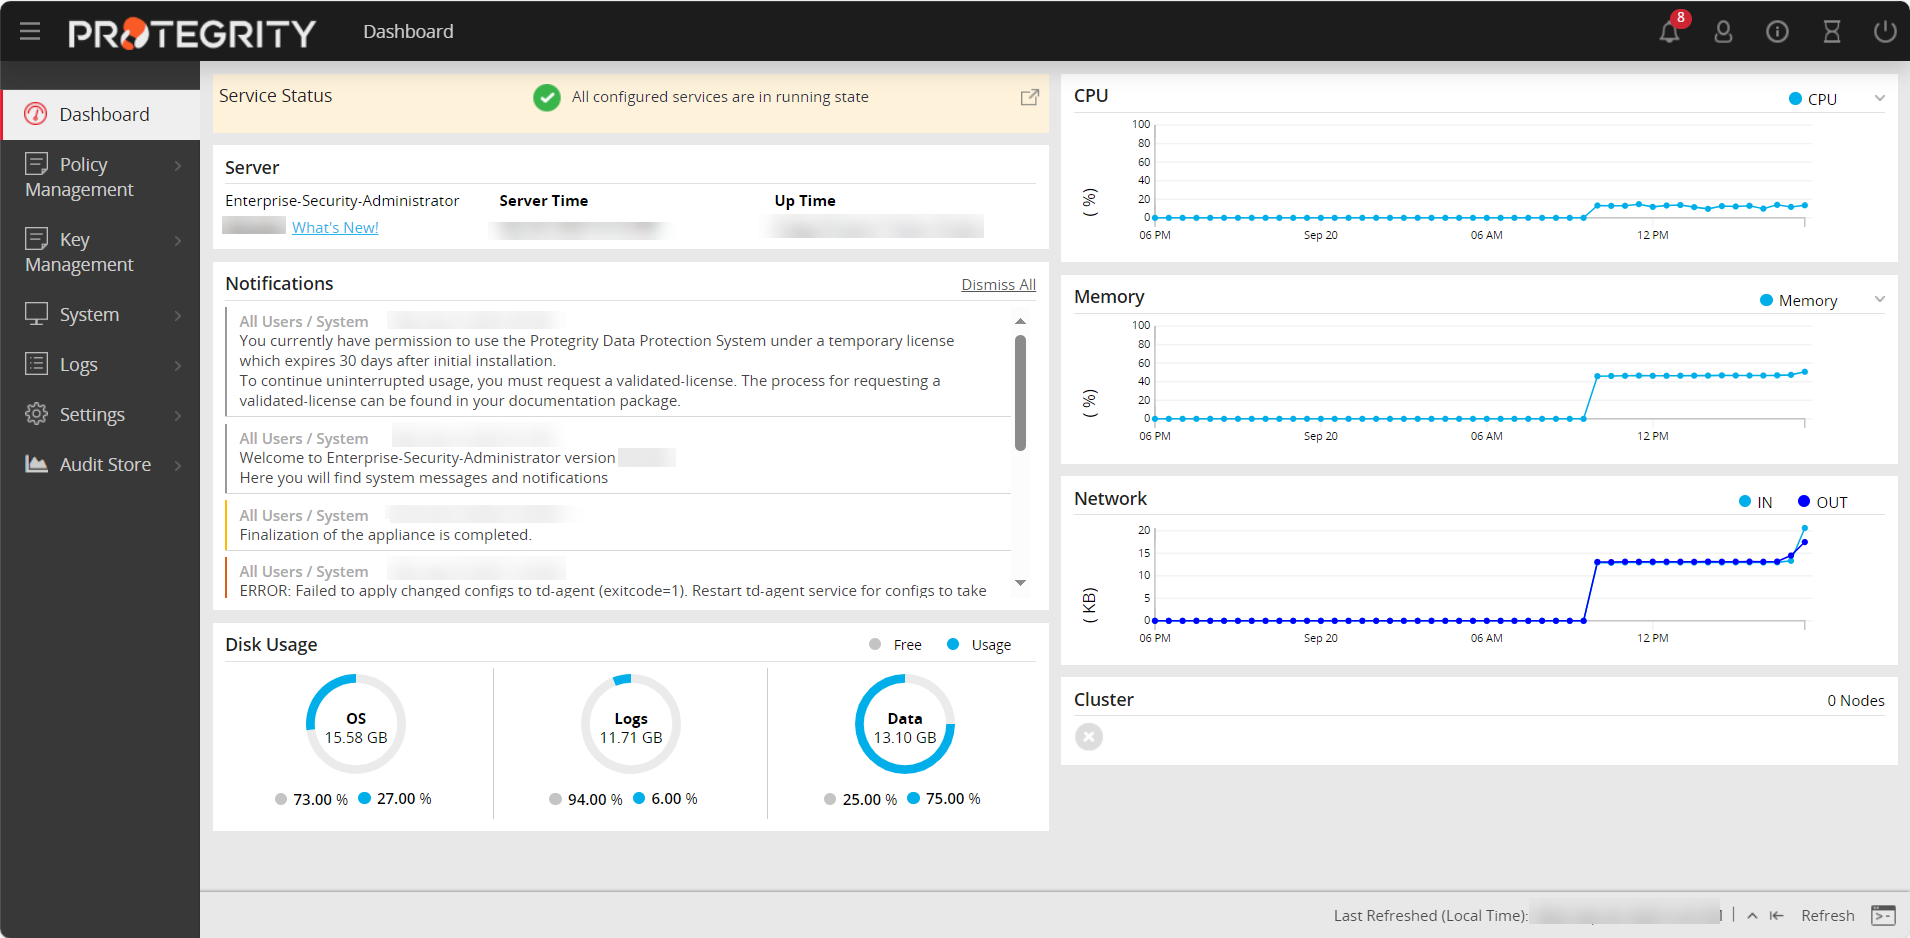
Navigate to System > Information.
The screen displaying the information of your system appears.
Under the Installed Patches area, the ESA_10.2.0 entry appears.
Navigate to System > Services and ensure that all the required services are running.
1.8 - Initializing the Policy Information Management (PIM) Module
To initialize the PIM module:
In a web browser, enter the ESA IP address in the window task bar.
Enter the Username and Password.
Click Sign in.
The ESA dashboard appears.
Navigate to Policy Management > Dashboard.
The following screen to initialize PIM appears.

Click Initialize PIM.
A confirmation message appears.
Click OK.
The Policy management screen appears.
1.9 - Configuring the ESA in a Trusted Appliances Cluster (TAC)
The following figure illustrates the TAC setup.

TAC is established between the primary ESA A and the secondary ESAs, ESA B and ESA C.
For more information about TAC, refer here.
Data replication for policies, forensics, or DSG configuration takes place between all the ESAs.
For more information about replication tasks, refer here.
The Audit Store cluster is enabled for the ESAs.
For more information about enabling Audit Store Cluster, refer here.
All the ESAs are added as a part of the Audit Store Cluster.
For more information about adding an ESA to the Audit Store Cluster, refer here.
1.10 - Creating an Audit Store Cluster
The Audit Store cluster is a collection of nodes that process and store data. The Audit Store is installed on the ESA nodes. The logs generated by the Appliance, such as, ESA or DSG, and Protector machines are stored in this Audit Store. The logs are useful for obtaining information about the nodes and the cluster on the whole. The logs can also be monitored for any data loss, system compromise, or any other issues with the nodes in the Audit Store cluster.
An Audit Store cluster must have a minimum of three nodes with the Master-eligible role due to following scenarios:
- 1 master-eligible node: If only one node with the Master-eligible role is available, then it is elected the Master, by default. In this case, if the node becomes unavailable due to some failure, then the cluster becomes unstable as there is no additional node with the Master-eligible role.
- 2 master-eligible nodes: A cluster where only two nodes have the Master-eligible role, then both have the Master-eligible role at the minimum to be up and running for the cluster to remain functional. If any one of those nodes becomes unavailable due to some failure, then the minimum condition for the nodes with the Master-eligible role is not met and cluster becomes unstable. This setup is not recommended for a multi-node cluster.
- 3 master-eligible nodes and above: In this case, if any one node goes down, then the cluster can still remain functional because the cluster requires a minimum of two nodes with the Master-eligible role.
Completing the Prerequisites
Ensure that the following prerequisites are met before configuring the Audit Store Cluster. Protegrity recommends that the Audit Store Cluster has a minimum of three ESAs for creating a highly-available multi-node Audit Store cluster.
Prepare and set up three ESAs.
Create the TAC on the first ESA. This will be the Primary ESA.
Add the remaining ESAs to the TAC. These will be the secondary ESAs in the TAC. For more information about installing the ESA, refer here.
Creating the Audit Store Cluster on the ESA
Initialize the Audit Store only on the first ESA or the Primary ESA in the TAC. This also configures Insight to retrieve data from the Audit Store. Additionally, the required processes, such as, td-agent, is started and Protegrity Analytics is initialized. The Audit Store cluster is initialized on the local machine so that other nodes can join this Audit Store cluster.
Perform the following steps to initialize the Audit Store.
Log in to the ESA Web UI.
Navigate to Audit Store > Initialize Analytics.
The following screen appears.

Click Initialize Analytics.
Protegrity Analytics is now configured and retrieves data for the reports from the Audit Store. The Index Lifecycle Management screen is displayed. The data is available on the Audit Store > Dashboard tab.

Verify that the following Audit Store services are running by navigating to System > Services:
- Audit Store Management
- Audit Store Repository
- Audit Store Dashboards
- Analytics
- td-agent
Adding an ESA to the Audit Store Cluster
Add multiple ESAs to the Audit Store cluster to increase the cluster size. In this case, the current ESA is added as a node in the Audit Store cluster. After the configurations are completed, the required processes are started and the logs are read from the Audit Store cluster.
The Audit Store cluster information is updated when a node joins the Audit Store cluster. This information is updated across the Audit Store cluster. Hence, nodes must be added to an Audit Store cluster one at a time. Adding multiple nodes to the Audit Store at the same time using the ESA Web UI would make the cluster information inconsistent, make the Audit Store cluster unstable, and would lead to errors.
Ensure that the following prerequisites are met:
- Ensure that the SSH Authentication type on all the ESAs is set to Password + PublicKey. For more information about setting the authentication, refer here.
- Ensure that the Audit Store cluster is initialized on the node that must be joined.
- The health status of the target Audit Store node is green or yellow.
- The health status of the Audit Store node that must be added to the cluster is green or yellow.
To check the health status of a node, log in to ESA Web UI of the node, click Audit Store > Cluster Management > Overview, and view the Cluster Status from the upper-right corner of the screen. For more information about the health status, refer here.
Log in to the Web UI of the second ESA.
Navigate to Audit Store > Initialize Analytics.
The following screen appears.
Click Join Cluster.
The following screen appears.

Specify the IP address or the hostname of the Audit Store cluster to join. Use hostname only if the hostname is resolved between the nodes.
Ensure that Protegrity Analytics is initialized and the Audit Store cluster is already created on the target node. A node cannot join the cluster if Protegrity Analytics is not initialized on the target node.
Specify the administrator username and password for the Audit Store cluster. If required, select the Clear cluster data check box to clear the Audit Store data from the current node before joining the Audit Store cluster. The check box will only be enabled if the node is a re-purposed ESA and has data, that is, if the Audit Store was earlier installed on the ESA.
Selecting this check box will delete the existing data on the re-purposed ESA before adding it to the Audit Store.
Click Join Cluster.
A confirmation message appears as shown in the following figure.

Click Dismiss.
The Index Lifecycle Management screen appears as shown in the following figure.
Repeat the steps to add the remaining ESAs as required. Add only one ESA at a time. After adding the ESA, wait till the cluster becomes stable. The cluster is stable when the cluster status indicator turns green.
Verifying the Audit Store Cluster
View the Audit Store Management page to verify that the configurations were completed successfully using the steps provided here.
Log in to the ESA Web UI.
Navigate to the Audit Store > Cluster Management > Overview page.
Verify that the nodes are added to the cluster. The health of the nodes must be green.

Updating the Priority IP List for Signature Verification
Signature verification jobs run on the ESA and use the ESA’s processing time. Update the priority IP list for the default signature verification jobs after setting up the system. By default, the primary ESA will be used for the priority IP. If there are multiple ESAs in the priority list, then additional ESAs are available to process the signature verifications jobs. This frees up the Primary ESA’s processor to handle other important tasks.
For example, if the maximum jobs to run on an ESA is set to 4 and 10 jobs are queued to run on 2 ESAs, then 4 jobs are started on the first ESA, 4 jobs are started on the second ESA, and 2 jobs will be queued to run till an ESA job slot is free to accept and run the queued job.
For more information about scheduling jobs, refer here.
For more information about signature verification jobs, refer here.
Use the steps provided in this section to update the priority IP list.
Log in to the ESA Web UI.
Navigate to Audit Store > Analytics > Scheduler.
From the Action column, click the Edit icon (
 ) for the Signature Verification task.
Update the Priority IPs filed with the list of the ESAs available separating the IPs using commas.
Click Save.
Enter the root password, to apply the updates.
2 - Configuration
2.1 - Sending logs to an external security information and event management (SIEM)
This is an optional step.
The following options are available for forwarding logs from the Protector:
- The default setup, that is, ESA.
- Sending logs to the ESA and a SIEM.
In addition to the ESA or the ESA and a SIEM, logs can be sent to the Amazon CloudWatch. For more information about configuring Amazon CloudWatch, refer to Working with CloudWatch Console.
In the default setup, the logs are sent from the protectors directly to the Audit Store on the ESA using the Log Forwarder on the protector.
For more information about the default flow, refer Logging architecture.
To forward logs to the ESA and the external SIEM, the td-agent is configured to listen for protector logs. The protectors are configured to send the logs to the td-agent on the ESA. Finally, the td-agent is configured to forward the logs to the required locations.
Ensure that the logs are sent to the ESA and the external SIEM using the steps provided in this section. The logs sent to the ESA are required by Protegrity support for troubleshooting the system in case of any issues.
An overview architecture diagram for sending logs to Insight and the external SIEM is shown in the following figure.

Forward the logs generated on the protector to Insight and the external SIEM using the following steps. Ensure that all the steps are completed in the order specified.
Set up td-agent to receive protector logs.
Send the protector logs to the td-agent.
Configure td-agent to forward logs to the external endpoint.
1. Setting up td-agent to receive protector logs
Configure the td-agent to listen to logs from the protectors and to forward the logs received to Insight.
To configure td-agent:
Add the port 24284 to the rule list on the ESA. This port is configured for the ESA to receives the protector logs over a secure connection.
For more information about adding rules, refer Adding a New Rule with the Predefined List of Functionality.
Log in to the CLI Manager of the Primary ESA.
Navigate to Networking > Network Firewall.
Enter the password for the root user.
Select Add New Rule and select Choose.
Select Accept and select Next.
Select Manually.
Select TCP and select Next.
Specify 24284 for the port and select Next.
Select Any and select Next.
Select Any and select Next.
Specify a description for the rule and select Confirm.
Select OK.
Open the OS Console on the Primary ESA.
Log in to the CLI Manager of the Primary ESA.
Navigate to Administration > OS Console.
Enter the root password and select OK.
Enable td-agent to receive logs from the protector.
Navigate to the config.d directory using the following command.
cd /opt/protegrity/td-agent/config.dEnable the INPUT_forward_external.conf file using the following command. Ensure that the certificates exist in the directory that is specified in the INPUT_forward_external.conf file. If an IP address or hostname is specified for the bind parameter in the file, then ensure that the certificates are updated to match the host name or IP address specified.
mv INPUT_forward_external.conf.disabled INPUT_forward_external.conf
Optional: Update the configuration settings to improve the SSL/TLS server configuration on the system.
Navigate to the config.d directory using the following command.
cd /opt/protegrity/td-agent/config.dOpen the INPUT_forward_external.conf file using a text editor.
Add the list of ciphers to the file. Update and use the ciphers that are required. Enter the entire line of code on a single line and retain the formatting of the file.
<source>
  @type forward
  bind <Hostname of the Primary ESA>
  port 24284
  <transport tls>
    ca_path           /mnt/ramdisk/certificates/mng/CA.pem
    cert_path         /mnt/ramdisk/certificates/mng/server.pem
    private_key_path  /mnt/ramdisk/certificates/mng/server.key
    ciphers "ALL:!aNULL:!eNULL:!SSLv2:!SSLv3:!DHE:!AES256-SHA:!CAMELLIA256-SHA:!AES128-SHA:!CAMELLIA128-SHA:!TLS_RSA_WITH_RC4_128_MD5:!TLS_RSA_WITH_RC4_128_SHA:!TLS_RSA_WITH_3DES_EDE_CBC_SHA:!TLS_DHE_RSA_WITH_3DES_EDE_CBC_SHA:!TLS_RSA_WITH_SEED_CBC_SHA:!TLS_DHE_RSA_WITH_SEED_CBC_SHA:!TLS_ECDHE_RSA_WITH_RC4_128_SHA:!TLS_ECDHE_RSA_WITH_3DES_EDE_CBC_SHA"
  </transport>
</source>
Save and close the file.
Restart the td-agent service.
Log in to the ESA Web UI.
Navigate to System > Services > Misc > td-agent.
Restart the td-agent service.
Repeat the steps on all the ESAs in the Audit Store cluster.
2. Sending the protector logs to the td-agent
Configure the protector to send the logs to the td-agent on the ESA or appliance. The td-agent forwards the logs received to Insight and the external location.
To configure the protector:
Log in and open a CLI on the protector machine.
Back up the existing files.
Navigate to the config.d directory using the following command.
cd /opt/protegrity/logforwarder/data/config.dBack up the existing out.conf file using the following command.
cp out.conf out.conf_backupBack up the existing upstream.cfg file using the following command.
cp upstream.cfg upstream.cfg_backup
Update the out.conf file for specifying the logs that must be forwarded to the ESA.
Navigate to the /opt/protegrity/logforwarder/data/config.d directory.
Open the out.conf file using a text editor.
Update the file contents with the following code.
Update the code blocks for all the options with the following information:
Update the Name parameter from opensearch to forward.
Delete the following Index, Type, and Time_Key parameters:
    Index pty_insight_audit
    Type  _doc
    Time_Key ingest_time_utc
Delete the Supress_Type_Name and Buffer_Size parameters:
    Suppress_Type_Name on
    Buffer_Size false
The updated extract of the code is shown here.
[OUTPUT]
 Name forward
 Match logdata
 Retry_Limit False
 Upstream /opt/protegrity/logforwarder/data/config.d/upstream.cfg
 storage.total_limit_size 256M
 net.max_worker_connections 1
 net.keepalive off
 Workers 1

[OUTPUT]
 Name forward
 Match flulog
 Retry_Limit no_retries
 Upstream /opt/protegrity/logforwarder/data/config.d/upstream.cfg
 storage.total_limit_size 256M
 net.max_worker_connections 1
 net.keepalive off
 Workers 1
Ensure that the file does not have any trailing spaces or line breaks at the end of the file.
Save and close the file.
Update the upstream.cfg file for forwarding the logs to the ESA.
Navigate to the /opt/protegrity/logforwarder/data/config.d directory.
Open the upstream.cfg file using a text editor.
Update the file contents with the following code.
Update the code blocks for all the nodes with the following information:
Update the Port to 24284.
Delete the Pipeline parameter:
Pipeline logs_pipeline
The updated extract of the code is shown here.
[UPSTREAM]
    Name       pty-insight-balancing

[NODE]
    Name       node-1
    Host       <IP address of the ESA>
    Port       24284
    tls        on
    tls.verify off
The code shows information updated for one node. For multiple nodes, update the information for all the nodes.
Ensure that there are no trailing spaces or line breaks at the end of the file.
If the IP address of the ESA is updated, then update the Host value in the upstream.cfg file.
Save and close the file.
Restart logforwarder on the protector using the following commands.
/opt/protegrity/logforwarder/bin/logforwarderctrl stop
/opt/protegrity/logforwarder/bin/logforwarderctrl start
If required, complete the configurations on the remaining protector machines.
Update the td-agent configuration to send logs to the external location.
Log in and open a CLI on the protector machine.
Back up the existing files.
Navigate to the config.d directory using the following command.
cd /opt/protegrity/fluent-bit/data/config.dBack up the existing out.conf file using the following command.
cp out.conf out.conf_backupBack up the existing upstream.cfg file using the following command.
cp upstream.cfg upstream.cfg_backup
Update the out.conf file for specifying the logs that must be forwarded to the ESA.
Navigate to the /opt/protegrity/fluent-bit/data/config.d directory.
Open the out.conf file using a text editor.
Update the file contents with the following code.
Update the code blocks for all the options with the following information:
Update the Name parameter from opensearch to forward.
Delete the following Index, Type, and Time_Key parameters:
    Index pty_insight_audit
    Type  _doc
    Time_Key ingest_time_utc
Delete the Supress_Type_Name parameter:
Suppress_Type_Name on
The updated extract of the code is shown here.
[OUTPUT]
    Name forward
    Match logdata
    Retry_Limit False
    Upstream /opt/protegrity/fluent-bit/data/config.d/upstream.cfg
    storage.total_limit_size 256M

[OUTPUT]
    Name forward
    Match flulog
    Retry_Limit 1
    Upstream /opt/protegrity/fluent-bit/data/config.d/upstream.cfg
    storage.total_limit_size 256M

[OUTPUT]
    Name forward
    Match errorlog
    Retry_Limit 1
    Upstream /opt/protegrity/fluent-bit/data/config.d/upstream.cfg
    storage.total_limit_size 256M
Ensure that the file does not have any trailing spaces or line breaks at the end of the file.
Save and close the file.
Update the upstream.cfg file for forwarding the logs to the ESA.
Navigate to the /opt/protegrity/fluent-bit/data/config.d directory.
Open the upstream.cfg file using a text editor.
Update the file contents with the following code.
Update the code blocks for all the nodes with the following information:
Update the Port to 24284.
Delete the Pipeline parameter:
Pipeline logs_pipeline
The updated extract of the code is shown here.
[UPSTREAM]
    Name       pty-insight-balancing

[NODE]
    Name       node-1
    Host       <IP address of the ESA>
    Port       24284
    tls        on
    tls.verify off
The code shows information updated for one node. For multiple nodes, update the information for all the nodes.
Ensure that there are no trailing spaces or line breaks at the end of the file.
If the IP address of the ESA is updated, then update the Host value in the upstream.cfg file.
Save and close the file.
Restart logforwarder on the protector using the following commands.
/opt/protegrity/fluent-bit/bin/logforwarderctrl stop
/opt/protegrity/fluent-bit/bin/logforwarderctrl start
If required, complete the configurations on the remaining protector machines.
Update the td-agent configuration to send logs to the external location.
Log in and open a CLI on the protector machine.
Back up the existing files.
Navigate to the config.d directory using the following command.
cd /opt/protegrity/fluent-bit/data/config.dBack up the existing out_elastic.conf file using the following command.
cp out_elastic.conf out_elastic.conf_backupBack up the existing upstream_es.cfg file using the following command.
cp upstream_es.cfg upstream_es.cfg_backup
Update the out_elastic.conf file for specifying the logs that must be forwarded to the ESA.
Navigate to the /opt/protegrity/fluent-bit/data/config.d directory.
Open the out_elastic.conf file using a text editor.
Update the file contents with the following code.
Update the code blocks for all the options with the following information:
Update the Name parameter from opensearch to forward.
Delete the following Index, Type, and Time_Key parameters:
    Index pty_insight_audit
    Type  _doc
    Time_Key ingest_time_utc
Delete the Supress_Type_Name parameter:
Suppress_Type_Name on
The updated extract of the code is shown here.
[OUTPUT]
    Name forward
    Match logdata
    Retry_Limit False
    Upstream /opt/protegrity/fluent-bit/data/config.d/upstream_es.cfg
    storage.total_limit_size 256M

[OUTPUT]
    Name forward
    Match flulog
    Retry_Limit 1
    Upstream /opt/protegrity/fluent-bit/data/config.d/upstream_es.cfg
    storage.total_limit_size 256M

[OUTPUT]
    Name forward
    Match errorlog
    Retry_Limit 1
    Upstream /opt/protegrity/fluent-bit/data/config.d/upstream_es.cfg
    storage.total_limit_size 256M
Ensure that the file does not have any trailing spaces or line breaks at the end of the file.
Save and close the file.
Update the upstream_es.cfg file for forwarding the logs to the ESA.
Navigate to the /opt/protegrity/fluent-bit/data/config.d directory.
Open the upstream_es.cfg file using a text editor.
Update the file contents with the following code.
Update the code blocks for all the nodes with the following information:
Update the Port to 24284.
Delete the Pipeline parameter:
Pipeline logs_pipeline
The updated extract of the code is shown here.
[UPSTREAM]
    Name       pty-insight-balancing

[NODE]
    Name       node-1
    Host       <IP address of the ESA>
    Port       24284
    tls        on
    tls.verify off
The code shows information updated for one node. For multiple nodes, update the information for all the nodes.
Ensure that there are no trailing spaces or line breaks at the end of the file.
If the IP address of the ESA is updated, then update the Host value in the upstream_es.cfg file.
Save and close the file.
Restart logforwarder on the protector using the following commands.
/opt/protegrity/fluent-bit/bin/logforwarderctrl stop
/opt/protegrity/fluent-bit/bin/logforwarderctrl start
If required, complete the configurations on the remaining protector machines.
Update the td-agent configuration to send logs to the external location.
3. Configuring td-agent to forward logs to the external endpoint
As per the setup and requirements, the logs forwarded can be formatted using the syslog-related fields and sent over TLS to the SIEM. Alternatively, send the logs without any formatting over a non-TLS connection to the SIEM, such as, syslog.
The ESA has logs generated by the appliances and the protectors connected to the ESA. Forward these logs to the syslog server and use the log data for further analysis as per requirements.
For a complete list of plugins for forwarding logs, refer to https://www.fluentd.org/plugins/all.
Before you begin: Ensure that the external syslog server is available and running.
The following options are available, select any one of the options based on the requirements:
Option 1: Forwarding Logs to a Syslog Server
To forward logs to the external SIEM:
Open the CLI Manager on the Primary ESA.
Log in to the CLI Manager of the Primary ESA where the td-agent was configured in Setting Up td-agent to Receive Protector Logs.
Navigate to Administration > OS Console.
Enter the root password and select OK.
Navigate to the /products/uploads directory using the following command.
cd /products/uploadsObtain the required plugins files using one of the following commands based on the setup.
If the appliance has Internet access, then run the following commands.
wget https://rubygems.org/downloads/syslog_protocol-0.9.2.gemwget https://rubygems.org/downloads/remote_syslog_sender-1.2.2.gemwget https://rubygems.org/downloads/fluent-plugin-remote_syslog-1.0.0.gemIf the appliance does not have Internet access, then complete the following steps.
- Download the following setup files from a system that has Internet and copy them to the appliance in the /products/uploads directory.
- Ensure that the files downloaded have the execute permission.
Prepare the required plugins files using the following commands.
Assign the required ownership permissions to the software using the following command.
chown td-agent *.gemAssign the required permissions to the software installed using the following command.
chmod -R 755 /opt/td-agent/lib/ruby/gems/3.2.0/Assign ownership of the .gem files to the td-agent user using the following command.
chown -R td-agent:plug /opt/td-agent/lib/ruby/gems/3.2.0/
Install the required plugins files using one of the following commands based on the setup.
If the appliance has Internet access, then run the following commands.
sudo -u td-agent /opt/td-agent/bin/fluent-gem install syslog_protocolsudo -u td-agent /opt/td-agent/bin/fluent-gem install remote_syslog_sendersudo -u td-agent /opt/td-agent/bin/fluent-gem install fluent-plugin-remote_syslogIf the appliance does not have Internet access, then run the following commands.
sudo -u td-agent /opt/td-agent/bin/fluent-gem install --local /products/uploads/syslog_protocol-0.9.2.gemsudo -u td-agent /opt/td-agent/bin/fluent-gem install install --local /products/uploads/remote_syslog_sender-1.2.2.gemsudo -u td-agent /opt/td-agent/bin/fluent-gem install --local /products/uploads/fluent-plugin-remote_syslog-1.0.0.gem
Update the configuration files using the following steps.
Navigate to the config.d directory using the following command.
cd /opt/protegrity/td-agent/config.dBack up the existing output file using the following command.
cp OUTPUT.conf OUTPUT.conf_backupOpen the OUTPUT.conf file using a text editor.
Update the following contents in the OUTPUT.conf file.
Update the match tag in the file to <match *.*.* logdata flulog>.
Add the following code in the match tag in the file:
  <store>
    @type relabel
    @label @syslog
  </store>
The final OUTPUT.conf file with the updated content is shown here:
<filter **>
  @type elasticsearch_genid
  # to avoid duplicate logs
  # https://github.com/uken/fluent-plugin-elasticsearch#generate-hash-id
  hash_id_key _id    # storing generated hash id key (default is _hash)
</filter>

<match *.*.* logdata flulog>
  @type copy

  <store>
      @type opensearch
      hosts <Hostname of the ESA>
      port 9200
      index_name pty_insight_audit
      type_name _doc
      pipeline logs_pipeline
      # adds new data - if the data already exists (based on its id), the op is skipped.
      # https://github.com/uken/fluent-plugin-elasticsearch#write_operation
      write_operation create
      # By default, all records inserted into Elasticsearch get a random _id. This option allows to use a field in the record as an identifier.
      # https://github.com/uken/fluent-plugin-elasticsearch#id_key
      id_key _id
      scheme https
      ssl_verify true
      ssl_version TLSv1_2
      ca_file /etc/ksa/certificates/plug/CA.pem
      client_cert /etc/ksa/certificates/plug/client.pem
      client_key /etc/ksa/certificates/plug/client.key
      request_timeout 300s # defaults to 5s https://github.com/uken/fluent-plugin-elasticsearch#request_timeout
      <buffer>
        @type file
        path /opt/protegrity/td-agent/es_buffer
        retry_forever true           # Set 'true' for infinite retry loops.
        flush_mode interval
        flush_interval 60s
        flush_thread_count 8  # parallelize outputs https://docs.fluentd.org/deployment/performance-tuning-single-process#use-flush_thread_count-parameter
        retry_type periodic
        retry_wait 10s
      </buffer>
  </store>

  <store>
      @type relabel
      @label @triggering_agent
  </store>

<store>
    @type relabel
    @label @syslog
  </store>
</match>
Ensure that there are no trailing spaces or line breaks at the end of the file.
Save and close the file.
Create and open the OUTPUT_syslog.conf file using a text editor.
Perform the steps from one of the following solution as per the requirement.
Solution 1: Forward all logs to the external syslog server:
Add the following contents to the OUTPUT_syslog.conf file.
<label @syslog>

    <filter *.*.* logdata flulog>
      @type record_transformer
      enable_ruby true
      <record>
        origin ${record["origin"]["time_utc"] = record["origin"]["time_utc"].is_a?(Integer) ? Time.at(record["origin"]["time_utc"]).utc.strftime("%Y-%m-%dT%H:%M:%S.%LZ") : record["origin"]["time_utc"] ;  record["origin"]}
      </record>
    </filter>

    <match *.*.* logdata flulog>
    @type copy
    <store>
        @type remote_syslog
        host <IP_of_the_syslog_server_host>
        port 514
        <format>
            @type json
        </format>
        protocol udp
        <buffer>
            @type file
            path /opt/protegrity/td-agent/syslog_tags_buffer
            retry_forever true # Set 'true' for infinite retry loops.
            flush_mode interval
            flush_interval 60s
            flush_thread_count 8 # parallelize outputs https://docs.fluentd.org/deployment/performance-tuning-single-process#use-flush_thread_count-parameter
            retry_type periodic
            retry_wait 10s
        </buffer>
        </store>
    </match>
</label>
Ensure that there are no trailing spaces or line breaks at the end of the file.
Solution 2: Forward only the protection logs to the external syslog server:
Add the following contents to the OUTPUT_syslog.conf file.
<label @syslog>

    <filter *.*.* logdata>
      @type record_transformer
      enable_ruby true
      <record>
        origin ${record["origin"]["time_utc"] = record["origin"]["time_utc"].is_a?(Integer) ? Time.at(record["origin"]["time_utc"]).utc.strftime("%Y-%m-%dT%H:%M:%S.%LZ") : record["origin"]["time_utc"] ;  record["origin"]}
      </record>
    </filter>

    <match logdata>
    @type copy
    <store>
        @type remote_syslog
        host <IP_of_the_syslog_server_host>
        port 514
        <format>
            @type json
        </format>
        protocol udp
        <buffer>
            @type file
            path /opt/protegrity/td-agent/syslog_tags_buffer
            retry_forever true # Set 'true' for infinite retry loops.
            flush_mode interval
            flush_interval 60s
            flush_thread_count 8 # parallelize outputs https://docs.fluentd.org/deployment/performance-tuning-single-process#use-flush_thread_count-parameter
            retry_type periodic
            retry_wait 10s
        </buffer>
        </store>
    </match>
</label>
Ensure that there are no trailing spaces or line breaks at the end of the file. Ensure that the <IP_of_the_syslog_server_host> is specified in the file.
To use a TCP connection, update the protocol to tcp. In addition, specify the port that is opened for TCP communication.
For more information about the formatting the output, navigate to https://docs.fluentd.org/configuration/format-section.
Save and close the file.
Update the permissions for the file using the following commands.
chown td-agent:td-agent OUTPUT_syslog.conf
chmod 700 OUTPUT_syslog.conf
Navigate to the config.d directory using the following command.
cd /opt/protegrity/td-agent/config.dBack up the existing output file using the following command.
cp OUTPUT.conf OUTPUT.conf_backupOpen the OUTPUT.conf file using a text editor.
Update the following contents in the OUTPUT.conf file.
Update the match tag in the file to <match *.*.* logdata flulog errorlog>.
Add the following code in the match tag in the file:
  <store>
    @type relabel
    @label @syslog
  </store>
The final OUTPUT.conf file with the updated content is shown here:
<filter **>
  @type elasticsearch_genid
  # to avoid duplicate logs
  # https://github.com/uken/fluent-plugin-elasticsearch#generate-hash-id
  hash_id_key _id    # storing generated hash id key (default is _hash)
</filter>

<match *.*.* logdata flulog errorlog>
  @type copy

  <store>
      @type opensearch
      hosts <Hostname of the ESA>
      port 9200
      index_name pty_insight_audit
      type_name _doc
      pipeline logs_pipeline
      # adds new data - if the data already exists (based on its id), the op is skipped.
      # https://github.com/uken/fluent-plugin-elasticsearch#write_operation
      write_operation create
      # By default, all records inserted into Elasticsearch get a random _id. This option allows to use a field in the record as an identifier.
      # https://github.com/uken/fluent-plugin-elasticsearch#id_key
      id_key _id
      scheme https
      ssl_verify true
      ssl_version TLSv1_2
      ca_file /etc/ksa/certificates/plug/CA.pem
      client_cert /etc/ksa/certificates/plug/client.pem
      client_key /etc/ksa/certificates/plug/client.key
      request_timeout 300s # defaults to 5s https://github.com/uken/fluent-plugin-elasticsearch#request_timeout
      <buffer>
        @type file
        path /opt/protegrity/td-agent/es_buffer
        retry_forever true           # Set 'true' for infinite retry loops.
        flush_mode interval
        flush_interval 60s
        flush_thread_count 8  # parallelize outputs https://docs.fluentd.org/deployment/performance-tuning-single-process#use-flush_thread_count-parameter
        retry_type periodic
        retry_wait 10s
      </buffer>
  </store>

  <store>
      @type relabel
      @label @triggering_agent
  </store>

<store>
    @type relabel
    @label @syslog
  </store>
</match>
Ensure that there are no trailing spaces or line breaks at the end of the file.
Save and close the file.
Create and open the OUTPUT_syslog.conf file using a text editor.
Perform the steps from one of the following solution as per the requirement.
Solution 1: Forward all logs to the external syslog server:
Add the following contents to the OUTPUT_syslog.conf file.
<label @syslog>

    <filter *.*.* logdata flulog errorlog>
      @type record_transformer
      enable_ruby true
      <record>
        origin ${record["origin"]["time_utc"] = record["origin"]["time_utc"].is_a?(Integer) ? Time.at(record["origin"]["time_utc"]).utc.strftime("%Y-%m-%dT%H:%M:%S.%LZ") : record["origin"]["time_utc"] ;  record["origin"]}
      </record>
    </filter>

    <match *.*.* logdata flulog errorlog>
    @type copy
    <store>
        @type remote_syslog
        host <IP_of_the_syslog_server_host>
        port 514
        <format>
            @type json
        </format>
        protocol udp
        <buffer>
            @type file
            path /opt/protegrity/td-agent/syslog_tags_buffer
            retry_forever true # Set 'true' for infinite retry loops.
            flush_mode interval
            flush_interval 60s
            flush_thread_count 8 # parallelize outputs https://docs.fluentd.org/deployment/performance-tuning-single-process#use-flush_thread_count-parameter
            retry_type periodic
            retry_wait 10s
        </buffer>
        </store>
    </match>
</label>
Ensure that there are no trailing spaces or line breaks at the end of the file.
Solution 2: Forward only the protection logs to the external syslog server:
Add the following contents to the OUTPUT_syslog.conf file.
<label @syslog>

    <filter *.*.* logdata>
      @type record_transformer
      enable_ruby true
      <record>
        origin ${record["origin"]["time_utc"] = record["origin"]["time_utc"].is_a?(Integer) ? Time.at(record["origin"]["time_utc"]).utc.strftime("%Y-%m-%dT%H:%M:%S.%LZ") : record["origin"]["time_utc"] ;  record["origin"]}
      </record>
    </filter>

    <match logdata>
    @type copy
    <store>
        @type remote_syslog
        host <IP_of_the_syslog_server_host>
        port 514
        <format>
            @type json
        </format>
        protocol udp
        <buffer>
            @type file
            path /opt/protegrity/td-agent/syslog_tags_buffer
            retry_forever true # Set 'true' for infinite retry loops.
            flush_mode interval
            flush_interval 60s
            flush_thread_count 8 # parallelize outputs https://docs.fluentd.org/deployment/performance-tuning-single-process#use-flush_thread_count-parameter
            retry_type periodic
            retry_wait 10s
        </buffer>
        </store>
    </match>
</label>
Ensure that there are no trailing spaces or line breaks at the end of the file. Ensure that the <IP_of_the_syslog_server_host> is specified in the file.
To use a TCP connection, update the protocol to tcp. In addition, specify the port that is opened for TCP communication.
For more information about the formatting the output, navigate to https://docs.fluentd.org/configuration/format-section.
Save and close the file.
Update the permissions for the file using the following commands.
chown td-agent:td-agent OUTPUT_syslog.conf
chmod 700 OUTPUT_syslog.conf
Restart the td-agent service.
Log in to the ESA Web UI.
Navigate to System > Services > Misc > td-agent,
Restart the td-agent service.
Repeat the steps on all the ESAs in the Audit Store cluster.
Check the status and restart the rsyslog server on the remote SIEM system using the following commands.
systemctl status rsyslog
systemctl restart rsyslog
The logs are now sent to Insight on the ESA and the external SIEM.
Option 2: Forwarding Logs to a Syslog Server Over TLS
To forward logs to the external SIEM:
Open the CLI Manager on the Primary ESA.
Log in to the CLI Manager of the Primary ESA where the td-agent was configured in Setting Up td-agent to Receive Protector Logs.
Navigate to Administration > OS Console.
Enter the root password and select OK.
Navigate to the /products/uploads directory using the following command.
cd /products/uploadsObtain the required plugin file using one of the following commands based on the setup.
If the appliance has Internet access, then run the following command.
wget https://rubygems.org/downloads/fluent-plugin-syslog-tls-2.0.0.gemIf the appliance does not have Internet access, then complete the following steps.
- Download the fluent-plugin-syslog-tls-2.0.0.gem set up file from a system that has Internet and copy it to the appliance in the /products/uploads directory.
- Ensure that the file downloaded has the execute permission.
Prepare the required plugin file using the following commands.
Assign the required ownership permissions to the installer using the following command.
chown td-agent *.gemAssign the required permissions to the software installation directory using the following command.
chmod -R 755 /opt/td-agent/lib/ruby/gems/3.2.0/Assign ownership of the software installation directory to the required users using the following command.
chown -R td-agent:plug /opt/td-agent/lib/ruby/gems/3.2.0/
Install the required plugin file using one of the following commands based on the setup.
If the appliance has Internet access, then run the following command.
sudo -u td-agent /opt/td-agent/bin/fluent-gem install fluent-plugin-syslog-tlsIf the appliance does not have Internet access, then run the following command.
sudo -u td-agent /opt/td-agent/bin/fluent-gem install --local /products/uploads/fluent-plugin-syslog-tls-2.0.0.gem
Copy the required certificates on the ESA or the appliance.
Log in to the ESA or the appliance and open the CLI Manager.
Create a directory for the certificates using the following command.
mkdir -p /opt/protegrity/td-agent/new_certsUpdate the ownership of the directory using the following command.
chown -R td-agent:plug /opt/protegrity/td-agent/new_certsLog in to the remote SIEM system.
Using a command prompt, navigate to the directory where the certificates are located. For example,
cd /etc/pki/tls/certs.Connect to the ESA or appliance using a file transfer manager. For example,
sftp root@ESA_IP.Copy the CA and client certificates to the /opt/Protegrity/td-agent/new_certs directory using the following command.
put CA.pem /opt/protegrity/td-agent/new_certs
put client.* /opt/protegrity/td-agent/new_certs
Update the permissions of the certificates using the following command.
chmod -r 744 /opt/protegrity/td-agent/new_certs/CA.pem
chmod -r 744 /opt/protegrity/td-agent/new_certs/client.pem
chmod -r 744 /opt/protegrity/td-agent/new_certs/client.key
Update the configuration files using the following steps.
Navigate to the config.d directory using the following command.
cd /opt/protegrity/td-agent/config.dBack up the existing output file using the following command.
cp OUTPUT.conf OUTPUT.conf_backupOpen the OUTPUT.conf file using a text editor.
Update the following contents in the OUTPUT.conf file.
Update the match tag in the file to <match *.*.* logdata flulog>.
Add the following code in the match tag in the file:
  <store>
    @type relabel
    @label @syslogtls
  </store>
The final OUTPUT.conf file with the updated content is shown here:
<filter **>
  @type elasticsearch_genid
  # to avoid duplicate logs
  # https://github.com/uken/fluent-plugin-elasticsearch#generate-hash-id
  hash_id_key _id    # storing generated hash id key (default is _hash)
</filter>

<match *.*.* logdata flulog>
  @type copy

  <store>
      @type opensearch
      hosts <Hostname of the ESA>
      port 9200
      index_name pty_insight_audit
      type_name _doc
      pipeline logs_pipeline
      # adds new data - if the data already exists (based on its id), the op is skipped.
      # https://github.com/uken/fluent-plugin-elasticsearch#write_operation
      write_operation create
      # By default, all records inserted into Elasticsearch get a random _id. This option allows to use a field in the record as an identifier.
      # https://github.com/uken/fluent-plugin-elasticsearch#id_key
      id_key _id
      scheme https
      ssl_verify true
      ssl_version TLSv1_2
      ca_file /etc/ksa/certificates/plug/CA.pem
      client_cert /etc/ksa/certificates/plug/client.pem
      client_key /etc/ksa/certificates/plug/client.key
      request_timeout 300s # defaults to 5s https://github.com/uken/fluent-plugin-elasticsearch#request_timeout
      <buffer>
        @type file
        path /opt/protegrity/td-agent/es_buffer
        retry_forever true           # Set 'true' for infinite retry loops.
        flush_mode interval
        flush_interval 60s
        flush_thread_count 8  # parallelize outputs https://docs.fluentd.org/deployment/performance-tuning-single-process#use-flush_thread_count-parameter
        retry_type periodic
        retry_wait 10s
      </buffer>
  </store>

  <store>
      @type relabel
      @label @triggering_agent
  </store>

<store>
    @type relabel
    @label @syslogtls
  </store>
</match>
Ensure that there are no trailing spaces or line breaks at the end of the file.
Save and close the file.
Create and open the OUTPUT_syslogTLS.conf file using a text editor.
Perform the steps from one of the following solution as per the requirement.
Solution 1: Forward all logs to the external syslog server:
Add the following contents to the OUTPUT_syslogTLS.conf file.
<label @syslogtls>

  <filter *.*.* logdata flulog>
      @type record_transformer
      enable_ruby true
      <record>
        origin ${record["origin"]["time_utc"] = record["origin"]["time_utc"].is_a?(Integer) ? Time.at(record["origin"]["time_utc"]).utc.strftime("%Y-%m-%dT%H:%M:%S.%LZ") : record["origin"]["time_utc"] ;  record["origin"]}
      </record>
  </filter>

  <filter *.*.* logdata flulog>
    @type record_transformer
    enable_ruby true
    <record>
    severity "${
          case record['level']
          when 'Error'
            'err'
          when 'ERROR'
            'err'
          else
            'info'
           end
         }"

    #local0 -Protection
    #local1 -Application
    #local2 -System
    #local3 -Kernel
    #local4 -Policy
    #local5 -User Defined
    #local6 -User Defined
    #local7 -Others
    #local5 and local6 can be defined as per the requirement

    facility "${
          case record['logtype']
          when 'Protection'
            'local0'
          when 'Application'
            'local1'
          when 'System'
             'local2'
          when 'Kernel'
             'local3'
          when 'Policy'
             'local4'
          else
             'local7'
          end
               }"

    #noHostName - can be changed by customer
    hostname ${record["origin"] ? (record["origin"]["hostname"] ? record["origin"]["hostname"] : "noHostName") : "noHostName" }
    </record>
  </filter>

  <match *.*.* logdata flulog>
    @type copy
    <store>
      @type syslog_tls
      host <IP_of_the_rsyslog_server_host>
      port 601
      client_cert /opt/protegrity/td-agent/new_certs/client.pem
      client_key /opt/protegrity/td-agent/new_certs/client.key
      ca_cert /opt/protegrity/td-agent/new_certs/CA.pem
      verify_cert_name true
      severity_key severity
      facility_key facility
      hostname_key hostname
      <format>
      @type json
      </format>
    </store>
  </match>
</label>
Ensure that there are no trailing spaces or line breaks at the end of the file.
Solution 2: Forward only the protection logs to the external syslog server:
Add the following contents to the OUTPUT_syslogTLS.conf file.
<label @syslogtls>

  <filter *.*.* logdata>
      @type record_transformer
      enable_ruby true
      <record>
        origin ${record["origin"]["time_utc"] = record["origin"]["time_utc"].is_a?(Integer) ? Time.at(record["origin"]["time_utc"]).utc.strftime("%Y-%m-%dT%H:%M:%S.%LZ") : record["origin"]["time_utc"] ;  record["origin"]}
      </record>
  </filter>

  <filter logdata>
    @type record_transformer
    enable_ruby true
    <record>
    severity "${
          case record['level']
          when 'Error'
            'err'
          when 'ERROR'
            'err'
          else
            'info'
           end
         }"

    #local0 -Protection
    #local1 -Application
    #local2 -System
    #local3 -Kernel
    #local4 -Policy
    #local5 -User Defined
    #local6 -User Defined
    #local7 -Others
    #local5 and local6 can be defined as per the requirement

    facility "${
          case record['logtype']
          when 'Protection'
            'local0'
          when 'Application'
            'local1'
          when 'System'
             'local2'
          when 'Kernel'
             'local3'
          when 'Policy'
             'local4'
          else
             'local7'
          end
               }"

    #noHostName - can be changed by customer
    hostname ${record["origin"] ? (record["origin"]["hostname"] ? record["origin"]["hostname"] : "noHostName") : "noHostName" }
    </record>
  </filter>

  <match logdata>
    @type copy
    <store>
      @type syslog_tls
      host <IP_of_the_rsyslog_server_host>
      port 601
      client_cert /opt/protegrity/td-agent/new_certs/client.pem
      client_key /opt/protegrity/td-agent/new_certs/client.key
      ca_cert /opt/protegrity/td-agent/new_certs/CA.pem
      verify_cert_name true
      severity_key severity
      facility_key facility
      hostname_key hostname
      <format>
      @type json
      </format>
    </store>
  </match>
</label>
Ensure that the <IP_of_the_rsyslog_server_host> is specified in the file.
For more information about the formatting the output, navigate to https://docs.fluentd.org/configuration/format-section.
The logs are formatted using the rfc 3164 format that is commonly used.
For more information about the rfc format, navigate to https://datatracker.ietf.org/doc/html/rfc3164.
Ensure that there are no trailing spaces or line breaks at the end of the file.
Save and close the file.
Update the permissions for the file using the following commands.
chown td-agent:td-agent OUTPUT_syslogTLS.conf
chmod 700 OUTPUT_syslogTLS.conf
Navigate to the config.d directory using the following command.
cd /opt/protegrity/td-agent/config.dBack up the existing output file using the following command.
cp OUTPUT.conf OUTPUT.conf_backupOpen the OUTPUT.conf file using a text editor.
Update the following contents in the OUTPUT.conf file.
Update the match tag in the file to <match *.*.* logdata flulog errorlog>.
Add the following code in the match tag in the file:
  <store>
    @type relabel
    @label @syslogtls
  </store>
The final OUTPUT.conf file with the updated content is shown here:
<filter **>
  @type elasticsearch_genid
  # to avoid duplicate logs
  # https://github.com/uken/fluent-plugin-elasticsearch#generate-hash-id
  hash_id_key _id    # storing generated hash id key (default is _hash)
</filter>

<match *.*.* logdata flulog errorlog>
  @type copy

  <store>
      @type opensearch
      hosts <Hostname of the ESA>
      port 9200
      index_name pty_insight_audit
      type_name _doc
      pipeline logs_pipeline
      # adds new data - if the data already exists (based on its id), the op is skipped.
      # https://github.com/uken/fluent-plugin-elasticsearch#write_operation
      write_operation create
      # By default, all records inserted into Elasticsearch get a random _id. This option allows to use a field in the record as an identifier.
      # https://github.com/uken/fluent-plugin-elasticsearch#id_key
      id_key _id
      scheme https
      ssl_verify true
      ssl_version TLSv1_2
      ca_file /etc/ksa/certificates/plug/CA.pem
      client_cert /etc/ksa/certificates/plug/client.pem
      client_key /etc/ksa/certificates/plug/client.key
      request_timeout 300s # defaults to 5s https://github.com/uken/fluent-plugin-elasticsearch#request_timeout
      <buffer>
        @type file
        path /opt/protegrity/td-agent/es_buffer
        retry_forever true           # Set 'true' for infinite retry loops.
        flush_mode interval
        flush_interval 60s
        flush_thread_count 8  # parallelize outputs https://docs.fluentd.org/deployment/performance-tuning-single-process#use-flush_thread_count-parameter
        retry_type periodic
        retry_wait 10s
      </buffer>
  </store>

  <store>
      @type relabel
      @label @triggering_agent
  </store>

<store>
    @type relabel
    @label @syslogtls
  </store>
</match>
Ensure that there are no trailing spaces or line breaks at the end of the file.
Save and close the file.
Create and open the OUTPUT_syslogTLS.conf file using a text editor.
Perform the steps from one of the following solution as per the requirement.
Solution 1: Forward all logs to the external syslog server:
Add the following contents to the OUTPUT_syslogTLS.conf file.
<label @syslogtls>

  <filter *.*.* logdata flulog errorlog>
      @type record_transformer
      enable_ruby true
      <record>
        origin ${record["origin"]["time_utc"] = record["origin"]["time_utc"].is_a?(Integer) ? Time.at(record["origin"]["time_utc"]).utc.strftime("%Y-%m-%dT%H:%M:%S.%LZ") : record["origin"]["time_utc"] ;  record["origin"]}
      </record>
  </filter>

  <filter *.*.* logdata flulog errorlog>
    @type record_transformer
    enable_ruby true
    <record>
    severity "${
          case record['level']
          when 'Error'
            'err'
          when 'ERROR'
            'err'
          else
            'info'
           end
         }"

    #local0 -Protection
    #local1 -Application
    #local2 -System
    #local3 -Kernel
    #local4 -Policy
    #local5 -User Defined
    #local6 -User Defined
    #local7 -Others
    #local5 and local6 can be defined as per the requirement

    facility "${
          case record['logtype']
          when 'Protection'
            'local0'
          when 'Application'
            'local1'
          when 'System'
             'local2'
          when 'Kernel'
             'local3'
          when 'Policy'
             'local4'
          else
             'local7'
          end
               }"

    #noHostName - can be changed by customer
    hostname ${record["origin"] ? (record["origin"]["hostname"] ? record["origin"]["hostname"] : "noHostName") : "noHostName" }
    </record>
  </filter>

  <match *.*.* logdata flulog errorlog>
    @type copy
    <store>
      @type syslog_tls
      host <IP_of_the_rsyslog_server_host>
      port 601
      client_cert /opt/protegrity/td-agent/new_certs/client.pem
      client_key /opt/protegrity/td-agent/new_certs/client.key
      ca_cert /opt/protegrity/td-agent/new_certs/CA.pem
      verify_cert_name true
      severity_key severity
      facility_key facility
      hostname_key hostname
      <format>
      @type json
      </format>
    </store>
  </match>
</label>
Ensure that there are no trailing spaces or line breaks at the end of the file.
Solution 2: Forward only the protection logs to the external syslog server:
Add the following contents to the OUTPUT_syslogTLS.conf file.
<label @syslogtls>

  <filter *.*.* logdata>
      @type record_transformer
      enable_ruby true
      <record>
        origin ${record["origin"]["time_utc"] = record["origin"]["time_utc"].is_a?(Integer) ? Time.at(record["origin"]["time_utc"]).utc.strftime("%Y-%m-%dT%H:%M:%S.%LZ") : record["origin"]["time_utc"] ;  record["origin"]}
      </record>
  </filter>

  <filter logdata>
    @type record_transformer
    enable_ruby true
    <record>
    severity "${
          case record['level']
          when 'Error'
            'err'
          when 'ERROR'
            'err'
          else
            'info'
           end
         }"

    #local0 -Protection
    #local1 -Application
    #local2 -System
    #local3 -Kernel
    #local4 -Policy
    #local5 -User Defined
    #local6 -User Defined
    #local7 -Others
    #local5 and local6 can be defined as per the requirement

    facility "${
          case record['logtype']
          when 'Protection'
            'local0'
          when 'Application'
            'local1'
          when 'System'
             'local2'
          when 'Kernel'
             'local3'
          when 'Policy'
             'local4'
          else
             'local7'
          end
               }"

    #noHostName - can be changed by customer
    hostname ${record["origin"] ? (record["origin"]["hostname"] ? record["origin"]["hostname"] : "noHostName") : "noHostName" }
    </record>
  </filter>

  <match logdata>
    @type copy
    <store>
      @type syslog_tls
      host <IP_of_the_rsyslog_server_host>
      port 601
      client_cert /opt/protegrity/td-agent/new_certs/client.pem
      client_key /opt/protegrity/td-agent/new_certs/client.key
      ca_cert /opt/protegrity/td-agent/new_certs/CA.pem
      verify_cert_name true
      severity_key severity
      facility_key facility
      hostname_key hostname
      <format>
      @type json
      </format>
    </store>
  </match>
</label>
Ensure that the <IP_of_the_rsyslog_server_host> is specified in the file.
For more information about the formatting the output, navigate to https://docs.fluentd.org/configuration/format-section.
The logs are formatted using the rfc 3164 format that is commonly used.
For more information about the rfc format, navigate to https://datatracker.ietf.org/doc/html/rfc3164.
Ensure that there are no trailing spaces or line breaks at the end of the file.
Save and close the file.
Update the permissions for the file using the following commands.
chown td-agent:td-agent OUTPUT_syslogTLS.conf
chmod 700 OUTPUT_syslogTLS.conf
Restart the td-agent service.
Log in to the ESA Web UI.
Navigate to System > Services > Misc > td-agent,
Restart the td-agent service.
Repeat the steps on all the ESAs in the Audit Store cluster.
Check the status and restart the rsyslog server on the remote SIEM system using the following commands.
```
systemctl status rsyslog
systemctl restart rsyslog
```
The logs are now sent to Insight on the ESA and the external SIEM over TLS.
2.2 - Configuring a Trusted Appliance Cluster (TAC) without Consul Integration
For more information about creating a TAC, refer to the section Trusted Appliances Cluster (TAC).
Note: If the node contains scheduled tasks associated with it, then you cannot uninstall the cluster services on it. Ensure that you delete all the scheduled tasks before uninstalling the cluster services.
Note: If you are uninstalling the Consul Integration services, then the Consul related ports and certificates are not required.
To uninstall cluster services, perform the following steps.
Remove the appliance from the TAC.
In the CLI Manager, navigate to Administration > Add/Remove Services.
Press ENTER.
Select Remove already installed applications.
Select Cluster-Consul-Integration v0.2 and select OK.
The integration service is uninstalled.
Select Consul v1.0 and select OK.
The Consul product is uninstalled from your appliance.
After the Consul Integration is successfully uninstalled, then the Cluster labels, such as, Consul-Client and Consul-Server are not available.
To manage the communication between various nodes in a TAC, you can use the communication blocking mechanism.
For more information about the communication blocking mechanism, refer to the section Connection Settings.
2.3 - Configuring the IP Address for the Docker Interface
From ESA v9.0.0.0, the default IP addresses assigned to the docker interfaces are between 172.17.0.0/16 and 172.18.0.0/16. If your have a VPN or your organization’s network configured with the IP addresses are between 172.17.0.0/16 and 172.18.0.0/16, then this might cause conflict with your organization’s private or internal network resulting in loss of network connectivity.
Note: Ensure that the IP addresses assigned to the docker interface must not conflict with the organization’s private or internal network.
To verify if there is any IP conflict between docker interface and organization’s private or internal network, run the following command to see the current IP range of the organization’s private or internal network.
ip addr show ethMNG
If the network’s subnet overlaps with Docker’s default range, a conflict exists.
In such a case you can reconfigure the IP addresses for the docker interface by performing the following steps.
To configure the IP address of the docker interfaces:
Remove docker_gwbridge network using the following command.
docker network rm docker_gwbridgeIn the /etc/docker/daemon.json file, enter the non-conflicting IP address range.
Note:
You must separate the entries in the daemon.json file using a comma (,). Before adding new entries, ensure that the existing entries are separated by a comma (,). Also, ensure that the entries are enlisted in the correct as shown in the following example .
"bip": "10.200.0.1/24",
"default-address-pools":
[
  {"base":"10.201.0.0/16","size":24}
]
Warning:
If the the entries in the file are not mentioned in the format specified in step 3, then the restart operation for docker service fails.
Restart the docker service using the following command.
/etc/init.d/docker restartThe docker service is restarted successfully.
Check the status of the docker service using the following command.
/etc/init.d/docker statusVerify the updated IP for the docker service using the following command.
ip addr show docker0The IP address of the docker interfaces are changed successfully.
2.4 - Configuring ESA features
2.4.1 - Rotating Insight certificates
These steps are only applicable for the system-generated Protegrity certificate and keys. It is recommended to upload and update custom certificates on the ESA. For updating custom certificates, refer here.
If the ESA Protegrity certificates are rotated, then the Audit Store certificates must be rotated.
Log in to the ESA Web UI.
Navigate to System > Services > Misc.
Stop the Audit Store Dashboards service.
Stop the td-agent service. Skip this step if Analytics is not initialized.
Navigate to System > Services > Analytics.
Stop the Insight_nginx service.
Stop the Analytics service.
Navigate to System > Services > Audit Store.
Stop the Audit Store Management service.
Stop the Audit Store Repository service.
Run the Rotate Audit Store Certificates tool on the system.
In the ESA Web UI, click the Terminal Icon in lower-right corner to navigate to the ESA CLI Manager.
From the ESA CLI Manager, navigate to Tools > Rotate Audit Store Certificates.
Enter the root password and select OK.
Enter the admin username and password and select OK.
Enter the IP of the local system in the Target Audit Store Address field and select OK to rotate the certificates.
After the rotation is complete select OK.
The CLI screen appears.
From the ESA Web UI, navigate to System > Services > Audit Store.
Start the Audit Store Repository service.
Start the Audit Store Management service.
Navigate to Audit Store > Cluster Management and confirm that the cluster is functional and the cluster status is yellow.
Navigate to System > Services > Analytics.
Start the Analytics service.
Start the Insight_nginx service.
Navigate to System > Services > Misc.
Start the td-agent service. Skip this step if Analytics is not initialized.
Start the Audit Store Dashboards service.
On a multi-node Audit Store cluster, the certificate rotation must be performed on every node in the cluster. First, rotate the certificates on a Lead node, which is the Primary ESA, and then use the IP address of this Lead node while rotating the certificates on the remaining nodes in the cluster. The services mentioned in this section must be stopped on all the nodes, preferably at the same time with minimum delay during certificate rotation. After certificate rotation, the services that were stopped must be started again on the nodes in the reverse order.
Log in to the ESA Web UI.
Stop the required services.
Navigate to System > Services > Misc.
Stop the Audit Store Dashboards service. This step must be performed on all the other nodes followed by the Lead node.
Stop the td-agent service. This step must be performed on all the other nodes followed by the Lead node. Skip this step if Analytics is not initialized.
On the ESA Web UI, navigate to System > Services > Analytics.
Stop the Insight_nginx service. This step must be performed on all the other nodes followed by the Lead node.
Stop the Analytics service. This step must be performed on all the other nodes followed by the Lead node.
Navigate to System > Services > Audit Store.
Stop the Audit Store Management service. This step must be performed on all the other nodes followed by the Lead node.
Stop the Audit Store Repository service.
Attention: This is a very important step and must be performed on all the other nodes followed by the Lead node without any delay. A delay in stopping the service on the nodes will result in that node receiving logs. This will lead to inconsistency in the logs across nodes and logs might be lost.
Run the Rotate Audit Store Certificates tool on the Lead node.
In the ESA Web UI, click the Terminal Icon in lower-right corner to navigate to the ESA CLI Manager.
From the ESA CLI Manager of the Lead node, that is the primary ESA, navigate to Tools > Rotate Audit Store Certificates.
Enter the root password and select OK.
Enter the admin username and password and select OK.
Enter the Ip of the local machine in the Target Audit Store Address field and select OK.
After the rotation is completed without errors, the following screen appears. Select OK to go to the CLI menu screen.
The CLI screen appears.
Run the Rotate Audit Store Certificates tool on all the remaining nodes in the Audit Store cluster one node at a time.
In the ESA Web UI, click the Terminal Icon in lower-right corner to navigate to the ESA CLI Manager.
From the ESA CLI Manager of a node in the cluster, navigate to Tools > Rotate Audit Store Certificates.
Enter the root password and select OK.
Enter the admin username and password and select OK.
Enter the IP address of the Lead node in Target Audit Store Address and select OK.
Enter the admin username and password for the Lead node and select OK.
After the rotation is completed without errors, the following screen appears. Select OK to go to the CLI menu screen.
The CLI screen appears.
Start the required services.
From the ESA Web UI, navigate to System > Services > Audit Store.
Start the Audit Store Repository service.
Attention: This step must be performed on the Lead node followed by all the other nodes without any delay. A delay in starting the services on the nodes will result in that node receiving logs. This will lead to inconsistency in the logs across nodes and logs might be lost.
Start the Audit Store Management service. This step must be performed on the Lead node followed by all the other nodes.
Navigate to Audit Store > Cluster Management and confirm that the Audit Store cluster is functional and the Audit Store cluster status is green.
Navigate to System > Services > Analytics.
Start the Analytics service. This step must be performed on the Lead node followed by all the other nodes.
Start the Insight_nginx service. This step must be performed on the Lead node followed by all the other nodes.
Navigate to System > Services > Misc.
Start the td-agent service. This step must be performed on the Lead node followed by all the other nodes. Skip this step if Analytics is not initialized.
Start the Audit Store Dashboards service. This step must be performed on the Lead node followed by all the other nodes.
The following figure shows all services that are started.
Verify that the Audit Store cluster is stable.
On the ESA Web UI, navigate to Audit Store > Cluster Management.
Verify that the nodes are still a part of the Audit Store cluster.

2.4.2 - Updating the IP address of the ESA
Perform the steps on one system at a time if multiple ESAs must be updated.
Updating the IP address on the Primary ESA
Update the ESA configuration of the Primary ESA. This is the designated ESA that is used to log in for performing all configurations. It is also the ESA that is used to create and deploy policies.
Perform the following steps to refresh the configurations:
Recreate the Docker containers using the following steps.
Open the OS Console on the Primary ESA.
- Log in to the CLI Manager on the Primary ESA.
- Navigate to Administration > OS Console.
- Enter the root password.
Stop the containers using the following commands.
/etc/init.d/asrepository stop
/etc/init.d/asdashboards stop
Remove the containers using the following commands.
/etc/init.d/asrepository remove
/etc/init.d/asdashboards remove
Update the IP address in the config.yml configuration file.
In the OS Console, navigate to the /opt/protegrity/auditstore/config/security directory.
cd /opt/protegrity/auditstore/config/securityOpen the config.yml file using a text editor.
Locate the internalProxies: attribute and update the IP address value for the ESA.
Save and close the file.
Start the containers using the following commands.
/etc/init.d/asrepository start
/etc/init.d/asdashboards start
Update the IP address in the asd_api_config.json configuration file.
In the OS Console, navigate to the /opt/protegrity/insight/analytics/config directory.
cd /opt/protegrity/insight/analytics/configOpen the asd_api_config.json file using a text editor.
Locate the x_forwarded_for attribute and update the IP address value for the ESA.
Save and close the file.
Apply security configurations. This step should be performed only once from any node, after all updates have been applied to all nodes in the cluster.
Open the ESA CLI.
Navigate to Tools.
Run Apply Audit Store Security Configs.
Monitor the cluster status.
Log in to the Web UI of the Primary ESA.
Navigate to Audit Store > Cluster Management.
Wait till the following updates are visible on the Overview page.
- The IP address of the Primary ESA is updated.
- All the nodes are visible in the cluster.
- The health of the cluster is green.
Alternatively, monitor the log files for any errors by logging into the ESA Web UI, navigating to Logs > Appliance, and selecting the following files from the Enterprise-Security-Administrator - Event Logs list:
- insight_analytics
- asmanagement
- asrepository
Updating the IP Address on the Secondary ESA
Ensure that the IP address of the ESA has been updated. Perform the steps on one system at a time if multiple ESAs must be updated.
Perform the following steps to refresh the configurations:
Recreate the Docker containers using the following steps.
Open the OS Console on the Secondary ESA.
- Log in to the CLI Manager on the Secondary ESA.
- Navigate to Administration > OS Console.
- Enter the root password.
Stop the containers using the following commands.
/etc/init.d/asrepository stop
/etc/init.d/asdashboards stop
Remove the containers using the following commands.
/etc/init.d/asrepository remove
/etc/init.d/asdashboards remove
Update the IP address in the config.yml configuration file.
In the OS Console, navigate to the /opt/protegrity/auditstore/config/security directory.
cd /opt/protegrity/auditstore/config/securityOpen the config.yml file using a text editor.
Locate the internalProxies: attribute and update the IP address value for the ESA.
Save and close the file.
Start the containers using the following commands.
/etc/init.d/asrepository start
/etc/init.d/asdashboards start
Update the IP address in the asd_api_config.json configuration file.
In the OS Console, navigate to the /opt/protegrity/insight/analytics/config directory.
cd /opt/protegrity/insight/analytics/configOpen the asd_api_config.json file using a text editor.
Locate the x_forwarded_for attribute and update the IP address value for the ESA.
Save and close the file.
Apply security configurations. This step should be performed only once from any node, after all updates have been applied to all nodes in the cluster.
Open the ESA CLI.
Navigate to Tools.
Run Apply Audit Store Security Configs.
Monitor the cluster status.
Log in to the Web UI of the Primary ESA.
Navigate to Audit Store > Cluster Management.
Wait till the following updates are visible on the Overview page.
- The IP address of the Secondary ESA is updated.
- All the nodes are visible in the cluster.
- The health of the cluster is green.
Alternatively, monitor the log files for any errors by logging into the ESA Web UI, navigating to Logs > Appliance, and selecting the following files from the Enterprise-Security-Administrator - Event Logs list:
- insight_analytics
- asmanagement
- asrepository
2.4.3 - Updating the domain name of the ESA
Updating the domain name on the Primary ESA
Update the configurations of the Primary ESA. This is the designated ESA that is used to log in for performing all configurations. It is also the ESA that is used to create and deploy policies.
Ensure that the domain name of the ESA has been updated.In the hostname field, if special characters are to be used, then only hyphen (-) is supported.
Perform the steps on one system at a time if multiple ESAs must be updated.
Perform the following steps to refresh the configurations:
Update the domain name in the configuration files.
Open the OS Console on the Primary ESA.
- Log in to the CLI Manager on the Primary ESA.
- Navigate to Administration > OS Console.
- Enter the root password.
Update the repository.json file for the Audit Store configuration.
Navigate to the /opt/protegrity/auditstore/management/config directory.
cd /opt/protegrity/auditstore/management/configOpen the repository.json file using a text editor.
Locate and update the hosts attribute with the new domain name as shown in the following example.
"hosts": [
    "protegrity-esa123.protegrity.com"
  ]
Save and close the file.
Update the repository.json file for the Analytics configuration.
Navigate to the /opt/protegrity/insight/analytics/config directory.
cd /opt/protegrity/insight/analytics/configOpen the repository.json file using a text editor.
Locate and update the hosts attribute with the new domain name as shown in the following example.
"hosts": [
    "protegrity-esa123.protegrity.com"
  ]
Save and close the file.
Update the opensearch.yml file for the Audit Store configuration.
Navigate to the /opt/protegrity/auditstore/config directory.
cd /opt/protegrity/auditstore/configOpen the opensearch.yml file using a text editor.
Locate and update the network.host and the http.host attributes with the new domain name as shown in the following example. If required, uncomment the line by deleting the number sign (#) character at the start of the line.
...
<existing code>
...
network.host:
- protegrity-esa123.protegrity.com
...
<existing code>
...
http.host:
- protegrity-esa123.protegrity.com
Save and close the file.
Update the opensearch_dashboards.yml file for the Audit Store Dashboards configuration.
Navigate to the /opt/protegrity/auditstore_dashboards/config directory.
cd /opt/protegrity/auditstore_dashboards/configOpen the opensearch_dashboards.yml file using a text editor.
Locate and update the opensearch.hosts attribute with the new domain name as shown in the following example.
opensearch.hosts: [ "https://protegrity-esa123.protegrity.com:9201" ]Save and close the file.
Update the OUTPUT.conf file for the td-agent configuration.
Navigate to the /opt/protegrity/td-agent/config.d directory.
cd /opt/protegrity/td-agent/config.dOpen the OUTPUT.conf file using a text editor.
Locate and update the hosts attribute with the new domain name as shown in the following example.
hosts protegrity-esa123.protegrity.comSave and close the file.
Update the INPUT_forward_external.conf file for the external SIEM configuration. This step is required only if an external SIEM is used.
Navigate to the /opt/protegrity/td-agent/config.d directory.
cd /opt/protegrity/td-agent/config.dOpen the INPUT_forward_external.conf file using a text editor.
Locate and update the bind attribute with the new domain name as shown in the following example.
bind protegrity-esa123.protegrity.comSave and close the file.
Recreate the Docker containers using the following steps.
Open the OS Console on the Primary ESA, if it is not opened.
- Log in to the CLI Manager on the Primary ESA.
- Navigate to Administration > OS Console.
- Enter the root password.
Stop the containers using the following commands.
/etc/init.d/asrepository stop
/etc/init.d/asdashboards stop
Remove the containers using the following commands.
/etc/init.d/asrepository remove
/etc/init.d/asdashboards remove
Start the containers using the following commands.
/etc/init.d/asrepository start
/etc/init.d/asdashboards start
Rotate the Audit Store certificates on the Primary ESA. Use the IP address of the local node, which is the Primary ESA and the Lead node, while rotating the certificates.
For the steps to rotate Audit Store certificates, refer here.
Update the unicast_hosts.txt file for the Audit Store configuration.
Open the OS Console on the Primary ESA.
Navigate to the /opt/protegrity/auditstore/config directory using the following command.
cd /opt/protegrity/auditstore/configOpen the unicast_hosts.txt file using a text editor.
Locate and update the domain name.
protegrity-esa123
protegrity-esa123.protegrity.com
Save and close the file.
Monitor the cluster status.
Log in to the Web UI of the Primary ESA.
Navigate to Audit Store > Cluster Management.
Wait till the following updates are visible on the Overview page.
- The IP address of the Primary ESA is updated.
- All the nodes are visible in the cluster.
- The health of the cluster is green.
It is possible to monitor the log files for any errors by logging into the ESA Web UI, navigating to Logs > Appliance, and selecting the following files from the Enterprise-Security-Administrator - Event Logs list:
- insight_analytics
- asmanagement
- asrepository
Updating the domain name on the Secondary ESA
Update the configurations of the Secondary ESA after the domain name of the ESA has been updated.
Perform the steps on one system at a time if multiple ESAs must be updated.
Perform the following steps to refresh the configurations:
Update the domain name in the configuration files.
Open the OS Console on the Secondary ESA.
- Log in to the CLI Manager on the Secondary ESA.
- Navigate to Administration > OS Console.
- Enter the root password.
Update the repository.json file for the Audit Store configuration.
Navigate to the /opt/protegrity/auditstore/management/config directory.
cd /opt/protegrity/auditstore/management/configOpen the repository.json file using a text editor.
Locate and update the hosts attribute with the new domain name as shown in the following example.
"hosts": [
    "protegrity-esa456.protegrity.com"
  ]
Save and close the file.
Update the repository.json file for the Analytics configuration.
Navigate to the /opt/protegrity/insight/analytics/config directory.
cd /opt/protegrity/insight/analytics/configOpen the repository.json file using a text editor.
Locate and update the hosts attribute with the new domain name as shown in the following example.
"hosts": [
    "protegrity-esa456.protegrity.com"
  ]
Save and close the file.
Update the opensearch.yml file for the Audit Store configuration.
Navigate to the /opt/protegrity/auditstore/config directory.
cd /opt/protegrity/auditstore/configOpen the opensearch.yml file using a text editor.
Locate and update the network.host and the http.host attributes with the new domain name as shown in the following example. If required, uncomment the line by deleting the number sign (#) character at the start of the line.
...
<existing code>
...
network.host:
- protegrity-esa456.protegrity.com
...
<existing code>
...
http.host:
- protegrity-esa456.protegrity.com
Save and close the file.
Update the opensearch_dashboards.yml file for the Audit Store Dashboards configuration.
Navigate to the /opt/protegrity/auditstore_dashboards/config directory.
cd /opt/protegrity/auditstore_dashboards/configOpen the opensearch_dashboards.yml file using a text editor.
Locate and update the opensearch.hosts attribute with the new domain name as shown in the following example.
opensearch.hosts: [ "https://protegrity-esa456.protegrity.com:9201" ]Save and close the file.
Update the OUTPUT.conf file for the td-agent configuration.
Navigate to the /opt/protegrity/td-agent/config.d directory.
cd /opt/protegrity/td-agent/config.dOpen the OUTPUT.conf file using a text editor.
Locate and update the hosts attribute with the new domain name as shown in the following example.
hosts protegrity-esa456.protegrity.comSave and close the file.
Update the INPUT_forward_external.conf file for the external SIEM configuration. This step is required only if an external SIEM is used.
Navigate to the /opt/protegrity/td-agent/config.d directory.
cd /opt/protegrity/td-agent/config.dOpen the INPUT_forward_external.conf file using a text editor.
Locate and update the bind attribute with the new domain name as shown in the following example.
bind protegrity-esa456.protegrity.comSave and close the file.
Recreate the Docker containers using the following steps.
Open the OS Console on the Secondary ESA, if it is not opened.
- Log in to the CLI Manager on the Secondary ESA.
- Navigate to Administration > OS Console.
- Enter the root password.
Stop the containers using the following commands.
/etc/init.d/asrepository stop
/etc/init.d/asdashboards stop
Remove the containers using the following commands.
/etc/init.d/asrepository remove
/etc/init.d/asdashboards remove
Start the containers using the following commands.
/etc/init.d/asrepository start
/etc/init.d/asdashboards start
Rotate the Audit Store certificates on the Secondary ESA. Perform the steps on the Secondary ESA using the IP address of the Primary ESA, which is the Lead node, for rotating the certificates.
For the steps to rotate Audit Store certificates, refer here.
Update the unicast_hosts.txt file for the Audit Store configuration.
Open the OS Console on the Primary ESA.
Navigate to the /opt/protegrity/auditstore/config directory using the following command.
cd /opt/protegrity/auditstore/configOpen the unicast_hosts.txt file using a text editor.
Locate and update the domain name.
protegrity-esa456
protegrity-esa456.protegrity.com
Save and close the file.
Monitor the cluster status.
Log in to the Web UI of the Primary ESA.
Navigate to Audit Store > Cluster Management.
Wait till the following updates are visible on the Overview page.
- The IP address of the Secondary ESA is updated.
- All the nodes are visible in the cluster.
- The health of the cluster is green.
Monitor the log files for any errors by logging into the ESA Web UI, navigating to Logs > Appliance, and selecting the following files from the Enterprise-Security-Administrator - Event Logs list:
- insight_analytics
- asmanagement
- asrepository
2.4.4 - Updating the hostname of the ESA
Updating the hostname on the Primary ESA
Update the configurations of the Primary ESA. This is the designated ESA that is used to log in for performing all configurations. It is also the ESA that is used to create and deploy policies.
Ensure that the hostname of the ESA has been updated.In the hostname field, if special characters are to be used, then only hyphen (-) is supported.
Perform the steps on one system at a time if multiple ESAs must be updated.
Perform the following steps to refresh the configurations:
Rotate the Audit Store certificates on the Primary ESA. Use the IP address of the local node, which is the Primary ESA and the Lead node, while rotating the certificates.
For the steps to rotate Audit Store certificates, refer here.
Monitor the cluster status.
Log in to the Web UI of the Primary ESA.
Navigate to Audit Store > Cluster Management.
Wait till the following updates are visible on the Overview page.
- The IP address of the Primary ESA is updated.
- All the nodes are visible in the cluster.
- The health of the cluster is green.
It is possible to monitor the log files for any errors by logging into the ESA Web UI, navigating to Logs > Appliance, and selecting the following files from the Enterprise-Security-Administrator - Event Logs list:
- insight_analytics
- asmanagement
- asrepository
Updating the hostname on the Secondary ESA
Update the configurations of the Secondary ESA after the hostname of the ESA has been updated.
Perform the steps on one system at a time if multiple ESAs must be updated.
Perform the following steps to refresh the configurations:
Rotate the Audit Store certificates on the Secondary ESA. Perform the steps on the Secondary ESA using the IP address of the Primary ESA, which is the Lead node, for rotating the certificates.
For the steps to rotate Audit Store certificates, refer here.
Monitor the cluster status.
Log in to the Web UI of the Primary ESA.
Navigate to Audit Store > Cluster Management.
Wait till the following updates are visible on the Overview page.
- The IP address of the Secondary ESA is updated.
- All the nodes are visible in the cluster.
- The health of the cluster is green.
Monitor the log files for any errors by logging into the ESA Web UI, navigating to Logs > Appliance, and selecting the following files from the Enterprise-Security-Administrator - Event Logs list:
- insight_analytics
- asmanagement
- asrepository
2.4.5 - Updating Insight custom certificates
These steps are only applicable for custom certificate and keys. For rotating Protegrity certificates, refer here.
For more information about Insight certificates, refer here.
Update custom certificates on the Audit Store cluster that has a single node in the cluster using the steps provided in Using custom certificates in Insight.
On a multi-node Audit Store cluster, the certificate rotation must be performed on every node in the cluster. First, update the certificates on a Lead node, which is the Primary ESA, and then use the IP address of this Lead node while rotating the certificates on the remaining nodes in the cluster. The services mentioned in this section must be stopped on all the nodes, preferably at the same time with minimum delay during certificate rotation. After updating the certificates, the services that were stopped must be started again on the nodes in the reverse order.
Log in to the ESA Web UI.
Navigate to System > Services > Misc.
Stop the Audit Store Dashboards service. This step must be performed on all the other nodes followed by the Lead node.
Stop the td-agent service. This step must be performed on all the other nodes followed by the Lead node.
On the ESA Web UI, navigate to System > Services > Analytics.
Stop the Insight_nginx service. This step must be performed on all the other nodes followed by the Lead node.
Stop the Analytics service. This step must be performed on all the other nodes followed by the Lead node. The other nodes might not have Analytics installed. In this case, skip this step on those nodes.
Navigate to System > Services > Audit Store.
Stop the Audit Store Management service. This step must be performed on all the other nodes followed by the Lead node.
Stop the Audit Store Repository service.
Attention: This is a very important step and must be performed on all the other nodes followed by the Lead node without any delay. A delay in stopping the service on the nodes will result in that node receiving logs. This will lead to inconsistency in the logs across nodes and logs might be lost.
Apply the custom certificates on the Lead ESA node.
For more information about certificates, refer to Using custom certificates in Insight.
Complete any one of the following steps on the remaining nodes in the Audit Store cluster.
Apply the custom certificates on the remaining nodes in the Audit Store cluster.
For more information about certificates, refer to Using custom certificates in Insight.
Run the Rotate Audit Store Certificates tool on all the remaining nodes in the Audit Store cluster one node at a time.
In the ESA Web UI of a node in the Audit Store cluster, click the Terminal Icon in lower-right corner to navigate to the ESA CLI Manager.
Navigate to Tools > Rotate Audit Store Certificates.
Enter the root password and select OK.
Enter the admin username and password and select OK.
Enter the IP address of the Lead node in Target Audit Store Address and select OK.
Enter the admin username and password for the Lead node and select OK.
After the rotation is completed without errors, the following screen appears. Select OK to go to the CLI menu screen.
The CLI screen appears.
In the ESA Web UI, navigate to System > Services > Audit Store.
Start the Audit Store Repository service.
Attention: This step must be performed on the Lead node followed by all the other nodes without any delay. A delay in starting the services on the nodes will result in that node receiving logs. This will lead to inconsistency in the logs across nodes and logs might be lost.
Start the Audit Store Management service. This step must be performed on the Lead node followed by all the other nodes.
Navigate to Audit Store > Cluster Management and confirm that the Audit Store cluster is functional and the Audit Store cluster status is green.
Navigate to System > Services > Analytics.
Start the Analytics service. This step must be performed on the Lead node followed by all the other nodes. The other nodes might not have Analytics installed. In this case, skip this step on those nodes.
Start the Insight_nginx service. This step must be performed on the Lead node followed by all the other nodes.
Navigate to System > Services > Misc.
Start the td-agent service. This step must be performed on the Lead node followed by all the other nodes.
Start the Audit Store Dashboards service. This step must be performed on the Lead node followed by all the other nodes.
On the ESA Web UI, navigate to Audit Store > Cluster Management.
Verify that the nodes are still a part of the Audit Store cluster.
2.4.6 - Removing an ESA from the Audit Store cluster
Before you begin:
- If an external SIEM is configured, ensure that the machine is available and running.
- Verify if the scheduler task jobs are enabled on the ESA using the following steps:
- Log in to the ESA Web UI.
- Navigate to System > Task Scheduler.
- Verify whether the following tasks are enabled on the ESA.
- Update Policy Status Dashboard
- Update Protector Status Dashboard
Perform the following steps to remove the ESA node:
From the ESA Web UI, click Audit Store > Cluster Management to open the Audit Store clustering page.
The Overview screen appears.

Click Leave Cluster.
A confirmation dialog box appears. The Audit Store cluster information is updated when a node leaves the Audit Store cluster. Hence, nodes must be removed from the Audit Store cluster one at a time. Removing multiple nodes from the Audit Store cluster at the same time using the ESA Web UI would lead to errors.
Click YES.
The ESA is removed from the Audit Store cluster. The Leave Cluster button is disabled and the Join Cluster button is enabled. The process takes time to complete. Stay on the same page and do not navigate to any other page while the process is in progress.

If the scheduler task jobs were enabled on the ESA that was removed, then enable the scheduler task jobs on another ESA in the Audit Store cluster. These tasks must be enabled on any one ESA in the Audit Store cluster. Enabling on multiple nodes might result in a loss of data.
- Log in to the ESA Web UI of any one node in the Audit Store cluster.
- Navigate to System > Task Scheduler.
- Enable the following tasks by selecting the task, clicking Edit, selecting the Enable check box, and clicking Save.
- Update Policy Status Dashboard
- Update Protector Status Dashboard
- Click Apply.
- Specify the root password and click OK.
After leaving the Audit Store cluster, the configuration of the node and data is reset. The node will be uninitialized. Before using the node again, Protegrity Analytics needs to be initialized on the node or the node needs to be added to another Audit Store cluster.
2.5 - Identifying the protector version
Perform the following steps to identify the PEP server version of the protector:
Log in to the ESA.
Navigate to Policy Management > Nodes.
View the Version field for all the protectors.
3 - Upgrading ESA to v10.2.0
3.1 - System and License Requirements
The following table lists the supported components and their compatibility settings.
| Component | Compatibility |
|---|---|
| Application Protocols | HTTP 1.1, SSL/TLS |
| Web Browsers | Minimum supported Web Browser versions are as follows: - Google Chrome version 139.0.7258.155 (64-bit) - Mozilla Firefox version 142.0.1 (64-bit) or higher - Microsoft Edge version 139.0.3405.125 (64-bit) |
The following table lists the minimum hardware configurations.
| Hardware Components | Configuration |
|---|---|
| CPU | Multicore Processor, with minimum 8 CPUs |
| RAM | 32 GB |
| Hard Disk | 320 GB |
| CPU Architecture | x86 |
The following partition spaces must be available.
| Partition | Minimum Space Required |
|---|---|
| OS(/) | 40% |
| /opt | Twice the patch size |
| /var/log | 20% |
Software Requirements
Ensure that the software requirements are met before upgrading the appliance.
- The ESAs must be available on one of the following versions.
- At least three ESAs must be in a Trusted Appliance Cluster (TAC).
- At least three ESAs must be in the Audit Store Cluster.
Installation Requirements
The ESA_PAP-ALL-64_x86-64_10.2.0.UP.2631.pty patch file is available.
Ensure to download the latest patch for the respective version from the My.Protegrity portal.
For more information about the latest build number and the patch details, refer to the Release Notes of the respective patch.
Licensing Requirements
Ensure that a valid license is available before upgrading. If the license status is invalid, then contact Protegrity Support.
3.2 - Upgrade Paths to ESA v10.2.0

After succesfully upgrading the ESA to v10.2.0, apply the ESA 10.2.1 HF patch. This patch contains various vulnerability fixes, package updates, and bug fixes.
*indicates all the available hotfix and security patches on the platform version.
For example, to upgrade from the ESA v9.0.0.0 to the ESA v10.2.0, install the patches as follows:
- ESA v9.1.0.x
- ESA v10.2.0
- Apply the ESA 10.2.1 HF patch.
For more information about upgrading the ESA to v10.2.0, refer Upgrading to v10.2.0.
Before installing any patch, refer to the Release Notes from the My.Protegrity portal.
The following table provides the recommended upgrade paths to the ESA v10.2.0.
| Current Version | Path to Upgrade the ESA to v10.2.0 |
|---|---|
| 10.1.0 | 1. Install the ESA_PAP-ALL-64_x86-64_10.1.1+HF.2473.pty patch.2. Install the v10.2.0 patch. 3. Apply the ESA 10.2.1 HF patch. |
| 10.0.1 | 1. Install the ESA_PAP-ALL-64_x86-64_10.0.2+HF.2451.pty patch.2. Install the v10.2.0 patch. 3. Apply the ESA 10.2.1 HF patch. |
| 9.2.0.1 | 1. Install the v10.2.0 patch. 2. Apply the ESA 10.2.1 HF patch. |
| 9.2.0.0 | 1. Install the v10.2.0 patch. 2. Apply the ESA 10.2.1 HF patch. |
| 9.1.0.x | 1. Install the v10.2.0 patch. 2. Apply the ESA 10.2.1 HF patch. |
| 9.0.0.0 | 1. Install the v9.1.0.x patch. 2. Install the v10.2.0 patch. 3. Apply the ESA 10.2.1 HF patch. |
To check the current version of the ESA:
- From the ESA Web UI, navigate to System > Information.
The current patch installed on the ESA is displayed. - Navigate to the About page to view the current version of the ESA.
For more information about:
Upgrading to previous ESA versions, refer the Upgrade Guide for the respective versions on My.Protegrity portal.
Applying the DSG patch on the ESA, refer Extending ESA with DSG Web UI in the Protegrity Data Security Gateway User Guide for the respective version.
3.3 - Prerequisites
Before you begin
It is recommended to download and run the ESA Readiness patch from the My.Protegrity portal. This patch verifies if the ESA satisfies the upgrade requirements.After applying the ESA Readiness patch, if there are any errors, then ensure these errors must be resolved before applying the Upgrade patch.For more information about the error Messages and resolutions, refer ESA Upgrade Readiness Patch Error Messages and Resolutions.
After all the conditions from the readiness patch are satisfied, perform the following steps.
Verifying the GPG Public Key
The GPG Public Key used to sign Debian packages embedded in Protegrity appliances expired on April 9, 2024. The appliances installed before this date will continue to function, however issues will occur when upgrading or applying any maintenance patches to these appliances.
To avoid any potential issues, it is recommended to apply the PAP_PAP-ALL-64_x86-64_Generic.V-6.pty patch to extend the expiry date of the GPG Public Key used to sign Debian packages embedded in Protegrity appliances. This patch must be applied before applying maintenance releases or upgrading the ESA.
The following table lists the appliances and the affected versions.
| Appliance | Affected Version |
|---|---|
| Enterprise Security Administrator (ESA) | All versions from 7.2 to 9.1.0.2 |
| Data Security Gateway (DSG) | All versions from 2.4 to 3.1.0.2 |
For more information, refer the following GPG Public Key Expiration announcement on My.Protegrity.com portal.
https://my.protegrity.com/notifications/GPG-notification#_New_Installations
Verifying the Presence of DTP/DTP2 Data Elements
If the DTP/DTP2 is present in the algorithm property of a data element while upgrading the ESA to v10.2, then the upgrade script fails. The following error message appears:
ERROR: Found unsupported DTP data elements
Perform the following actions:
- Reprotect data with a new data element that does not have DTP/DTP2 formatting.
- Remove the data elements that contain DTP/DTP2 algorithm.
This prevents the data loss that occurs during the upgrade. The DTP/DTP2 data elements are now unsupported.
For more information about the data elements to be used, contact Protegrity Support.
Verifying the Presence of FPE Data Elements with Left and/or Right in Clear Settings
If the format-preserving encryption (FPE) data elements with Left and Right settings are present when you upgrade the ESA to v10.2, then the upgrade script fails. The following error message appears:
ERROR: FPE Data Element(s) with characters in clear ('From Left' / 'From Right') are no longer supported on the target version.
   Please consult the documentation or Protegrity staff for guidance.
   Data Element(s) affected: <List of affected data elements>
Perform the following actions:
- Reprotect data with a new data element that does not have Left and Right settings.
- Remove the data elements that contain Left and Right settings.
This prevents the data loss that occurs during the upgrade. The FPE data elements with Left and Right settings are now unsupported.
For more information about the data elements to be used, contact Protegrity Support.
Accounts
An account with administrative privileges must be active.
Backup and Restore
The OS backup procedure is performed to backup files, OS settings, policy information, and user information. Ensure that the latest backup is available before upgrading to the latest version.
If the patch installation fails, then you can revert the ESA to a previous version. Ensure to backup the complete OS or export the required files before initiating the patch installation process.
Backup operation must be performed on each ESA. While restoring the ESA using a backup, it must be done using the backup created for the same ESA. Do not use the same backup file to restore multiple ESAs.
Full OS backup
The entire OS must be backed up to prevent data loss. This allows the OS to be reverted to a previous stable configuration in case of a patch installation failure. This option is available only for the on-premise deployments.
The Full OS Backup/Restore features of the Protegrity appliances is available only for the on-premise deployments. It is not available for virtual machines created using an OVA template and cloud-based virtual machines.
Perform the following steps to backup the full OS configuration:
- Log in to the ESA Web UI.
- Navigate to System > Backup & Restore > OS Full, to backup the full OS.
- Click Backup.
The backup process is initiated. After the OS Backup process is completed, a notification message appears on the ESA Web UI Dashboard.
Creating a snapshot for cloud-based services
A snapshot represents a state of an instance or disk at a point in time. Use a snapshot of an instance or a disk to backup and restore information in case of failures. Ensure that the latest snapshot is available before upgrading the ESA.
A snapshot of an instance or a disk can be created on the following platforms:
Validating Custom Configuration Files
Complete the following steps if you modified any configuration files.
Review the contents of any configuration files. Verify that the code in the configuration file is formatted properly. Ensure that there are no additional spaces, tabs, line breaks, or control characters in the configuration file.
Back up any custom configuration files or modified configuration files. If required, use the backup files to restore settings after the upgrade is complete.
Validate that the backup files are created with the details appended to the extension, for example, .conf_backup, .conf_bkup123, or .conf_current_build_number.
While using protectors below version 10.x, if any changes are made to the ulimit, then the changes are retained after the ESA upgrade is completed successfully.
Enabling the local_admin Permissions
Ensure to configure the required permissions for the local_admin user.
To change local_admin account permissions:
Login to the CLI Manager.
Navigate to Administration > Accounts and Passwords > Manage Passwords and Local-Accounts > Change OS local_admin account permissions.
In the dialog box displayed, in the Password field, enter the local_admin password.
Select OK.
Specify the permissions for the local_admin. You can either select SSH Access, Web-Interface Access, or both.
Select OK.
External SIEM running
If an external SIEM is configured, ensure that the system is running and reachable during the upgrade.
3.4 - Upgrading ESA to v10.2.0
Before you begin
Ensure that the ESA is upgraded prior to upgrading the protectors.
3.4.1 - Upgrading ESA from v9.1.0.x
When ESA is upgraded from v9.1.0.x, then the process is completed over two phases.During Phase 1, the Kernel, OS, and other components are upgraded. After the Phase 1 is completed, the system restarts automatically.
After the system restarts, Phase 2 begins automatically and the critical components of ESA are upgraded.
It is recommended to wait for a few minutes before logging in to the ESA using SSH, to view the upgrade progress.
If logging into the system using SSH is attempted immediately after the system restarts, then an error with
Invalid Credentialsappears. This may occur while LDAP upgrade is in process.
After the upgrade is successful, the system restarts automatically. After the system restarts, log in to the ESA using the CLI Manager or Web UI. When using the SSH, it is recommended to wait for a few minutes before logging in to the ESA.
While upgrading the ESA from v9.1.0.x, the entire process takes approximately 45 minutes. A temporary downtime is expected, resulting in limited access or intermittent interruptions.Additionally, the time taken for creating the backup depends on the actual size of the data which is being backed up. The time taken for the backup is excluded from the upgrade process.
Uploading the patch using the CLI Manager
Perform the following steps to upload the patch from the CLI Manager:
- Log in to the ESA CLI Manager with administrator credentials.
- Navigate to Administration > OS Console to upload the patch.
- Enter the root password and click OK.
- Upload the patch to the /products/uploads directory using the FTP or SCP command.
The patch file is uploaded.
Installing the ESA patch from CLI Manager
Before you begin
When upgrading nodes in an Audit Store cluster, if cluster-related checks pass on one node, you can safely ignore similar errors on the other nodes.
While upgrading multiple nodes in the Audit Store cluster, the post-upgrade steps are completed successfully only after all cluster nodes are upgraded. A success message is then logged and shown to the user as a notification message, both, in the ESA UI and the CLI. Investigate post-upgrade errors only after all nodes are upgraded.
Perform the following steps to install the patch from the CLI Manager:
Log in to the ESA CLI Manager with administrator credentials.
Navigate to Administration > Patch Management to install the patch.
Enter the root password and click OK.
Select Install a Patch.
Select the ESA_PAP-ALL-64_x86-64_10.2.0.UP.2631.pty patch file and select Install.
After Phase 1 is installed, following screen appears.

After the reboot is successful, Phase 2 begins automatically.
After Phase 2 is completed, a message for
System going down for reboot nowappears.After the reboot is successful, then the patch is installed successfully.
The patch is installed successfully and the ESA is upgraded to v10.2.0.
After upgrading the system successfully on v10.2.0, when using the SSH, it is recommended to wait for a few minutes before logging in to the ESA.
After succesfully upgrading the ESA to v10.2.0, apply the ESA 10.2.1 HF patch. This patch contains various vulnerability fixes, package updates, and bug fixes.
3.4.2 - Upgrading ESA from v9.2.0.x
When ESA is upgraded from v9.2.0.x, then the upgrade process happens in a single phase.
During the upgrade, the system displays the upgrade progress which appears on the ESA CLI Manager. After the upgrade is successful, the system restarts automatically.After the system restarts, log in to the ESA using the CLI Manager or Web UI.
While upgrading the ESA from v9.2.0.x, the entire process takes approximately 30 minutes. A temporary downtime is expected, resulting in limited access or intermittent interruptions.Additionally, the time taken for creating the backup depends on the actual size of the data which is being backed up. The time taken for the backup is excluded from the upgrade process.
Uploading the patch using the CLI Manager
Perform the following steps to upload the patch from the CLI Manager:
- Log in to the ESA CLI Manager with administrator credentials.
- Navigate to Administration > OS Console to upload the patch.
- Enter the root password and click OK.
- Upload the patch to the /products/uploads directory using the FTP or SCP command.
The patch file is uploaded.
Installing the ESA patch from CLI Manager
Before you begin
When upgrading nodes in an Audit Store cluster, if cluster-related checks pass on one node, you can safely ignore similar errors on the other nodes.
While upgrading multiple nodes in the Audit Store cluster, the post-upgrade steps are completed successfully only after all cluster nodes are upgraded. A success message is then logged and shown to the user as a notification message, both, in the ESA UI and the CLI. Investigate post-upgrade errors only after all nodes are upgraded.
Perform the following steps to install the patch from the CLI Manager:
Log in to the ESA CLI Manager with administrator credentials.
Navigate to Administration > Patch Management to install the patch.
Enter the root password and click OK.
Select Install a Patch.
Select the ESA_PAP-ALL-64_x86-64_10.2.0.UP.2631.pty patch file and select Install.
After the patch is installed, select Reboot Now.

This screen has a timeout of 60 seconds. If Reboot Now is not selected manually, then the system automatically reboots after 60 seconds.
After the reboot is initiated, the message Patch has been installed successfully !! appears. Select Exit.
The patch is installed successfully and the ESA is upgraded to v10.2.0.
After upgrading the system successfully on v10.2.0, when using the SSH, it is recommended to wait for a few minutes before logging in to the ESA.
After succesfully upgrading the ESA to v10.2.0, apply the ESA 10.2.1 HF patch. This patch contains various vulnerability fixes, package updates, and bug fixes.
3.4.3 - Upgrading ESA from v10.0.x
When ESA is upgraded from v10.0.1 or v10.1.0, ensure to apply the hotfix patch before applying the v10.2.0 upgrade patch.
| ESA Version | Hotfix to be applied |
|---|---|
| 10.0.1 | ESA_PAP-ALL-64_x86-64_10.0.2+HF.2451.pty |
| 10.1.0 | ESA_PAP-ALL-64_x86-64_10.1.1+HF.2473.pty |
If upgrading ESA from v10.0.1 or v10.1.0, then the upgrade process happens in a single phase.
During the upgrade, the system displays the upgrade progress which appears on the ESA CLI Manager. After the upgrade is successful, the system restarts automatically.After the system restarts, log in to the ESA using the CLI Manager or Web UI.
While upgrading the ESA from v10.0.1 or v10.1.0, the entire process takes approximately 30 minutes. A temporary downtime is expected, resulting in limited access or intermittent interruptions.Additionally, the time taken for creating the backup depends on the actual size of the data which is being backed up. The time taken for the backup is excluded from the upgrade process.
Uploading the ESA patch
The ESA patch can be uploaded using the Web UI or the CLI Manager but the patch should only be installed using the CLI Manager.
Uploading the patch using the Web UI
Perform the following steps to upload the patch from the Web UI:
Log in to the ESA Web UI with administrator credentials.
Navigate to Settings > System > File Upload.The File Upload page appears.
In the File Selection section, click Choose File.The file upload dialog box appears.
Select the patch file and click Open.
- Only the files with .pty and .tgz extensions can be uploaded.
- If the file uploaded exceeds the Max File Upload Size, then a password prompt appears. Enter the password and click Ok.
Only a user with the administrative role can perform this action.
- By default, the Max File Upload Size value is set to 25 MB. To increase this value, refer Increasing Maximum File Upload Size.
Click Upload.
After the file is uploaded successfully, then from the Uploaded Files area, choose the uploaded patch.The information for the selected patch appears.

Uploading the patch using the CLI Manager
Perform the following steps to upload the patch from the CLI Manager:
- Log in to the ESA CLI Manager with administrator credentials.
- Navigate to Administration > OS Console to upload the patch.
- Enter the root password and click OK.
- Upload the patch to the /products/uploads directory using the FTP or SCP command.
The patch file is uploaded.
Installing the ESA patch from CLI Manager
Before you begin
When upgrading nodes in an Audit Store cluster, if cluster-related checks pass on one node, you can safely ignore similar errors on the other nodes.
While upgrading multiple nodes in the Audit Store cluster, the post-upgrade steps are completed successfully only after all cluster nodes are upgraded. A success message is then logged and shown to the user as a notification message, both, in the ESA UI and the CLI. Investigate post-upgrade errors only after all nodes are upgraded.
Perform the following steps to install the patch from the CLI Manager:
Log in to the ESA CLI Manager with administrator credentials.
Navigate to Administration > Patch Management to install the patch.
Enter the root password and click OK.
Select Install a Patch.
Select the ESA_PAP-ALL-64_x86-64_10.2.0.UP.2631.pty patch file and select Install.
After the patch is installed, select Reboot Now.
This screen has a timeout of 60 seconds. If Reboot Now is not selected manually, then the system automatically reboots after 60 seconds.
After the reboot is initiated, the message Patch has been installed successfully !! appears. Select Exit.
The patch is installed successfully and the ESA is upgraded to v10.2.0.
After upgrading the system successfully on v10.2.0, when using the SSH, it is recommended to wait for a few minutes before logging in to the ESA.
After succesfully upgrading the ESA to v10.2.0, apply the ESA 10.2.1 HF patch. This patch contains various vulnerability fixes, package updates, and bug fixes.
3.4.4 - Verifying the ESA Patch Installation
Verifying the ESA version
Perform the following steps to verify the patch installation:
- From the ESA Web UI, navigate to System > Information.
The current patch installed on the ESA is displayed. - Navigate to the About page to view the current version of the ESA.
The ESA is upgraded to v10.2.0.
Verifying Upgrade Logs
During the upgrade process, logs describing upgrade process are generated. The logs describe the services that are initiated, restarted, or the errors generated.
To view the logs under the /var/log directory from the CLI Manager, navigate to CLI Manager > Administration > OS console.
| Log Type | Description |
|---|---|
| syslog | Provides collective information about the syslogs. |
| upgrade_10.2.0.log | Provides the information of real time logs, when upgrading the ESA from v9.1.0.x. |
| patch_ESA_10.2.0_UPGRADE_INSTALLER.log |
|
| patch_ESA_10.2.0_UPGRADE_PHASE_2.log |
|
3.4.5 - Verifying the health of Trusted Appliance Cluster
After upgrading all the ESAs in the Trusted Appliance Cluster to v10.2.0, ensure that all the nodes in the cluster are healthy.
Perform the following steps to verify health of ESAs in the TAC.
These steps must be performed individually on each ESA node in the Trusted Appliance Cluster.
- From the ESA Web UI, navigate to System > Trusted Appliance Cluster.
- Verify the details for each node in the TAC.
- In the Status field, the ESA node must be Online.
- In the Status Message field, no errors must be displayed.
- In the Labels field, each node must be labeled as Consul Server or Consul Client.If the label for any ESA node is not Consul Server or Consul Client, then refer Common ESA Errors.
3.5 - Restoring to the Previous Version of ESA
3.5.1 - Restoring to the Previous Version of ESA On-premise
To roll back the system to the previous version, perform the steps to restore the system.This helps in cases such as when an upgrade fails.
Perform the steps to restore to the previous version of the ESA on-premise.
- From the CLI Manager, navigate to Administration > Reboot And Shutdown > Reboot to restart the system.A screen to enter the reason for restart appears.
- Enter the reason and select OK.
- Enter the root password and select OK.
The appliance restarts and the following screen appears.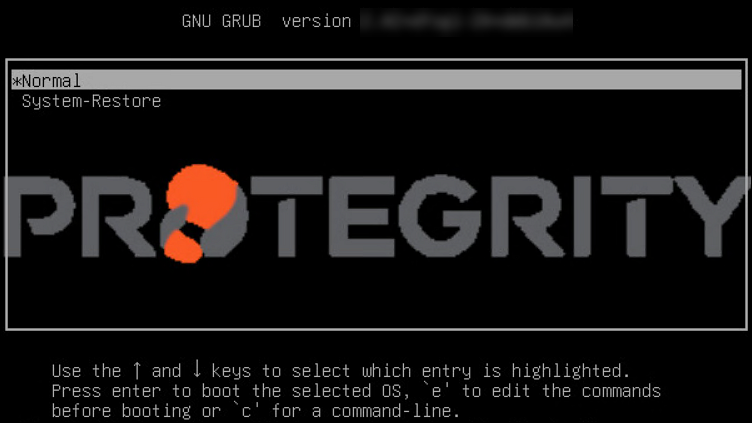
- Select System-Restore and press ENTER.
The Welcome to System Restore Mode screen appears.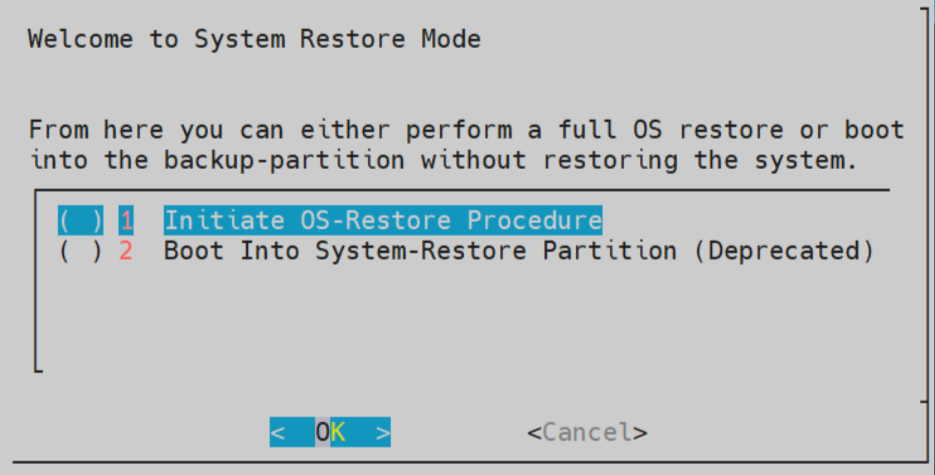
- Select Initiate OS-Restore Procedure and select OK.
The Boot Into System-Restore Partition option is deprecated from this release. Ensure to only use Initiate OS-Restore Procedure option to restore to the previous stable version.
The restore procedure is initiated.
After the OS-Restore procedure is completed, the login screen appears.
3.5.2 - Restoring to the Previous Version of ESA Cloud platforms
This section describes restoring the ESA on Cloud platforms, such as, Amazon Web Services (AWS), Azure, or Google Cloud Platform (GCP). For installing the ESA on cloud platforms, you must mount the image containing the ESA on a cloud instance or a virtual machine. After mounting the image, you must run the finalization procedure to install the ESA components.
| Cloud Platform | Backing up and Restoring ESA |
|---|---|
| AWS | Create and restore a snapshot on AWS |
| Azure | Create and restore a snapshot on Azure |
| GCP | Create and restore a snapshot on GCP |
3.5.3 - Restoring to the Previous Version of ESA VMWare
This section describes creating a snapshot and restoring the ESA on VMWare to the previous version.
Creating a Snapshot on VMWare
To create a snapshot on VMWare:
- Log in to the VMware Client console.
- Navigate to Inventories > VMs and Templates.
- From the left navigation pane, select the required project.
- Select the required OVA template.
- Right-click the VM and select Snapshot > Take Snapshot. The Take Snapshot screen appears.
- Enter a name and description for the snapshot.
- Click Take Snapshot.
- Check “Snapshot the virtual machine’s memory” for a full state capture.
- Click OK.
Restoring a Snapshot on VMWare
To restore a snapshot on VMWare:
- Log in to the VMware Client console.
- Navigate to Inventories > VMs and Templates.
- From the left navigation pane, select the required project.
- Select the required OVA template.
- Right-click the VM and select Snapshot > Snapshot Manager.
- Select the required snapshot.
- Click Go To.
The snapshot is added to the VMWare.
4 - Enterprise Security Administrator (ESA)
Protegrity Data Security Platform provides policy management and data protection. It has as its main component the Enterprise Security Administrator (ESA). Working in combination with a Protegrity database protector, application protector, file protector, or big data protector it can be used for managing data security policy, key management, and auditing and reporting.
- ESA: The ESA Manager provides information on how to install specific components, work with policy management tools, manage keys and key rotation and manage switching between Soft HSM and Key Store, configuring logging repositories and using logging tools. This document contains details for all these features.
- Audit Store: The Audit Store is a repository for the logs generated from multiple sources, such as the kernel, policy management, member source, application logs, and protectors. The Audit Store supports clustering for scalability.
- Insight: This feature displays forensics from the Audit Store on the Audit Store Dashboards. It provides options to query and display data from the Audit Store. Predefined graphs are available for analyzing the data from the Audit Store. It provides options for generating and saving customized queries and reports. An enhanced alerting system tracks the data in the Audit Store to monitor the systems and alert users if required.
- Data Security Gateway: The Data Security Gateway (DSG) is a network intermediary that can be classified under Cloud Access Security Brokers (CASB) and Cloud Data Protection Gateway (CDPG). CASBs provide security administrators a central check point to ensure secure and compliant use of cloud services across multiple cloud providers. CDPG is a security policy enforcement check point that exists between cloud data consumer and cloud service provider to interject enterprise policies whenever the cloud-based resources are accessed.
4.1 - Protegrity Appliance Overview
Protegrity Appliance Overview
The Protegrity Data Security Platform provides policy management and data protection and has the following appliances.
- Enterprise Security Administrator (ESA) is the main component of the Data Security Platform. Working in combination with a Protegrity Protector, it can be used to encrypt or tokenize your data. Protectors include the Database Protector, Application Protector, File Protector, or Big Data Protector.
- The Data Security Gateway (DSG) is a network intermediary that can be classified under Cloud Access Security Brokers (CASB) and Cloud Data Protection Gateway (CDPG). CASBs provide security administrators a central check point to ensure secure and compliant use of cloud services across multiple cloud providers. CDPG is a security policy enforcement check point that exists between cloud data consumer and cloud service provider to interject enterprise policies whenever the cloud-based resources are accessed.
Data Protectors – Protect sensitive data in the enterprise and deploy security policy for enforcement on each installed system. A policy is deployed from ESA to the Data Protectors and Audit Logs of all activity on sensitive data is forwarded to the appliances, such as, the ESA, or external logging systems.
Protegrity appliances are based on the same framework with the base operating system (OS) as hardened Linux, which provides the platform for Protegrity products. This platform includes the required OS low-level components as well as higher-level components for enhanced security manageability.
Protegrity appliances have two basic interfaces: CLI Manager and Web UI. CLI Manager is a console-based environment and Web UI is a web-based environment. Most of the management features are shared by all appliances. Some examples of the shared management features are network settings management, date and time settings management, logs management, and appliance configuration facilities, among others.
An organization can use a mix of these mandatory and may-use methods to secure data.
4.2 - Installing ESA
You can install ESA on-premise or on a cloud platform such as AWS, GCP, or Azure. When you upgrade from a previous version, ESA is available as patch. The following are the different ways of installing ESA:
Installing ESA
- ISO Installation: This installation is performed for an on-premise environment where ESA is installed on a local system using an ESA ISO is provided by Protegrity. The installation of the ISO begins by installing the hardened version of Linux on your system, setting up the network, and configuring date/time. This is then followed by updating the location, setting up OS user accounts, and installing the ESA-related components. For more information about installing ESA using ISO, refer to Installing ESA using ISO.
- Cloud Platforms: On Cloud platforms such as, AWS, GCP, or Azure, ESA images for the respective cloud are generated and provided by Protegrity. In these images, ESA is installed with specific components. You must obtain the image from Protegrity and create an instance on the cloud platform. After creating the instance, you run certain steps for finalizing the installation. For more information about installing ESA on cloud platforms, refer to Installing ESA on Cloud Platforms.
A temporary license is provided by default when you first install the ESA and is valid for 30 days from the date of this installation. To continue using Protegrity features, you have to obtain a validated license before your temporary license expires.
For more information about licensing, refer to Protegrity Data Security Platform Licensing.
4.3 - Logging Into ESA
The Enterprise Security Administrator (ESA), contains several components such as, Insight, Audit Store, Analytics, Policy Management, Key Management, Certificate Management, Clustering, Backup/Restore, Networking, User Management, and so on. You must login to ESA to avail the services of these components. Log in to the CLI Manager or Web UI of ESA to secure your data using these components.
The login aspect of the appliance can be categorized into the following categories:
Simple Login
Log in to ESA from CLI or Web UI by providing valid user credentials. You can login to ESA as an appliance or LDAP user. For more information about users, refer to ESA users.
From your Web browser, type the domain name of the ESA HTTPS protocol, for example, https://192.168.1.x/. The Web Interface splash screen appears. The following figure displays the login page of the ESA Web UI.

You can login to the ESA CLI Manger using an SSH session.
Single Sign-On (SSO)
Single Sign-on (SSO) is a feature that enables users to authenticate multiple applications by logging in to a system only once. On the Protegrity appliances, such as ESA and DSG, you can utilize the Kerberos SSO mechanism to login to the appliance. For more information about SSO, refer to Single Sign-On. The following figure displays the login page with SSO.

Two-Factor Authentication
The two factor authentication is a verification process where two recognized factors are used to identify you before granting you access to a system or website. In addition to your password, you must correctly enter a different numeric one-time passcode or the verification code to finish the login process. This provides an extra layer of security to the traditional authentication method. For more information about two-factor authentication, refer Two-Factor Authentication.
Protegrity supports Mozilla Firefox, Chrome, and Internet Explorer browsers for Web UI login.
4.4 - Command-Line Interface (CLI) Manager
Command-Line Interface (CLI) Manager is a Protegrity Platform tool for managing the Protegrity appliances, such as, the ESA and DSG. CLI Manager is a text-based environment for managing status, administration, configuration, preferences, and networking of your appliance. This section describes how to login to the ESA CLI Manager, and its many features.
4.4.1 - Accessing the CLI Manager
You log on to the CLI Manager to manage the settings and monitor the ESA. The CLI Manager is available using any of the following text consoles:
- Direct connection using local keyboard and monitor.
- Serial connection using an RS232 console cable.
- Network connection using a Secure Shell (SSH port 22) connection to the appliance management IP address.For more information about listening ports, refer Open listening ports.
To log on to the CLI Manager:
From the ESA Web UI pane, click the window that appears at the bottom right.
A new CLI Manager window opens.
At the prompt, type the admin login credentials set during the appliance installation.
Press ENTER.
The CLI Manager screen appears.
First time login
When you login through the CLI Manager or the Web UI for the first time, with the password policy enabled, the Update Password screen appears. It is recommended that you change the password since the administrator sets the initial password.
Shell Accounts role with Shell Access
If you are a user associated to Shell Accounts role with Shell (non-CLI) Access permissions, you cannot access the CLI or Web UI. This is an exception when the user has the password policy enabled and is required to change the password through the Web UI.
For more information about configuring the password policy, refer to section Password Policy Configuration.
CLI Manager Main Screen
The CLI Manager screen appears when you successfully login to the CLI Manager. This screen appears with the messages that relate to the user who has logged in and also mentions the priority of each message. Note here that % to the bottom-right of the screen indicates the information available for viewing on the screen.

If you click Continue, then the CLI Manager main screen appears.
The following figure illustrates the CLI Manager main screen.
")
CLI Manager Navigation
There are many common keystrokes that help you to navigate the CLI Manager. The following table describes the navigation keys.
| Key | Description |
|---|---|
| UP ARROW DOWN ARROW | Navigates up and down menu options |
| ENTER | Selects an option or continues process |
| Q | Quits the CLI Manager |
| T | Goes to the top of the current menu |
| U | Moves up one level |
| H | Displays key settings and instructions |
| TAB | Moves between multiple fields |
| Page Up | Scroll Up |
| Page Down | Scroll Down |
In the following sections, the main system menus in the CLI manager are explained in detail.
4.4.2 - CLI Manager Structure Overview
There are five main system menus in the CLI Manager:
- Status and Logs
- Administration
- Networking
- Tools
- Preferences
Status and Logs
Status and Logs menu includes four options that make the analysis of logs easier.
- System Monitor tool with real-life information on the CPU, network, and disk usage.
- Top Processes view having a list of 10 top memory and CPU users. The information is updated periodically.
- Appliance Logs tool, divided into subcategories. These can be appliance common logs and appliance specific logs. Thus, you can view system event logs that relate to, for example, syslog, installation, kernel, and web services engine logs which are common for all Protegrity appliances.
- User Notifications tool include all the messages for a user. The latest notifications are also displayed on the screen after login.
For more information about status and logs, refer to section Working with Status and Logs.
Administration
Using Administration menu, perform most of the standard server administration tasks.
- Start/stop/restart services
- Change time/time zone/date/NTP server
- Change passwords for admin/viewer/root user/LDAP users and unlock locked users
- Backup/restore OS, appliance configuration
- Set up email (SMTP)
- JWT Configuration
- Azure AD Configuration
- Install/uninstall services and patches
- Set up communication with a directory server (Local/external LDAP, Active Directory) and monitor the LDAP
- Reboot and shut down
- Access appliance OS console
For more information about ESA administration, refer to section Working with Administration.
Networking
Using the Networking menu, configure the network settings as per your requirements.
- Change host name, appliance address, gateway, domain information
- Configure SNMP – refresh/start/set service or show/set string
- Specify management interface for Web UI and Web Services
- Configure network interface settings and assign services to multiple IP addresses
- Troubleshoot the network
- Manage Firewall settings
- Ports Allowlist
For more information about ESA networking, refer to section Working with Networking.
Tools
Using the Tools menu, perform the following tasks in ESA.
- Configure SSH mode to include known hosts/authorized keys/identities, and generate new server key
- Set up trusted appliances cluster
- Set up XEN paravirtualization
- View status of external hard drives
- Run antivirus and update signature file
- Configure Web services settings
For more information about tools, refer to section Working with Tools.
If you are using DSG, then you have additional tools for configuring ESA communication. Refer to the appropriate Appliance guide for details.
The additional tools for logging and reporting and policy management mentioned in the list are specifically for configuring ESA appliance.
Preferences
Using the Preferences menu, perform the following tasks.
- Set up local console settings
- Specify if root password is required for the CLI system tools
- Display the system monitor in OS console
- Minimize timing differences
- Set uniform response time for failed login
- Enable root credentials check limit
- Enable AppArmor
- Enable FIPS Mode
- Basic Authentication for REST APIs
For more information about preferences, refer to section Working with Preferences.
4.4.3 - Working with Status and Logs
The Status and Logs screen allows you to access system monitor information, examine top memory and CPU usage, and view appliance logs. You can access it from the CLI Manager main screen. This screen shows the hostname to which you are connected, and it allows you to view and manage your audit logs.
The following figure shows the Status and Logs screen.

In addition to the existing logs, the following additional security logs are generated:
- Appliance’s own LDAP when users are added and removed.
- SUDO commands are issued from the shell.
- There are failed attempts to log in from SSH or Web UI.
- All shell commands: This is a PCI-DSS requirement.
4.4.3.1 - Monitoring System Statistics
Using System Monitor, you can view the following system statistics.
- CPU usage
- RAM
- Disk space free or in use.
- If more hard disks are required, and so on.
To view the system information, login to the CLI Manager, navigate to Status and Logs > System Monitor.

4.4.3.2 - Viewing the Top Processes
Using Top Processes, you can examine in real-time, the processes using up memory or CPU.
To view the top processes, login to the CLI Manager, navigate to Status and Logs > Top Processes.

4.4.3.3 - Working with System Statistics (SYSSTAT)
The System Statistics (SYSSTAT) is a tool to monitor system resources and their performance on LINUX/UNIX systems. It contains utilities that collect system information, report CPU statistics, report input-output statistics, and so on. The SYSSTAT tool provides an extensive and detailed data for all the activities in your system.
The SYSSTAT contains the following utilities for analyzing your system:
- sar
- iostat
- mpstat
- pidstat
- nfsiostat
- cisfsiostat
These utilities collect, report, and save system activity information. Using the reports generated, you can check the performance of your system.
The SYSSTAT tool is available when you install the appliance.
On the Web UI, navigate to System > Task Scheduler to view the SYSSTAT tasks. You must run the following tasks to collect the system information:
- Sysstat Activity Report to collect information at short intervals
- Sysstat Activity Summary to collect information at a specific time daily
The following figure displays the SYSSTAT tasks on the Web UI.

The logs are stored in the /var/logs/sysstat directory.
The tasks are disabled by default. You must enable the tasks from the Task Scheduler for collecting the system information.
4.4.3.4 - Auditing Service
The Linux Auditing System is a tool or utility that allows to monitor events occurring in a system. It is integrated with the kernel to watch the system operations. The events that must be monitored are added as rules and defined to which extent that the event must be tracked. If the event is triggered, then a detailed audit log is generated. Based on this log, you can track any violations to the system and improve security measures to prevent them.
In Protegrity appliances, the auditing tool is implemented to track certain events that can pose as a security threat. The Audit Service is installed and running in the appliance for this purpose. On the Web UI, navigate to System > Services to view the status of the service. The Audit Service runs to check the following events:
- Update timezone
- Update AppArmor profiles
- Manage OS users and their passwords
If any of these events occur, then a low severity log is generated and stored in the logs. The logs are available in the /var/log/audit/audit.log directory. The logs that are generated by the auditing tool, contain detailed information about modifications triggered by the events that are listed in the audit rules. This helps to differentiate between a simple log and an audit log generated by the auditing tool for monitoring potential risks to the appliance.
For example, consider a scenario where an OS user is added to the appliance. If the Audit Service is stopped, then details of the user addition are not displayed and logs contain entries as illustrated in the following figure.

If the Audit Service is running, then the same event triggers a detailed audit log describing the user addition. The logs are illustrated in the following figure.

As illustrated in the figure, the following are some audits that are triggered for the event:
- USER_CHAUTHOK: User attribute is modified.
- EOE: Multiple record event ended.
- PATH: Recorded a path file name.
Thus, based on the details provided in the type attribute, a potential threat to the system can be monitored.
For more information about the audit types, refer to the following link:
On the Web UI, an Audit Service Watchdog scheduled task is added to ensure that the Audit Service is running. This task is executed once every hour.
Caution: It is recommended to keep the Audit Service running for security purposes.
4.4.3.5 - Viewing Appliance Logs
Using Appliance Logs, you can view all logs that are gathered by the appliance.
To view the appliance logs, login to the CLI Manager, navigate to Status and Logs > Appliance Logs.
Table: Appliance Logs
Logs | Logs Types | Description | Appliances
Specific | |
ESA | DSG | |||
System Event Logs | Syslog | All appliance logs. | ✓ | ✓ |
Installation | Installation logs contain all of the information
gathered during the installation procedure. These logs include all
errors during installation and information on all the processes,
resources, and settings used for installation. | ✓ | ✓ | |
Patches | Patches installed on appliance | ✓ | ✓ | |
Patch_SASL | Proxy Authentication (SASL) related logs | |||
Authentication | Authentication logs, such as user logins. | ✓ | ✓ | |
Web Services | Logs generated by the Web Services modules. | ✓ | ✓ | |
Web Management | Logs generated by the Appliance Web UI engine | ✓ | ✓ | |
Current Event | Current event logs contain all the operations performed
on the appliance. It gathers all information from different
services and appliance components. | ✓ | ✓ | |
Kernel | System kernel logs. | ✓ | ✓ | |
Web Services Server | Web Services Apache logs | ✓ | ✓ | |
Patch_Logging | Logging server related logs such as
installation log: logging server and so on. | ✓ | ✓ | |
Web Services Engine | Web Services HTTP-Server logs | Appliance Web UI related logs. | ✓ | ✓ |
Service Dispatcher | Access Logs | Service Dispatcher Access Logs | ✓ | ✓ |
Server Logs | Service Dispatcher Server Logs | ✓ | ✓ | |
PEP Server | Logs received from PEP Server that is located on the FPV
and DSG. | ✓ | ||
Cluster Logs | Export Import Cluster | ✓ | ||
DSG Patch Installation | Cluster | Log all operations performed during installation of the
DSG patch | ✓ | |
You can delete the desired logs using the Purge button and view them in real-time using the Real-Time View button. When you finish viewing the logs, press Done to exit.
From v10.2.0, the following logs are visible on the Analytics dashboard.To view these logs, from the ESA Web UI, navigate to Analytics. These logs can be searched with their process name and Log Type as Application.
| Process Name | Log File |
|---|---|
| sd.access.log | /var/log/ apache2-service_dispatcher/ssl_access.log |
| ssl.access.log | /var/log/apache2/ssl_access.log |
| apache2.error.log | /var/log/apache2/error.log |
| apache2-webservices.error.log | /var/log/apache2-webservices/error.log |
| apache2-service_dispatcher.error.log | /var/log/apache2-service_dispatcher/error.log |
| auth.info.log | /var/log/auth.log |
| af.daemon.log | /var/log/daemon.log |
| clamav.runtime | /var/log/clamav/runtime.log |
| rabbitmq.localhost | /var/log/rabbitmq/rabbit@localhost.log |
| docker.log | /var/log/docker.log |
| exim.log | /var/log/exim4/mainlog |
| clamav.freshclam | /var/log/clamav/freshclam.log |
| amazon.ssm.agent | /var/log/amazon/ssm/amazon-ssm-agent.log |
| amazon-ssm-agent.error | /var/log/amazon/ssm/errors.log |
4.4.3.6 - Viewing User Notifications
All the messages that display when you log in to either to the Web UI or CLI Manager can be viewed here as well.
To view the user notifications, login to the CLI Manager, navigate to Status and Logs > User Notifications.

4.4.4 - Working with Administration
Appliance administration is the most important part of the appliance framework. Most of the administrative tools and tasks can be performed using the Administration menu of the CLI Manager.
The following screen illustrates the Administration screen on the CLI Manager.

Some of the administration tasks, such as creating clustered environment or setting up the virtualization can be done only in the CLI Manager by selecting the Administration menu. Most of the administration tasks can be performed using the Web UI.
4.4.4.1 - Working with Services
You can manually start and stop appliance services.
To view all appliance services and their statuses, login to the CLI Manager, navigate to Administration > Services.
Use caution before stopping or restarting a particular service. Make sure that no important actions are being performed by other users using the service that must be stopped or restarted.
Some services, such as, LDAP Proxy auth, member source services, and so on, are available after they have been successfully configured on ESA.
In the Services dialog box, you can start, stop, or restart the following services:
Table 1. Appliance Services
| Services | ESA | DSG |
| OS | ✓ | ✓ |
| Web UI, Secure Shell (SSH), Firewall, Real-time Graphs, SNMP Service, NTP Service, Cluster Status, Appliance Heartbeat* Server, Appliance Heartbeat* Client, Log Filter Server, Messaging System, Appliance Queues Backend, Docker, Rsyslog Service | ||
| LDAP | ✓ | ✓ |
| LDAP Server, Name Service Cache Daemon | ||
| Web Services Engine | ✓ | ✓ |
| Web Services Engine | ||
| Service Dispatcher | ✓ | ✓ |
| Service Dispatcher | ||
| Logging | ✓ | |
| Management Server, Management Server Database, Reports Repository, Reporting Engine | ||
| Policy Management | ✓ | |
Policy Repository, HubController, PIM Cluster, Soft HSM
Gateway, Key Management Gateway, Member Source Service,
Meteringfacade, DevOps, Logfacade For more information about
the Meteringfacade and Logfacade services, refer to the section
Services. | ||
| Reporting Server | ✓ | |
| Reports repository and reporting engine | ||
| Distributed Filesystem File Protector | ✓ | |
DFS Cache Refresh | ||
| ETL Toolkit | ||
| ETL Server | ||
| Cloud Gateway | ✓ | |
| Cloud Gateway Cluster | ||
| td-agent | ✓ | ✓ |
| td-agent | ||
| Audit Store | ✓ | |
| Audit Store Repository | ||
| Audit Store Management | ||
| Analytics | ✓ | |
| Analytics, Audit Store Dashboards | ||
| RPS | ✓ |
* Heartbeat services are used to discover other appliance nodes present in the network. When Set operations, such as, set ESA communication or TAC are performed, then the available list of nodes are displayed due to this service. If these services are stopped, the available nodes are not visible while performing the above operations. However, the the IP address can be entered manually.For the appliance-heartbeat-server a fixed port is not required. This is because this service is not listening for an incoming message.Appliance-heartbeat-client allows listening the incoming messages and hence needs a fixed port, i.e., 10100.
You can change the status of any service when you select it from the list and choose Select. In the screen that follows the Service Management screen, select stop, start, or restart a service, as required.
When you apply any action on a particular service, the status message appears with the action applied. Press ENTER again to continue.
You can also use the Web UI to start or stop services. In the Web UI Services, you have additional options for stopping/starting services, such as Enable/Disable Auto-start for most of the services.
Important: Although the services can be started or stopped from the Web UI, the start/stop/restart action is restricted for some services, such as, networking, td-agent, docker, exim4, and so on. These services can be operated from the OS Console. Run the following command to start/stop/restart a service.
/etc/init.d/<service_name> stop/start/restart
For example, to start the docker service, run the following command.
/etc/init.d/docker start
4.4.4.2 - Setting Date and Time
You can adjust the date and time settings of ESA by navigating to Administration > Date and Time. You may need to do so if this information was entered incorrectly during initialization.
You can synchronize time with NTP Server using the Time Server (NTP) option (explained in the following paragraph), change time zone using the Set Time Zone option, change date using the Set Date option, or change time using the Set Time option. The information selected during installation is available beside each option.
Use an Up Arrow or Down Arrow key to change the values in the editable fields, such as Month/Year. Use any arrow key to navigate the calendar. Use the Tab key to navigate between the editable fields.

The first column in the calendar shows the corresponding week number
You can set the time and date using the Web UI as well.
For more information about setting the ESA time and date, refer to section Configuring Date and Time.
License, certificates, and date and time modifications
Date and time modifications may affect licenses and certificates. It is recommended to have time synchronized between Appliances and Protectors.
Configure NTP Time Server
You must enable or disable the NTP settings only from the CLI Manager or Web UI.
You can access the Configure Server NTP Time Server screen by navigating to Administration > Date and Time > Time Server option.

To enable NTP synchronization, you need to specify the NTP Server first and then enable NTP. Once the NTP Server is specified, the new time will be applied immediately.
The NTP synchronization may take some time and while it is in progress, the Synchronization Status displays In Progress. When it is over, the Synchronization Status displays Time Synchronized.
4.4.4.3 - Managing Accounts and Passwords
The ESA CLI Manager includes options to change password and permissions for multiple users through the CLI interface. The options available are listed as follows:
- Change My Password
- Manage Password and Local-Accounts
- Reset directory user-password
- Change OS root account password
- Change OS local_admin account password
- Change OS local_admin account permissions
- Manage internal Service-Accounts
- Manage local OS users
OS Users in Appliances
When you install an appliance, some users are installed to run specific services for the products.
When adding users, ensure that you do not add the OS users as policy users.
The following table describes the OS users that are available in your appliance.
| OS Users | Description |
|---|---|
| alliance | Handles DSG processes |
| root | Super user with access to all commands and files |
| local_admin | Local administrator that can be used when an LDAP user is not accessible |
| www-data | Daemon that runs the Apache, Service dispatcher, and Web services as a user |
| ptycluster | Handles TAC related services and communication between TAC through SSH. |
| service_admin and service_viewer | Internal service accounts used for components that do not support LDAP |
| clamav | Handles ClamAV antivirus |
| rabbitmq | Handles the RabbitMQ messaging queues |
| epmd | Daemon that tracks the listening address of a node |
| openldap | Handles the openLDAP utility |
| dpsdbuser | Internal repository user for managing policies |
Strengthening Password Policy
Passwords are a common way of maintaining a security of a user account. The strength and complexity of a password are some of the primary requirements of an enterprise to prevent security vulnerability. A weak password increases chances of a security breach. Thus, to ensure a strong password, different password policies are set to enhance the security of an account.
Password policies are rules that enforce validation checks to provide a strong password. You can set your password policy based on the enterprise ordinance. Some requirements of a strong password policy might include use of numerals, characters, special characters, password length, and so on.
The default requirements of a strong password policy for an appliance OS user are as follows.
- The password must have at least 8 characters.
- All the printable ASCII characters are allowed.
- The password must contain at least one character each from any of the following two groups:
- Numeric: Includes numbers from 0-9.
- Alphabets: Includes capitals [A-Z] and small [a-z] alphabets.
- Special characters: Includes ! " # $ % & ( ) * + , - . / : ; < > = ? @ [ \ ] ^ _ ` { | } ~
You can enforce password policy rules for the LDAP and OS users by editing the check_password.py file. This file contains a Python function that validates a user password. The check_password.py file is run before you set a password for a user. The password for the user is applied only after it is validated using this Python function.
For more information about password policy for LDAP users, refer here.
Enforcing Password Policy
The following section describes how to enforce your policy restrictions for the OS and LDAP user accounts.
To enforce password policy:
Login to the CLI Manager.
Navigate to Administration > OS Console.
Enter the root password and select OK.
Edit the check_password.py file using a text editor.
/etc/ksa/check_password.pyDefine the password rules as per your organizational requirements.
For more information about the password policy examples, refer here.
Save the file.
The password rules for the users in ESA are updated.
Examples
The following section describes a few scenarios about enforcing validation checks for the LDAP and OS users.
The check_password.py file contains the def check_password (password) Python function. In this function you can define your validations for the user password. This function returns a status code and a status message. In case of successful validation, the status code is zero and the status message is empty. In case of validation failure, the status code is non-zero and the status message contains the appropriate error message.
Scenario 1:
An enterprise wants to implement the following password rules:
- Length of the password should contain atleast 15 characters
- Password should contain digits
You must add the following snippet in the def check_password (password) function:
# Password length check
if len(password)<15: return (1,"Password should contain at least 15 characters")
# Password digits check
password_set=set(password)
digits=set(string.digits)
if ( password_set.intersection(digits) == set([]) ): return (2,"Password must contain digit)
Scenario 2:
An enterprise wants to implement the following password rule:
- Password should not contain 1234.
You must add the following snippet in the def check_password (password) function:
if password==1234:
return (1,"Password must not contain 1234")
return (0,None)
Scenario 3:
An enterprise wants to implement the following password rules:
- Password should contain a combination of uppercase, lowercase, and numbers.
You must add the following snippet in the def check_password (password) function:
digits=set(string.digits)
if ( password_set.intersection(digits) == set([]) ): return (2,"Password must contain numbers, upper, and lower case characters.")
# Force lowercase
lower_letters=set(string.ascii_lowercase)
if ( password_set.intersection(lower_letters) == set([]) ): return (2,"Password must contain numbers, upper, and lower case characters")
# Force uppercase
upper_letters=set(string.ascii_uppercase)
if ( password_set.intersection(upper_letters) == set([]) ): return (2,"Password must contain numbers, upper ,and lower case characters")
Changing Current Password
In situations where you need to change your current password due to suspicious activity or reasons other than password expiration, you can use the following steps.
For more information about appliance users, refer here.
To change the current password:
Login to the CLI Manager.
Navigate to Administration > Accounts and Passwords > Change My Password.
In the Current password field, type the current password.
In the New Password field, type the new password.
In the Retype Password field, retype the new password.
Select OK and press ENTER to save the changes.
Resetting Directory Account Passwords
You can change the password for any user existing in the internal LDAP directory. The user accounts and their security privileges as well as passwords are defined in the LDAP directory.
To be able to change the password for any LDAP user, you need to provide Administrative LDAP user credentials. You can also provide the old credentials of the LDAP user.
The LDAP Administrator is an admin user or the Directory Administrator assigned by admin. Admin can define Directory Administrators in the LDAP directory.
For more information about the internal LDAP directory, refer here.
To change a directory account password:
Login to the CLI Manager.
Navigate to Administration > Accounts and Passwords > Manage Passwords and Local-Accounts > Reset directory user-password.
In the displayed dialog box, in the Administrative LDAP user name or local_admin and Administrative user password fields, enter the Administrative LDAP user name and password. You can also use the local_admin credentials.
In the Target LDAP user field, enter the LDAP user name you wish to change the password for.
In the Old password field, enter the old password for the selected LDAP user. This step is optional.
In the New password field, enter a new password for the selected LDAP user.
In the Confirm new password field, re-enter a new password for the selected LDAP user.
Select OK and press ENTER to save the changes.
Changing the Root User Password
You may want to change the root user password due to security reasons, and this can only be done using the Appliance CLI Manager.
To change the root password:
Login to the CLI Manager.
Navigate to Administration > Accounts and Passwords > Manage Passwords and Local-Accounts > Change OS root account password.
In the Administrative user name and Administrative user password fields, enter the administrative user name and its valid password. You can also use the local_admin credentials.
In the Old root password field, enter the old password for the root user.
In the New root password field, enter the new password for the root user.
In the Confirm new password field, re-enter the new password for the root user.
Select OK and press ENTER to save the changes.
Changing the Local Admin Account Password
You can log into CLI Manager as a local_admin user if the LDAP is down or for LDAP maintenance. It is recommended that the local_admin account is not used for standard operations since it is primarily intended for maintenance tasks.
To change local_admin account password:
Login to the CLI Manager.
Navigate to Administration > Accounts and Passwords > Manage Passwords and Local-Accounts > Change OS local_admin account password.
In the Administrative user name and Administrative user password fields, enter the administrative user name and the old password for the local_admin. You can also use the Directory Server Administrator credentials.
In the New local_admin password field, enter new local_admin password.
In the Confirm new password filed, re-enter the new local_admin password.
Select OK and press ENTER to save changes.
Changing the Local Admin Account Permission
By default, the local_admin user cannot log into the Web UI. However, you can configure this access using the tool, which changes the local_admin account permissions.
For local_admin, the SSH permission is enabled, by default.
To change local_admin account permissions:
Login to the CLI Manager.
Navigate to Administration > Accounts and Passwords > Manage Passwords and Local-Accounts > Change OS local_admin account permissions.
In the dialog box displayed, in the Password field, enter the local_admin password.
Select OK.
Specify the permissions for the local_admin. You can either select SSH Access, Web-Interface Access, or both.
Select OK.
Changing Service Accounts Passwords
Service Account users are service_admin and service_viewer. They are used for internal operations of components that do not support LDAP, such as Management Server internal users, and Management Server Postgres database. You cannot log into the Appliance Web UI, Reports Management (for ESA), or CLI Manager using service accounts users. Since service accounts are internal OS accounts, they must be modified only in special cases.
To change service accounts:
Login to the CLI Manager.
Navigate to Administration > Accounts and Passwords > Manage Passwords and Local-Accounts > Manage internal ‘Service-Accounts’.
In the Account name and Account password fields, enter the Administrative user name and password.
Select OK.
In the dialog box displayed, in the Admin Service Account section, in the New password field, enter the new admin service account password.
In the Confirm field, re-enter the new admin service account password.
In the Viewer Service Account section, in the New password field, enter the new viewer service account password.
In the Confirm field, re-enter the new viewer service account password.
Select OK.
In the Service Account details dialog box, click Generate-Random to generate the new passwords randomly. Select OK.
Managing Local OS Users
Managing local OS user option provides you the ability to create users that need direct OS shell access. These users are allowed to perform non-standard functions, such as schedule remote operations, backup agents, run health monitoring, etc. This option also lets you manage passwords and permissions for the dpsdbuser, which is available by default when ESA is installed.
The password restrictions for OS users are as follows:
- For all OS users, you cannot repeat the last 10 passwords used.
- If an OS user signs in three times using an incorrect password, the account is locked for five minutes. You can unlock the user by providing the correct credentials after five minutes. If an incorrect password is provided in the subsequent sign-in attempt, the account is again locked for five minutes.
To manage local OS users:
Login to the CLI Manager.
Navigate to Administration > Accounts and Passwords > Manage Passwords and Local-Accounts > Manage local OS users.
Enter the root password and select OK.
In the dialog box displayed, select Add to add a new user or select an existing user as explained in following steps.
Select Add to create a new local OS user.
In the dialog box displayed, in the User name and Password fields, enter a user name and password for the new user. The & character is not supported in the Username field.
In the Confirm field, re-enter the password for the new user.
Select OK.
Select an existing user from the displayed list.
- You can select one of the following options from the displayed menu.
Table: User Options
Options Description Procedure Check password Validate entered password. - In the dialog box displayed, enter the password for the local OS user.
Validation succeededmessage appears.Update password Change password for the user. - In the dialog box displayed, in the
Old password field, enter the
Old password for the local OS user.This step is optional.
- In the New Password field, enter the New Password for the local OS user.
- In the Confirm field, re-enter the New Password for the local OS user.
Update shell Define shell access for the user. - In the dialog box displayed, select one of the
following options.
- No login access
/bin/fasle - Linux Shell -
/bin/bash - Custom
- No login access
Note
The default shell is set as No login access (/bin/false).Toggle SSH access Set SSH access for the user. Select the Toggle SSH access option and press ENTER to set SSH access to Yes. Note
The default is set as No when a user is created.Delete user Delete the local OS user and related home directory. Select the Delete user option and select Yes to confirm the selection.
Select Close to exit.
4.4.4.4 - Working with Backup and Restore
Using the Backup/Restore Center tool, you can create backups of configuration files and settings. Use the backups to restore a stable configuration if changes have caused problems. Before the Backup Center dialog box appears you will be prompted to enter the root password. You can select from a list of packages to be backed up.

When you import files or configurations, ensure that each component is selected individually.
For more information about using backup and restore using the Web UI, refer Working with Backup and restore.
Exporting Data Configuration to Local File
Select the configurations to export to a local file. When you select Administration > Backup/Restore Center > Export data/configurations to a local file in the Backup Center screen, you will be asked to specify the packages to export. Before the Backup Center dialog box appears, you will be prompted to enter the root password.
Table: List of Appliance Specific Services
| Services | Description | Appliance Specific | |
| ESA | DSG | ||
Appliance OS Configuration | Export the OS configuration (networking, passwords, and
others) but not the security modules data. NoteIn the OS
configuration, the certificates component is classified as
follows:
| ✓ | ✓ |
Directory Server And Settings | Export the local directory server and authentication
settings. | ✓ | ✓ |
| Export Consul Configuration and Data | Export Consul configuration and data | ✓ | ✓ |
Backup Policy-Management *2 | Export policy management configurations and data, such
as, policies, data stores, data elements, roles, certificates,
keys, logs, Key Store-specific files and certificates among others
to a file. | ✓ | |
Backup Policy-Management Trusted Appliances
Cluster*2 | Export policy management configurations and data, such
as, policies, data stores, data elements, roles, certificates,
keys, logs, Key Store-specific files and certificates among others
to a specific cluster node for a Trusted Appliances
Cluster. NoteIt is recommended to use this option with
cluster export only. | ✓ | |
Backup Policy-Management Trusted Appliances Cluster
without Key Store*1 | Export policy management configurations and data, such
as, policies, data stores, data elements, roles, certificates,
keys, logs among others, but excluding the Key Store-specific
files and certificates to a specific cluster node for a Trusted
Appliances Cluster. NoteThis option excludes the backup of
the Key Store-specific files and certificates. It is
recommended to use this option with cluster export
only. | ✓ | |
Policy Manager Web UI Settings | Export the Policy Management Web UI settings that
includes the Delete permissions specified for
content and audit logs. | ✓ | |
Export All PEP Server Configuration, Logs, Keys,
Certs | Export the data (.db files, license, token elements,
etc.), configuration files, keys, certificates and log
files. | ✓ | |
Export PEP Server Configuration Files | Export all PEP Server configuration files
(.cfg). | ✓ | |
Export PEP Server Log Files | Export PEP Server log files (.log and .dat). | ✓ | |
Export PEP Server Key and Certificate Files | Export PEP Server Key and Certificate files (.bin, .crt,
and .key). | ✓ | |
Export PEP Server Data Files | Export all PEP Server data files (.db), license, token
elements and log counter files. | ✓ | |
Application Protector Web Service | Export Application Protector Web Service configuration
files. | ||
Export Storage and Share Configuration Files | Export all configuration files including NFS, CIFS, FTP,
iSCSI, Webdav. | ||
Export File Protector Configuration Files | Export all File Protector configuration
files. | ||
Export ETL Jobs | Export all ETL job configuration files. | ||
Export Gateway Configuration Files | ✓ | ||
Export Gateway Log Files | ✓ | ||
Cloud Utility AWS | Exports Cloud Utility AWS CloudWatch configuration files. | ✓ | ✓ |
*1 Ensure that only one backup-related option is selected among the options Backup Policy-Management, Backup Policy-Management Trusted Appliances Cluster, and Backup Policy-Management Trusted Appliances Cluster without Key Store. The Backup Policy-Management option must be used to back up the data to a file. In this case, this backup file is used to restore the data to the same machine, at a later point in time.
*2The Backup Policy-Management Trusted Appliances Cluster option must be used to replicate the data to a specific cluster node in the Trusted Appliances Cluster (TAC). This option excludes the backup of the metering data. It is recommended to use this option with cluster export only.
If you want to exclude the Key Store-specific files during the TAC replication, then the Backup Policy-Management Trusted Appliances Cluster without Key Store option must be used to replicate the data. Doing this excludes the Key Store-specific files and certificates, to a specific cluster node in the TAC.
This option excludes the backup of the metering data and the Key Store-specific files and certificates.
It is recommended to use this option with cluster export only.
For more information about the Backup Policy-Management Trusted Appliances Cluster option or the Backup Policy-Management Trusted Appliances Cluster without Key Store option, refer to the section ** TAC Replication of Key Store-specific Files and Certificates** in the Protegrity Key Management Guide 9.1.0.0.
If the OS configuration export is selected, then only the network setting and passwords, among others, are exported. The data and configuration of the security modules are not included. This data is mainly used for replication or recovery.
Before you import the data, note the OS and network settings of the target machine. Ensure that you do not import the saved OS and network settings to the target machine as this creates two machines with the same IP address in your network.
If you need to import all appliance configuration and settings, then perform a full restore for the system configuration. The following will be imported:
- OS configuration and network
- SSH and certificates
- Firewall
- Services status
- Authentication settings
- File Integrity Monitor Policy and settings
To export data configurations to a local file:
Login to the CLI Manager.
Navigate to Administration > Backup/Restore Center.
Enter the root password and select OK.
The Backup Center dialog box appears.
From the menu, select the Export data/configurations to a local file option.
Select the packages to export and select OK.
In the Export Name field, enter the required export name.
In the Password field, enter the password for the backup file.
In the Confirm field, re-enter the specified password.
If required, then enter description for the file.
Select OK.
You can optionally save the logs for the export operation when the export is done:
Click the More Details button.
The export operation log will display.
Click the Save button to save the export log.
In the following dialog box, enter the export log file name.
Click OK.
Click Done to exit the More Details screen.
The newly created configuration file will be saved into /products/exports. It can be accessed from the CLI Manager, the Exported Files and Logs menu, or the Import tab available in the Backup/Restore page, available in the Web UI.
The export log file can be accessed from the CLI Manager, the Exported Files and Logs menu, or the Log Files tab available in the Backup/Restore page, available in the Web UI.
Exporting Data/Configuration to Remote Appliance
You can export backup configurations to a remote appliance.
Important : When assigning a role to the user, ensure that the Can Create JWT Token permission is assigned to the role.If the Can Create JWT Token permission is unassigned to the role of the required user, then exporting data/configuration to a remote appliance fails.To verify the Can Create JWT Token permission, from the ESA Web UI navigate to Settings > Users > Roles.
Follow the steps in this scenario for a successful export of the backup configuration:
Login to the CLI Manager.
Navigate to Administration > Backup/Restore Center.
Enter the root password and select OK.
The Backup Center dialog box appears.
From the menu, select the Export data/configurations to a remote appliance(s) option and select OK.
From the Select file/configuration to export dialog box, select Current (Active) Appliance Configuration package to export and select OK.
In the following dialog box, select the packages to export and select OK.
Enter the password for this backup file.
Select the Import method.
For more information on each import method, select Help.
Type the IP address or hostname for the destination appliance.
Type the admin user credentials of the remote appliance and select Add.
In the information dialog box, press OK.
The Backup Center screen appears.
Exporting Appliance OS Configuration
When you import the appliance core configuration from the other appliance, the second machine will receive all network settings, such as, IP address, and default gateway, among others.
You should not import all network settings to another machine since it will create two machines with the same IP in your network. It is recommended to restart the appliance after receiving an appliance core configuration backup.
This item shows up only when exporting to a file.
Importing Data/Configurations from a File
You can import (restore) data from a file if you need to restore a specific configuration that you have previously saved. When you import files or configurations, ensure that each component is selected individually. During data configurations import, you are asked to enter the file password set during the backup file creation. Export and import Insight certificates on the same ESA. If the configurations must be imported on a different ESA, then do not import Certificates. For copying Insight certificates across systems, refer to Rotating Insight certificates.
To import data configurations from file:
Login to the CLI Manager.
Navigate to Administration > Backup/Restore Center.
Enter the root password and select OK.
The Backup Center dialog box appears.
From the menu, select the Import data/configurations from a file option and select OK.
In the following dialog box, select a file from the list which will be used for the configuration import.
Select OK.
In the following dialog box, enter the password for this backup file.
Select Import method.
Select OK.
In the information dialog box, select OK.
The Import Operation Has Been Completed Successfully message appears.
Consider a scenario when importing a policy management backup that includes the external Key Store data. If the external Key Store is not working, then the HubController service does not start post the restore process.
Select Done.
The Backup Center screen appears.
Reviewing Exported Files and Logs
You can review the exported files and logs.
To review exported files and logs:
Login to the CLI Manager.
Navigate to Administration > Backup/Restore Center.
Enter the root password and select OK.
The Backup Center dialog box appears.
From the menu, select the Exported Files and Logs option.
In the Exported Files and Logs dialog box, select Main Logfile to view the logs.
Select Review.
To view the Operation Logs or Exported Files, select it from the list of available exported files.
Select Review.
Select Back to return to the Backup Center dialog box.
Deleting Exported Files and Logs
To delete exported files and logs:
Login to the CLI Manager.
Navigate to Administration > Backup/Restore Center.
Enter the root password and select OK.
The Backup Center dialog box appears.
From the menu, select the Exported Files and Logs option.
In the Exported Files and Logs dialog box, select the Operation Logs and Exported Files.
Select Delete.
To confirm the deletion, select Yes.
Alternatively, to cancel the deletion, select No.
Backing Up/Restoring Local Backup Partition
The backup is created on the second partition of the local machine.
Thus, for example, if you make an OS full backup in the PVM mode (both Appliance and Xen Server are set to PVM), enable HVM mode, and then reboot the Appliance, you will not be able to boot the system in system-restore mode.
XEN Virtualization
If you are using virtualization, and have backed up the OS in HVM/PVM mode, then you can to restore only in the mode you backed it up (refer here).
Backing up Appliance OS from CLI
It is recommended to perform the full OS back up before any important system changes, such as appliance upgrade or creating a cluster, among others.
To back up the appliance OS from CLI Manager:
Login to the Appliance CLI Manager.
Proceed to Administration > Backup/Restore Center.
The Backup Center screen appears.
Select Backup all to a local backup-partition.
The following screen appears.

Select OK.
The Backup Center screen appears and the OS backup process is initiated.
Login to the Appliance Web UI.
Navigate to Dashboard.
The following message appears after the OS backup completes.

CAUTION: The Restore from backup-partition option appears in the Backup Center screen, after the OS backup is complete.
Restoring Appliance OS from Backup
While performing the OS restore operation, ensure that only console is used. This operation must not be performed using the CLI Manager.
To restore the appliance OS from backup:
Login to the Appliance CLI Manager.
Navigate to the Administration > Reboot and Shutdown > Reboot.
The Reboot screen appears.
Enter the reason and select OK.
Enter the root password and select OK.
The appliance reboots and the following screen appears.
This screen has a timeout of 10 seconds. If no action is performed on this screen, then the system restarts in Normal mode and the System-Restore does not happen.
Select System-Restore.
The Welcome to System Restore Mode screen appears.
Select Initiate OS-Restore Procedure.
The OS restore procedure is initiated.
4.4.4.5 - Setting Up the Email Server
You can set up an email server that supports the notification features in Protegrity Reports. The Protegrity Appliance Email Setup tool guides you through the setup.
Keep the following information available before the setup process:
- SMTP server details.
- SMTP user credentials.
- Contact email account: This email address is used by the Appliance to send user notifications.
Remember to save the email settings before you exit the Email Setup tool.
To set up the Email Server:
Login to the ESA CLI Manager.
Navigate to Administration > Email (SMTP) Settings.
The Protegrity Appliance Email Setup wizard appears.
Enter the root password and select OK.
The Protegrity Appliance Email Setup screen appears.
Select OK to continue. You can select Cancel to skip the Email Setup.
In the SMTP Server Address field, type the address to the SMTP server and the port number that the mail server uses.
For SMTP Server, the default port is 25.
In the SMTP Username field, enter the name of the user in the mail server.
Protegrity Reporting requires a full email address in the Username.
In the SMTP Password and Confirm Password fields, enter the password of the mail server user. SMTP Username/Password settings are optional. If your SMTP does not require authentication, then you can leave these fields empty.
In the Contact address field, enter the email recipient address.
In the Host identification field, enter the name of the computer hosting the mail server.
Select OK.
The tool tests the connectivity and the Secured SMTP screen appears.
Specify the encryption method. Select StartTLS or disable encryption. SSL/TLS is not supported.
Click OK.
In the SMTP Settings screen that appears, you can:
| To… | Follow these steps… |
| Send a test email |
|
| Save the settings |
|
| Change the settings | Select Reconfigure. The SMTP Configuration screen appears. |
| Exit the tool without saving |
|
4.4.4.6 - Working with Azure AD
Azure Active Directory (Azure AD) is a cloud-based identity and access management service. It allows access to external (Azure portal) and internal resources (corporate appliances). Azure AD manages your cloud and on-premise applications and protects user identities and credentials.
When you subscribe to Azure AD, it automatically creates an Azure AD tenant. After the Azure AD tenant is created, register your application in the App Registrations module. This acts like an end-point for the appliance to connect to the tenant.
Using the Azure AD configuration tool, you can:
- Enable the Azure AD Authentication and manage user access to the ESA.
- Import the required users or groups to the ESA, and assign specific roles to them.
4.4.4.6.1 - Configuring Azure AD Settings
Before configuring Azure AD Settings on the ESA, you must have the following values that are required to connect the ESA with the Azure AD:
- Tenant ID
- Client ID
- Client Secret or Thumbprint
For more information about the Tenant ID, Client ID, Authentication Type, and Client Secret/Thumbprint, search for the text Register an app with Azure Active Directory on Microsoft’s Technical Documentation site at: https://learn.microsoft.com/en-us/docs/
The following are the list of the API permissions that must be granted.
- Group.Read.All
- GroupMember.Read.All
- User.Read
- User.Read.All
To assign API permissions in Microsoft Azure, contact your Microsoft Azure administrator.
For more information about configuring the application permissions in the Azure AD, please refer https://learn.microsoft.com/en-us/graph/auth-v2-service?tabs=http
Ensure that the Allow public client flows setting is Enabled. To enable the Allow public client flows setting, navigate to Authentication > Advanced settings, click the toggle button, and select Yes.
To configure Azure AD settings:
On the ESA CLI Manager, navigate to Administration > Azure AD Configuration.
Enter the root password.
The Azure AD Configuration dialog box appears.
Select Configure Azure AD Settings.
The Azure AD Configuration screen appears.

Enter the information for the following fields.
Table: Azure AD Settings
Setting Description Set Tenant ID Unique identifier of the Azure AD instance Set Client ID Unique identifier of an application created in Azure AD Set Auth Type Select one of the Auth Type: SECRETindicates a password-based authentication. In this authentication type, the secrets are symmetric keys, which the client and the server must know.CERTindicates a certificate-based authentication. In this authentication type, the certificates are the private keys, which the client uses. The server validates this certificate using the public key.
Set Client Secret/Thumbprint The client secret/thumbprint is the password of the Azure AD application. - If the Auth Type selected is SECRET, then enter Client Secret.
- If the Auth type selected is CERT, then enter Client Thumbprint.
Disable Password Login Enable or disable password-based login for Azure AD Users.
Select the Disable Password Login. The Disable Password Login screen appears.- Select Yes to disable password based logins for Azure AD users.
- Select No to retain the password based login enabled for Azure AD users.
For more information about the Tenant ID, Client ID, Authentication Type, and Client Secret/Thumbprint, search for the text Register an app with Azure Active Directory on Microsoft’s Technical Documentation site at: https://learn.microsoft.com/en-us/docs/
Click Test to check the configuration/settings.
The message Successfully Done appears.
Click OK.
Click Apply to apply and save the changes.
The message Configuration saved successfully appears.
Click OK.
4.4.4.6.2 - Enabling/Disabling Azure AD
Using the Enable/Disable Azure AD option, you can enable or disable the Azure AD settings. You can import users or groups and assign roles when you enable the Azure AD settings.
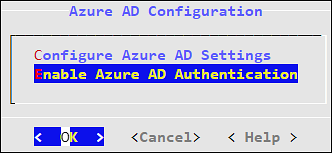
4.4.4.7 - Accessing REST API Resources
User authentication is the process of identifying someone who wants to gain access to a resource. A server contains protected resources that are only accessible to authorized users. When you want to access any resource on the server, the server uses different authentication mechanism to confirm your identity.
There are different mechanisms for authenticating and authorizing users in a system. In the ESA, REST API services are only accessible to authorized users. You can authorize or authenticate users using one of the following authentication mechanisms:
- Basic Authentication with username and password
- Client Certificates
- Tokens
4.4.4.7.1 - Using Basic Authentication
In the Basic Authentication mechanism, you provide only the user credentials to access protected resources on the server. You provide the user credentials in an authorization header to the server. If the credentials are accurate, then the server provides the required response to access the APIs.
If you want to access the REST API services on ESA, then the IP address of ESA with the username and password must be provided. The ESA matches the credentials with the LDAP or AD. On successful authentication, the roles of the users are verified. The following conditions are checked:
- If the role of the user is Security Officer, then the user can run GET, POST, and DELETE operations on the REST APIs.
- If the role of the user is Security Viewer, then the user can only run GET operation on the REST APIs.
When the Basic Authentication is disabled, then a list of APIs are affected. For more information about the list of APIs, refer here.
The following Curl snippet provides an example to access an API on ESA.
curl -i -X <METHOD> "https://<ESA IP address>:8443/<path of the API>" -d "loginname=<username>&password=<password>"
This command uses an SSL connection. If the server certificates are not configured on ESA, you can append --insecure to the curl command.
For example,
curl -i -X <METHOD> "https://<ESA IP address>:8443/<path of the API>" -d "loginname=<username>&password=<password>" --insecure
You must provide the username and password every time you access the REST APIs on ESA.
4.4.4.7.2 - Using Client Certificates
The Client Certificate authentication mechanism is a secure way of accessing protected resources on a server. In the authorization header, you provide the details of the client certificate. The server verifies the certificate and allows you to access the resources. When you use certificates as an authentication mechanism, then the user credentials are not stored in any location.
Note: As a security feature, it is recommended to use the client certificates that are protected with a passphrase.
On ESA, the Client Certificate authentication includes the following steps:
- In the authorization header, you must provide the details, such as, client certificate, client key, and CA certificate.
- The ESA retrieves the name of the user from the client certificate and authenticates it with the LDAP or AD.
- After authenticating the user, the role of that user is validated:
- If the role of the user is Security Officer, then the user can run read and write operations on the REST APIs.
- If the role of the user is Security Viewer, then the user can only run read operations on the REST APIs.
- On successful authentication, you can utilize the API services.
The following Curl snippet provides an example to access an API on ESA.
curl -k https://<ESA IP Address>/<path of the API> -X <METHOD> --key <client.key> --cert <client.pem> --cacert <CA.pem> -v --insecure
You must provide your certificate every time you access the REST APIs on ESA.
4.4.4.7.3 - Working with JSON Web Token (JWT)
Tokens are reliable and secure mechanisms for authorizing and authenticating users. They are stateless objects created by a server that contain information to identify a user. Using a token, you can gain access to the server without having to provide the credentials for every resource. You request a token from the server by providing valid user credentials. On successive requests to the server, you provide the token as a source of authentication instead of providing the user credentials.
There are different mechanisms for authenticating and authorizing users using tokens. Authentication using JSON Web Tokens (JWT) is one of them. The JWT is an open standard that defines a secure way of transmitting data between two entities as JSON objects.
One of the common uses of JWT is as an API authentication mechanism that allows you to access the protected API resources on your server. You present the JWT generated from the server to access the protected APIs. The JWT is signed using a secret key. Using this secret key, the server verifies the token provided by the client. Any modification to the JWT results in an authentication failure. The information about tokens is not stored on the server.
Only a privileged user can create a JWT. To create a token, ensure that the Can Create JWT Token permission/privilege is assigned to the user role.
The JWT consists of the following three parts:
- Header: The header contains the type of token and the signing algorithm, such as, HS512, HS384, or HS256.
- Payload: The payload contains the information about the user and additional data.
- Signature: Using a secret key, you create the signature to sign the encoded header and payload.
The header and payload are encoded using the Base64Url encoding. The following is the format of JWT:
<encoded header>.<encoded payload>.<signature>
4.4.4.7.3.1 - Using JWT
Implementing JWT
On Protegrity appliances, you must have the required authorization to access the REST API services. The following figure illustrates the flow of JWT on the appliances.
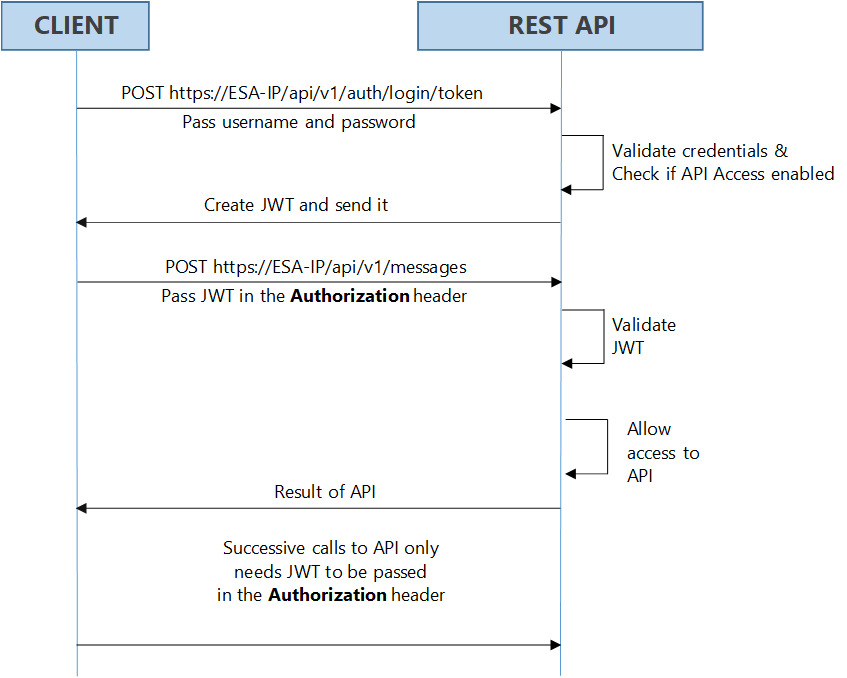
As shown in the figure, login with your credentials to access the API. The credentials are validated against a local or external LDAP. A verification is performed to check the API access for the username. After the credentials are validated, a JWT is created and sent to the user as an authentication mechanism. Using JWT, information can be verified and trusted as it is digitally signed. The JWTs can be signed using a secret with the HMAC algorithm or a private key pair using RSA. After you successfully login using your credentials, a JWT is returned from the server. When you want to access a protected resource on the server, you must send the JWT with the request in the headers.
Working with the Secret Key
The JWT is signed using a private secret key and sent to the client to ensure message is not changed during transmission. The secret key encodes that token sent to the client. The secret key is only known to the server for generating new tokens. The client presents the token to access the APIs on the server. Using the secret key, the server validates the token received by the client.
The secret key is generated when you install or upgrade your appliance. You can change the secret key from the CLI Manager. This secret key is stored in the appliance in a scrambled form.
For more information about setting the secret key, refer to section Configuring JWT
For appliances in a TAC, the secret key is shared between appliances in the cluster. Using the export-import process for a TAC, secret keys are exported and imported between the appliances.
If you want to export the JWT configuration to a file or another machine, ensure to select the Appliance OS Configuration option, on the Export screen. Similarly, if you want to import the JWT configurations between appliances in a cluster, from the Cluster Export Wizard screen, select the Appliances JWT Configuration check box, under Appliance OS Configuration.
For example, consider ESA 1 and ESA 2 in a TAC setup.
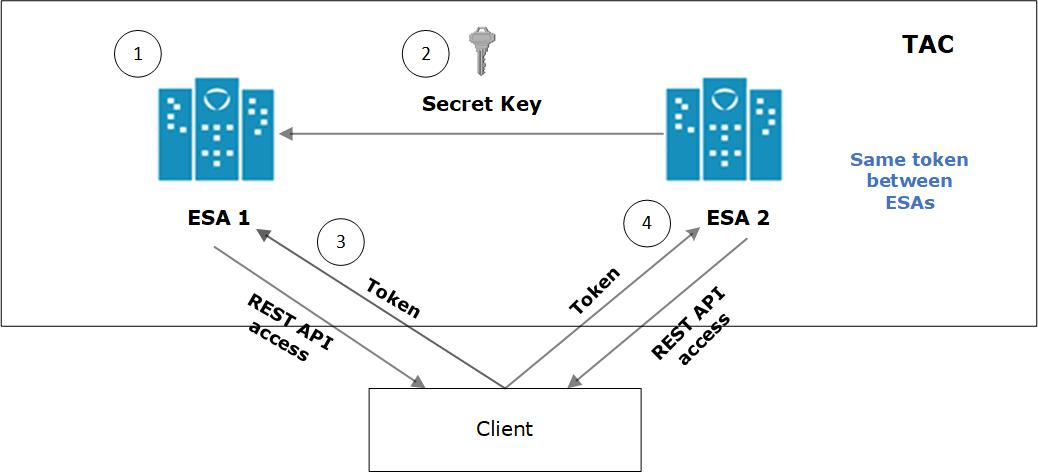
- JWT is created on ESA 1 for client application using a secret key.
- ESA 1 and ESA 2 are added to TAC. The secret key of ESA 1 is shared with ESA 2.
- Client application requests API access from ESA 1. A JWT is generated and shared with the client application. The client accesses the APIs available in ESA 1.
- To access the APIs of ESA 2, the same token generated by ESA1 is applicable for authentication.
Configuring JWT
You can configure the encoding algorithm, secret key, and JWT token expiry.
To configure the JWT settings:
On the CLI Manager, navigate to Administration > JWT Configuration.
A screen to enter the root credentials appears.
Enter the root credentials and select OK.
The JWT Settings screen appears.
Select Set JWT Algorithm to set the algorithm for validating a token.
The Set JWT Algorithm screen appears.
Select the one of the following algorithms:
- HS512
- HS384
- HS256
Select OK.
Select Set JWT Secret to set the secret key.
The Set JWT Secret screen appears.
Enter the secret key in the New Secret and Confirm Secret fields.
Select OK.
Select Set Token Expiry to set the token expiry period.
In the Set Token Expiry field, enter the token expiry value and select OK.
Select Set Token Expiry Unit to set the unit for token expiry value.
Select second(s), minute(s), hour(s), day(s), week(s), month(s), or year(s) option and select OK.
Select Done.
Refreshing JWT
Tokens are valid for a certain period. When a token expires, you must request a new token by providing the user credentials. Instead of providing your credentials on every request, you can extend your access to the server resources by refreshing the token.
In the refresh token process, you request a new token from the server by presenting your current token instead of the username and password. The server checks the validity of the token to ensure that the current token is not expired. After the validity check is performed, a new token is issued to you for accessing the API resources.
In the Protegrity appliances, you can refresh the token by executing the REST API for token refresh.
4.4.4.7.3.2 - Generating JWT for REST APIs
This section provides reference information about the REST API that is used to generate JWT.
Base URL
https://{Appliance IP address}/api/v1/auth
In the base URL, Appliance IP address specifies the IP address of the specified ESA or DSG.
Path
/login/token
Method
POST
Request Body Parameters
The Request Body Parameters are used to authenticate the APIs.
| Parameter | Description | Data Type | Mandatory / Optional |
|---|---|---|---|
| loginname | Specify the name of the user that has access to generate JWT | String | Mandatory |
| password | Specify the password of the user | String | Mandatory |
Request
POST https://<Appliance IP address>/api/v1/auth/login/token
Response
| HTTP Status Code | Sample Response | Description |
|---|---|---|
| 200 OK | {"status": 0,"messages": [],"data": null} | The token is created |
| 401 Unauthorized | Incorrect credentials | |
| 400 Bad Request | {"status": 400, "messages":["Incorrect syntax"],"data": null} | Incorrect syntax |
| 403 Forbidden | User does not have permission to create JWT |
Response Definitions (Response Schema or Response Model)
| Response Item | Description | Data Type |
|---|---|---|
| status | Status of creation of the API requests | Boolean |
| messages | Response messages from API, such as, error messages, warnings, or information text | List |
| data | Data returned by API requests |
Response Headers
The generated token is available in the PTY_ACCESS_JWT_TOKEN field.
Exception
None
Sample Request
curl -X POST https://<Applaince IP address>/api/v1/auth/login/token -d "loginname=<username>&password=<password>"
Sample Response
{
"status": 0,
"messages": [],
"data": null
}
4.4.4.7.3.3 - Refreshing JWT for REST APIs
This section provides reference information about the REST API that is used to refresh JWT.
Base URL
https://{Appliance IP address}/api/v1/auth
In the base URL, Appliance IP address specifies the IP address of the specified ESA or DSG.
Path
/login/token/refresh
Method
POST
Request Body Parameters
None
Request
POST https://<Appliance IP address>/api/v1/auth/login/token/refresh
Request Header
Key Name: Authorization
Value: Bearer <token>
Response
| HTTP Status Code | Sample Response | Description |
|---|---|---|
| 200 OK | {"status": 0,"messages": [],"data": null} | The token is refreshed |
| 401 Unauthorized | Invalid Token | |
| 403 Forbidden | User does not have privilege to refresh JWT |
Response Definitions (Response Schema or Response Model)
| Response Item | Description | Data Type |
|---|---|---|
| status | Status of creation of the API requests | Boolean |
| messages | Response messages from API, such as, error messages, warnings, or information text | List |
| data | Data returned by API requests |
Response Header
The refreshed token is available in the PTY_ACCESS_JWT_TOKEN field.
Exception
None
Sample Request
curl -X POST https://<Appliance IP address>/api/v1/auth/login/token/refresh -H 'Authorization: Bearer <token>'
Sample Response
{
"status": 0,
"messages": [],
"data": null
}
4.4.4.8 - Securing the GRand Unified Bootloader
When a system is powered on, it goes through a boot process before loading the operating system, where an initial set of operations are performed for the system to function normally. The boot process consists of different stages, such as, checking the system hardware, initializing the devices, and loading the operating system.
When the system is powered on, the BIOS performs the Power-On Self-Test (POST) process to initialize the hardware devices attached to the system. It then executes the Master Boot Record (MBR) that contains information about the disks and partitions. The MBR then executes the GRand Unified Bootloader (GRUB).
The GRUB is an operation that identifies the file systems and loads boot images. The GRUB then passes control to the kernel for loading the operating system. The entries in the GRUB menu can be edited by pressing e or c to access the GRUB command-line. Some of the entries that you can modify using the GRUB are listed below:
- Loading kernel images.
- Switching kernel images.
- Logging into single user mode.
- Recovering root password.
- Setting default boot entries.
- Initiating boot sequences.
- Viewing devices and partition, and so on.
In the Protegrity appliances, GRUB version 2 (GRUB 2) is used for loading the kernel. If the GRUB menu settings are modified by an unauthorized user with malicious intent, it can induce threat to the system. Additionally, as per CIS Benchmark, it is recommended to secure the boot settings. Thus, to enhance security of the Protegrity appliances, the GRUB menu can be protected by setting a username and password.
- This feature available only for on-premise installations.
- It is recommended to reset the credentials at regular intervals to secure the system.
The following sections describe about setting user credentials for accessing the GRUB menu on the appliance.
4.4.4.8.1 - Enabling the Credentials for the GRUB Menu
You can set a username and password for the GRUB menu from the ESA CLI Manager.
The user created for the GRUB menu is neither a policy user nor an ESA user.
Note: It is recommended you ensure a backup of the system has completed before performing the following operation.
To enable access to GRUB menu:
Login to the ESA CLI manager as an administrative user.
Navigate to Administration > GRUB Credentials Settings.
The screen to enter the root credentials appears.
Enter the root credentials and select OK.
The screen to Grub Credentials screen appears.
Select Enable and press ENTER.
The following screen appears.
Enter a username in the Username text box.
The requirements for the Username are as follows:
- It should contain a minimum of three and maximum of 16 characters
- It should not contain numbers and special characters
Enter a password in the Password and Re-type Password text boxes.
The requirements for the Password are as follows:
- It must contain at least eight characters
- It must contain a combination of alphabets, numbers, and printable characters
Select OK and press ENTER.
A message Credentials for the GRUB menu has been set successfully appears.
Restart the system.
The following screen appears.
Press e or c.
The screen to enter the credentials appears.
Enter the credentials provided in steps 4 and 5 to modify the GRUB menu.
4.4.4.8.2 - Disabling the GRUB Credentials
You can disable the username and password that is set for accessing the GRUB menu. When you disable access to the GRUB, then the username and password that are set get deleted. You must enable the GRUB Credentials Settings option and set new credentials to secure the GRUB again.
To disable access to the GRUB menu:
Login to the ESA CLI Manager as an administrative user.
Navigate to Administration > GRUB Credentials Settings.
The screen to enter the root credentials appears.
Enter the root credentials and select OK.
The GRUB credentials screen appears.
Select Disable and press ENTER.
A message Credentials for the GRUB menu has been disabled appears.
4.4.4.9 - Working with Installations and Patches
Using the Installations and Patches menu, you can install or uninstall products. You can also view and manage patches from this menu.
4.4.4.9.1 - Add/Remove Services
Using Add/Remove Services tool, you can install the necessary products or remove already installed ones, such as, Consul, Cloud-utility product, among others.
To install services:
Login to the ESA CLI Manager.
Navigate to Administration > Installations and Patches > Add/Remove Services.
Enter the root password to execute the install operation and select OK.

Select Install applications and select OK.

Select products to install and select OK.
- If a new product is selected, the installation process starts.
- If the product is already installed, then refer to step 6.
Select an already installed product to upgrade, uninstall, or reinstall, and select OK.
The Package is already installed screen appears. This step is not applicable for the DSG appliance.

Select any one of the following options:
Option Description Upgrade Installs a newer version of the selected product. Uninstall Removes the selected product. Reinstall Removes and installs the product again. Cancel Returns to the Administration menu. Select OK.
4.4.4.9.2 - Uninstalling Products
To uninstall products:
Login the ESA CLI Manager.
Proceed to Administration > Installations and Patches > Add or Remove Services.
Enter the root password to execute the uninstall operation and select OK.
Select Remove already installed applications and select OK.
The Select products to uninstall screen appears.
Select the necessary products to uninstall and select OK.
The selected products are uninstalled.
4.4.4.9.3 - Managing Patches
You can install and manage your patches from the Patch Management screen.
It allows you to perform the following tasks.
| Option | Description |
|---|---|
| List installed patches | Displays the list of all the patches which are installed in the system. |
| Install a patch | Allows you to install the patches. |
| Display Log | Displays the list of logs for the patches. |
Installing a Patch and Viewing Patch Information
To install a patch and view patch information:
Log in to the ESA CLI Manager.
Navigate to Administration > Patch Management.
Enter the root password and select OK.
The Patch Management screen appears.
Select Install a patch and select OK.
The Install Patch screen appears.
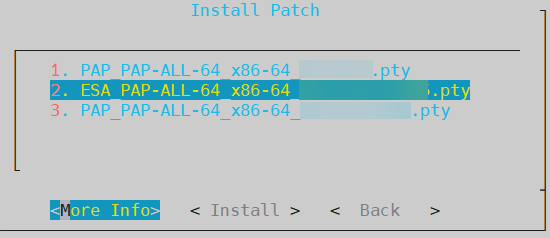
Select the required patch and select one of the following options to perform the corresponding operation.
Option Description More Info Displays the information for the selected patch. Install Installs the selected patch.
4.4.4.10 - Managing LDAP
LDAP is an open industry standard application protocol that is used to access and manage directory information over IP. You can consider it as a central repository of username and passwords, thus providing applications and services the flexibility to validate users by connecting with the LDAP.
The security system of the Appliance distinguishes between two types of users:
End users with specific access or no access to sensitive data. These users are managed through the User Management screen in the Web UI. For more information about user management, refer here.
Administrative users who manage the security policies, for example, “Admin” users who grant or deny access to end users.
In this section, the focus is on managing administrative users. The Administrative users connect to the management interfaces in Web UI or CLI, while the end users connect to the specific security modules they have been allowed access to. For example, a database table may need to be accessed by the end users, while the security policies for access to the table are specified by the Administrative users.
LDAP Tools available in the Administration menu include three tools explained in the following table.
| Tool | Description |
|---|---|
| Specify LDAP Server | Reconfigure all client-side components to use a specific LDAP. To authenticate users, the data security platform supports three modes for integration with directory services: Protegrity LDAP Server, Proxy Authentication, and Local LDAP Server. - Protegrity LDAP: In this mode, all administrative operations such as policy management, key management, etc. are handled by users that are part of the Protegrity LDAP. This mode can be used to configure or authenticate with either local or remote appliance product. - Proxy Authentication: In this mode, you can import users from an external LDAP to ESA. ESA is responsible for authorization of users, while the external LDAP is responsible for authentication of users. - Reset LDAP Server Settings: In this mode, an administrative user can reset the configuration to the default configuration using admin credentials. |
| Configure Local LDAP settings | Configure your LDAP to be accessed from the other machines. |
| Local LDAP Monitor | Examine how many LDAP operations per second are running. |
4.4.4.10.1 - Working with the Protegrity LDAP Server
Every appliance includes an internal directory service. This service can be utilized by other appliances for user authentication.
For example, a DSG instance might utilize the ESA LDAP for user authentication. In such cases, you can configure the LDAP settings of the DSG in the Protegrity LDAP Server screen. In this screen, you can specify the IP address of the ESA with which you want to connect.
You can add IP addresses of multiple appliances to enable fault tolerance. In this case, if connection to the first appliance fails, connection is transferred to next appliance in the list.
If you are adding multiple appliances in the LDAP URI, ensure that the values of the Bind DN, Bind Password, and Base DN is same for all the appliances in the list.
To specify Protegrity LDAP server:
Login to the Appliance CLI Manager.
Navigate to Administration > Specify LDAP Server.
Enter the root password and select OK.
In the LDAP Server Type screen, select Protegrity LDAP Server and select OK.
The following screen appears.

Enter information for the following fields.
Table 1. LDAP Server Settings
Setting Description LDAP URI Specify the IP address of the LDAP server you want to connect to in the following format. ldap://host:port. You can configure to connect Protegrity Appliance LDAP. For example,ldap://192.168.3.179:389.For local LDAP, enter the following IP address:ldap://127.0.0.1:389.If you specify multiple appliances, ensure that the IP addresses are separated by the space character.For example,ldap://192.1.1.1 ldap://10.1.0.0 ldap://127.0.0.1:389Base DN The LDAP Server Base distinguished name. For example: ESA LDAP Base DN: dc=esa,dc=protegrity,dc=com.Group DN Distinguished name of the LDAP Server group container. For example: ESA LDAP Group DN:ou=groups,dc=esa,dc=protegrity,dc=com.Users DN Distinguished name of the user container. For example: ESA LDAP Users DN:ou=people,dc=esa,dc=protegrity,dc=com.Bind DN Distinguished name of the LDAP Bind User. For example: ESA LDAP Bind User DN cn=admin, ou=people, dc=esa, dc=protegrity, dc=com.Bind Password The password of the specified LDAP Bind User. If you modify the bind user password, ensure that you use the Specify LDAP Server tool to update the changes in the internal LDAP.Bind UserThe bind user account password allows you to specify the user credentials used for LDAP communication. This user should have full read access to the LDAP entries in order to obtain accounts/groups/permissions.If you are using the internal LDAP, and you change the bind username/password, using Change a directory account option, then you must update the actual LDAP user. Make sure that a user with the specified username/password exists. Run Specify LDAP Server tool with the new password to update all the products with the new password. Refer to section Protegrity LDAP Server for details.Click Test to test the connection.
If the connection is established, then a Successfully Done message appears.
4.4.4.10.2 - Changing the Bind User Password
The following section describe the steps to change the password for the ldap_bind_user using the CLI manager.
To change the ldap_bind_user password:
Login to the ESA CLI Manager.
Navigate to Administration > Specify LDAP server/s.
Enter the root password and select OK.
Select Reset LDAP Server settings and select OK.
The following screen appears.
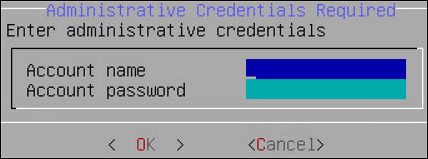
Enter the admin username and password and select OK.
The following screen appears.
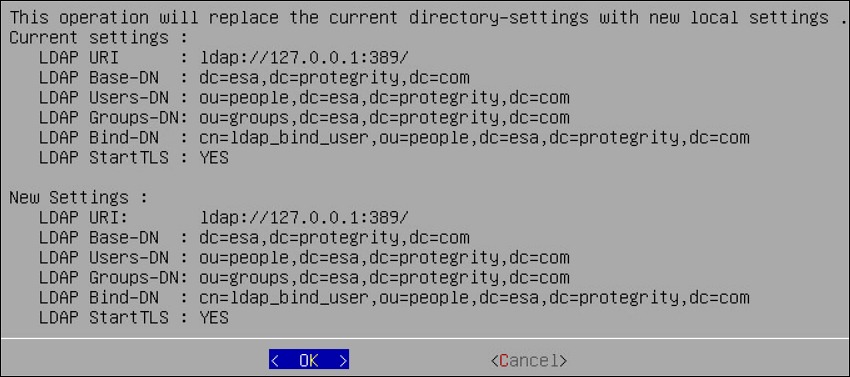
Select OK.
The following screen appears.
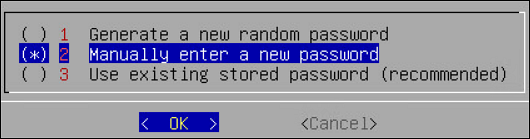
Select Manually enter a new password and select OK.
The following screen appears.
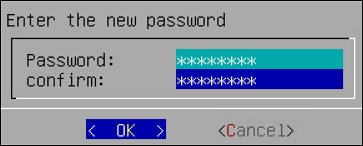
Enter the new password, confirm it, and select OK.
The following screen appears.
Select OK.
The password is successfully changed.
4.4.4.10.3 - Working with Proxy Authentication
Simple Authentication and Security Layer (SASL) is a framework that provides authentication and data security for Internet protocols. The data security layer offers data integrity and confidentiality services. It provides a structured interface between protocols and authentication mechanisms.
SASL enables ESA to separate authentication and authorization of users. The implementation is such that when users are imported, a user with the same name is recreated in the internal LDAP. When the user accesses the data security platform, ESA authorizes the user and communicates with the external LDAP for authenticating the user. This implementation ensures that organizations are not forced to modify their LDAP configuration to accommodate the data security platform. SASL is referred to as Proxy authentication in ESA CLI and Web UI.
To enable proxy authentication:
Login to the Appliance CLI Manager.
Navigate to Administration > LDAP Tools > Specify LDAP Server.
Enter the root password and select OK.
Select Set Proxy Authentication.
Specify the LDAP Server settings for proxy authentication with the external LDAP as shown in the following figure.

For more information about the LDAP settings, refer to Proxy Authentication Settings.
Select Test to test the settings provided. Select Test to test the settings provided. When Test is selected, ESA verifies if the connection to the external LDAP works, as per the Proxy Authentication settings provided.
The Bind Password is required when Bind DN is provided message appears.
Select OK.
Enter the LDAP user name and password provided as the bind user.
You can provide username and password of any other user from the LDAP as long as the LDAP Filter field exists in both the bind user name and any other user.
A Testing Proxy Authentication-Completed successfully message appears.
Select OK in the following message screen.
The following confirmation message appears.
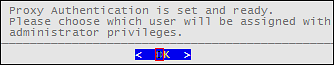
Select Apply to apply the settings. In ESA CLI, only one user is allowed to be imported. This user is granted admin privileges, such that importing users and managing users can be performed by the user in the User Management screen. The User Management Web UI is used to import users from the external LDAP.
In the Select user to grant administrative privileges screen, select a user and confirm selection.
In the Setup administrator privileges screen, enter the ESA admin user name and password and select OK.
The following message appears.
Navigate to Administration > Services to verify that the Proxy Authentication Service is running.
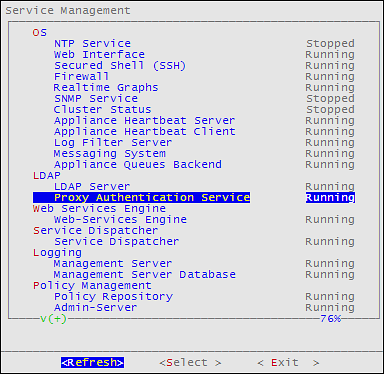
4.4.4.10.4 - Configuring Local LDAP Settings
The local LDAP settings are enabled on port 389 by default.
To specify local LDAP server configuration:
Login to the ESA CLI Manager.
Navigate to Administration > Configure local LDAP settings.
Enter the root password and select OK.
The following screen appears.

In the LDAP listener IP address field, enter the LDAP listener IP address for local access. By default, it is 127.0.0.1.
In the LDAPS (SSL) listener IP address field, enter the LDAPS SSL listener IP address for remote access. It is 0.0.0.0 or a specific valid address for your remote LDAP directory.
Select OK.
4.4.4.10.5 - Monitoring Local LDAP
Local LDAP Monitor tool allows you to examine, in real time, how many LDAP operations per second are currently running, which is very useful to enhance the performance. You can use this tool to monitor the following tasks:
- Check LDAP Connectivity for LDAP Bind and LDAP Search.
- Modify or optimize LDAP cache, threading, and memory settings to improve performance and remove bottlenecks.
- Measure “number of changes” and “last modified date and time” on the LDAP server, which can be useful, for example, for verifying export/import operations.

4.4.4.10.6 - Optimizing Local LDAP Settings
When the Local LDAP receives excessive requests, the requests are cached. However, if the the cache is overloaded, it causes the LDAP to become unresponsive. From v9.1.0.3, a standard set of values for the cache that is required for optimal handling of the LDAP requests is set in the system. After you upgrade to v9.1.0.3, you can tune the cache parameters for the Local LDAP configuration. The default values for the cache parameters is shown in the following list.
- The slapd.conf file in the /etc/ldap directory contains the following cache values:
- cachesize 10000 (10,000 entries)
- idlcachesize 30000 (30,000 entries)
- dbconfig set_cachesize 0 209715200 0 (200 MB)
- The DB_CONFIG file in the /opt/ldap/db* directory contains the following the cache values:
- set_cachesize 0 209715200 0 (200 MB)
Based on the setup and the environment in the organization, you can choose to increase the parameters.
Ensure that you back up the files before editing the parameters.
- On the CLI Manager, navigate to Administration > OS Console.
- Edit the values for the required parameters.
- Restart the slapd service using the /etc/init.d/slapd restart command.
4.4.4.11 - Rebooting and Shutting down
You can reboot or shut down your appliance if necessary using Administration > Reboot and Shutdown. Make sure the Data Security Platform users are aware that the system is being rebooted or turned off and no important tasks are being performed at this time.
Cloud platforms and power off
For cloud platforms, it is recommended to shut down or power off the CLI Manager or Appliance Web UI. With cloud platforms, such as Azure, AWS, or GCP, the instances run the appliance.
4.4.4.12 - Accessing the OS Console
You can access OS console using Administration > OS Control. You require root user credentials to access the OS console.
If you have System Monitor settings enabled in the Preferences menu, then the OS console will display the System Monitor screen upon entering the OS console.
To enable the System Monitor setting:
Login to the ESA CLI Manager.
Navigate to Preferences.
Enter the root password and select OK.
The Preferences screen appears.
Select Show System-Monitor on OS-Console.
Press Select.
Select Yes and select OK.
Select Done.
4.4.5 - Working with Networking
Networking Management allows configuration of the ESA network settings such as, host name, default gateway, name servers, and so on. You can also configure SNMP settings, network bind services, and network firewall.
From the ESA CLI Manager, navigate to Networking to manage your network settings.
The following figure shows the Networking Management screen.

| Option | Description |
|---|---|
| Network Settings | Customize the network configuration settings for your appliance. |
| SNMP Configuration | Allow a remote machine to query different performance status of the appliance, such as start the service, set listening address, show or set community string, or refresh the service. |
| Bind Services/ Addresses | Specify the network address or addresses for management and Web Services. |
| Network Troubleshooting Tools | Troubleshoot network and connectivity problems using the following Linux commands – Ping, TCPing, TraceRoute, MTR, TCPDump, SysLog, and Show MAC. |
| Network Firewall | Customize firewall rules for the network traffic. |
4.4.5.1 - Configuring Network Settings
When this option is selected, network configuration details added during installation are displayed. The network connection for the appliance are displayed. You can modify the network configuration as per the requirements.

Changing Hostname
The hostname of the appliance can be changed.
In the hostname field, if special characters are to be used, then only hyphen (-) is supported.
To change the hostname:
Login to the Appliance CLI Manager.
Navigate to Networking > Network Settings.
Select Hostname and select Edit.
In the Set Hostname field, enter a new hostname.
Select OK.
The hostname is changed.
Configuring Management IP Address
You can configure the management IP address for your appliance from the networking screen.
To configure the management IP address:
Login to the Appliance CLI Manager.
Navigate to Networking > Network Settings.
Select Management IP and select Edit.
In the Enter IP field, enter the IP address for the management NIC.
In the Enter Netmask field, enter the subnet for the management NIC.
Select OK.
The management IP is configured.
Configuring Default Route
The default route is a setting that defines the packet forwarding rule for a specific route. This parameter is required only if the appliance is on a different subnet than the Web UI or for the NTP service connection. If necessary, then request the default gateway address from your network administrator and set this parameter accordingly.
The default route is a setting that defines the packet forwarding rule for a specific route. The default route is the first IP address of the subnet for the management interface.
To configure the default route:
Login to the Appliance CLI Manager.
Navigate to Networking > Network Settings.
Select Default Route and press Edit.
Enter the default route and select Apply.
Configuring Domain Name
You can configure the domain name for your appliance from the networking screen.
To configure the domain name:
Login to the Appliance CLI Manager.
Navigate to Networking > Network Settings.
Select Domain Name and select Edit.
In the Set Domain Name field, enter the domain name.
Select Apply.
The domain name is configured.
Configuring Search Domain
You can configure a domain name that is used as in the domain search list.
To configure the search domain:
Login to the Appliance CLI Manager.
Navigate to Networking > Network Settings.
Select Search Domains and select Edit.
In the Search Domains dialog box, select Edit.
In the Edit search domain field, enter the domain name and select OK.
Select Add to add another search domain.
Select Remove to remove a search domain.
Configuring Name Server
You can configure the IP addresses for your domain name.
To configure the domain IP address:
Login to the Appliance CLI Manager.
Navigate to Networking > Network Settings.
Select Name Servers and select Edit.
In the Domain Name Servers dialog box, select Edit to modify the server IP address.
Select Remove to delete the domain IP address.
Select Add to add another domain IP address.
In the Add new nameserver field, enter the domain IP address and select OK.
The IP address for the domain is configured.
Assigning a Default Gateway to the NIC
To assign a default gateway to the NIC:
Login to the Appliance CLI Manager.
Navigate to Networking > Network Settings.
Select Interfaces and select Edit.
The Network Interfaces dialog box appears.
Select the interface for which you want to add a default gateway.
Select Edit.
Select Gateway.
The Gateway Settings dialog box appears.
In the Set Default Gateway for Interface ethMNG field, enter the Gateway IP address and select Apply.
Selecting Management NIC
When you have multiple NICs, you can specify the NIC that functions as a management interface.
To select the management NIC:
Login to the Appliance CLI Manager.
Navigate to Networking > Network Settings.
Select Management interface and select Edit.
Select the required NIC.
Select Select.
The management NIC is changed.
Changing the Management IP on ethMNG
Follow these instructions to change the management IP on ethMNG. Be aware, changes to IP addresses are immediate. Any changes to the management IP, on ethMNG, while you are connected to CLI Manager or Web UI will cause the session to disconnect.
To change the management IP on ethMNG:
Login to the Appliance CLI Manager.
Navigate to Networking > Network Settings.
Select Interfaces and select Edit.
The Network Interfaces screen appears.
Select ethMNG and click Edit.
Select the network type and select Update.
In the Interface Settings dialog box, select Edit.
Enter the IP address and net mask.
Select OK.
At the prompt, press ENTER to confirm.
The IP address is updated, and the Address Management screen appears.
Identifying an Interface
To identify an interface:
Login to the Appliance CLI Manager.
Navigate to Networking > Network Settings.
Select Interfaces and select Edit.
The Network Interfaces screen appears.
Select the network interface and select Blink.
This causes an LED on the NIC to blink and the Network Interfaces screen appears.
Adding a service interface address
From ESA v9.0.0.0, the default IP addresses assigned to the docker interfaces are between 172.17.0.0/16 and 172.18.0.0/16. Ensure that the IP addresses assigned to the docker interface must not conflict with your organization’s private/internal IP addresses.
For more information about reconfiguring the docker interface addresses, refer to Configuring the IP address for the Docker Interface.
Be aware, changes to IP addresses are immediate.
To add a service interface address:
Login to the Appliance CLI Manager.
Navigate to Networking > Network Settings.
Select Interfaces and select Edit.
The Network Interfaces screen appears.
Navigate to the service interface to which you want to add an address and select Update.
Select Add.
At the prompt, type the IP address and the netmask.
Press ENTER.
The address is added, and the Address Management screen appears.
4.4.5.2 - Configuring SNMP
The Simple Network Management Protocol (SNMP) is used for monitoring appliances in a network. It consists of two entities, namely, an agent and a manager that work in a client-server mode. The manager performs the role of the server and agent acts as the client. Managers collect and process information about the network provided by the client. For more information about SNMP, refer to the following link.
In Protegrity appliances, you can use this protocol to query the performance figures of an appliance. Typically, the ESA acts as a manager that monitors other appliances or Linux systems on the network. In ESA, the SNMP can be used in the following two methods:
snmpd: The snmpd is an agent that waits for and responds to requests sent by the SNMP manager. The requests are processed, the necessary information is collected, the requested operation is performed, and the results are sent to the manager. You can run basic SNMP commands, such as, snmpstart, snmpget, snmpwalk, snmpsync, and so on. In a typical scenario, an ESA monitors and requests a status report from another appliance on the network, such as, DSG or ESA. By default, the snmpd requests are communicated over the UDP port 161.
In the Appliance CLI Manager, navigate to Networking > SNMP Configuration > Protegrity SNMPD Settings to configure the snmpd settings. The snmpd.conf file in the /etc/snmp directory contains the configuration settings of the SNMP service.
snmptrapd: The snmptrapd is a service that sends messages to the manager in the form of traps. The SNMP traps are alert messages that are configured in the manager in a way that an event occurring at the client immediately triggers a report to the manager. In a typical scenario, you can create a trap in ESA to cold-start a system on the network in case of a power issue. By default, the snmptrapd requests are sent over the UDP port 162. Unlike snmpd, in the snmptrapd service, the agent proactively sends reports to the manager based on the traps that are configured.
In the CLI Manager, navigate to Networking > SNMP Configuration > Protegrity SNMPTRAPD Settings to configure the snmptrapd settings. The snmptrapd.conf file in the /etc/snmp directory can be edited to configure SNMP traps on ESA.

The following table describes the different settings that you configure for snmpd and snmptrapd services.
| Setting | Description | Applicable to SNMPD | Applicable to SNMPTRAPD | Notes |
| Managing service | Start, stop, or restart the service | ✓ | ✓ | Ensure that the SNMP service is running. On the Web UI, navigate to System → Services tab to check the status of the service. |
| Set listening address | Set the port to accept SNMP requests | ✓ | ✓ |
NoteYou can change the listening address only
once. |
| Set DTLS/TLS listening port | Configure SNMP on DTLS over UDP or SNMP on TLS over TCP | ✓ | The default listening port for SNMPD is set to
TCP 10161. | |
| Set community string | String comprising of user id and password to access the statistics of another device | ✓ |
The SNMPv1 is used as default a protocol, but you can also configure SNMPv2 and SNMPv3 to monitor the status and collect information from network devices. The SNMPv3 protocol supports the following two security models:
- User Security Model (USM)
- Transport Security Model (TSM)
4.4.5.2.1 - Configuring SNMPv3 as a USM Model
Configuring SNMPv3 as a USM Model:
From the CLI manager navigate to Administration > OS Console.
The command prompt appears.
Perform the following steps to comment the rocommunity string.
Edit the snmpd.conf using a text editor.
/etc/snmp/snmpd.confPrepend a # to comment the rocommunity string.
Save the changes.
Run the following command to set the path for the snmpd.conf file.
export datarootdir=/usr/shareStop the SNMP daemon using the following command:
/etc/init.d/snmpd stopAdd a user with read-only permissions using the following command:
net-snmp-create-v3-user -ro -A <authorization password> -a MD5 -X <authorization password> -x DES snmpuserFor example,
net-snmp-create-v3-user -ro -A snmpuser123 -a MD5 -X snmpuser123 -x DES snmpuserStart the SNMP daemon using the following command:
/etc/init.d/snmpd startVerify if SNMPv1 is disabled using the following command:
snmpwalk -v 1 -c public <hostname or IP address>Verify if SNMPv3 is enabled using the following command:
snmpwalk -u <username> [-A (authphrase)] [-a (MD5|SHA)] [-x DES] [-X (privaphrase)] (ipaddress)[:(dest_port)] [oid]For example,
snmpwalk -u snmpuser -A snmpuser123 -a MD5 -X snmpuser123 -x DES -l authPriv 127.0.0.1 -v3Unset the variable assigned to the snmpd.conf file using the following command.
unset datarootdir
4.4.5.2.2 - Configuring SNMPv3 as a TSM Model
Configuring SNMPv3 as a TSM Model:
From the CLI manager navigate to Administration > OS Console.
The command prompt appears.
Set up the CA certificates, Server certificates, Client certificates, and Server key on the server using the following commands:
ln -s /etc/ksa/certificates/CA.pem /etc/snmp/tls/ca-certs/CA.crt

ln -s /etc/ksa/certificates/server.pem /etc/snmp/tls/certs/server.crt

ln -s /etc/ksa/certificates/client.pem /etc/snmp/tls/certs/client.crt

ln -s /etc/ksa/certificates/mng/server.key /etc/ksa/certificates/server.key
Change the mode of the server.key file under /etc/ksa/certificates/ directory to read only using the following command:
chmod 600 /etc/ksa/certificates/server.keyEdit the snmpd.conf file under /etc/ksa directory.
Append the following configuration in the snmpd.conf file.
[snmp] localCert server
[snmp] trustCert CA
certSecName 10 client --sn <username>
Trouser -s tsm "< username>" AuthPriv
Alternatively, you can also use a field from the certificate using the –-cn flag as a username as follows:
certSecName 10 client –cn
Trouser –s tsm “Protegrity Client” AuthPriv
To use fingerprint as a certificate identifier, execute the following command:
net-snmp-cert showcerts --fingerprint
11`
Restart the SNMP daemon using the following command:
/etc/init.d/snmpd restartYou can also restart the SNMP service using the ESA Web UI.
Deploy the certificates on the client side.
4.4.5.3 - Working with Bind Services and Addresses
The Bind Services/Addresses tool allows for separating the Web services from their management, Web UI and SSH. You can specify the network cards that will be used for Web management and Web services. For example, the DSG appliance uses the ethMNG interface for Web UI and the ethSRV interface for enabling communication with different applications in an enterprise. This article provides instructions for selecting network interfaces for management and services.
Ensure that all the NICs added to the appliance are configured in the Network Settings screen.
4.4.5.3.1 - Binding Interface for Management
If you have multiple NICs, you can specify the NIC that functions as a management interface.
To bind the management NIC:
Login to the CLI Manager.
Navigate to Networking > Bind Services/Address.
Enter the root password and select OK.

Select Management and choose Select.
In the interface for ethMNG, select OK.
Choose Select and press ENTER.
The NIC for Management is assigned.
Select Done.
A message Successfully done appears and the NIC for service requests are assigned.
Navigate to Administration > OS Console.
Enter the root password and select OK.
Run the
netstat -tunlpcommand to verify the status of the NICs.
4.4.5.3.2 - Binding Interface for Services
If you have multiple service NICs, you can specify the NICs that will function to accept the Web service requests on port 8443.
To bind the service NIC:
Login to the CLI Manager.
Navigate to Networking > Bind Services/Address.
Enter the root password and select OK.
Select Service and choose Select.
A list of service interfaces with their IP addresses is displayed.
Select the required interface(s) and select OK.
The following message appears.

Choose Yes and press ENTER.
Select Done.
A message Successfully done appears and the NIC for service requests are assigned.
Navigate to Administration > OS Console.
Enter the root password and select OK.
Run the
netstat -tunlpcommand to verify the status of the NICs.
4.4.5.4 - Using Network Troubleshooting Tools
Using the Network Troubleshooting Tools, you can check the health of your network and troubleshoot problems. This tool is composed of several utilities that allow you to test the integrity of you network. The following table describes the utilities that make up the Network Utilities tool.
Table 1. Network Utilities
Name | Using this tool you can... | How… |
Ping | Tests whether a specific Host is accessible across the
network. | In the Address field, type the IP
address that you want to test. Press
ENTER. |
TCPing | Tests whether a specific TCP port on a Host is
accessible across the network. | In the Address field, type the IP
address. In the Port field, type the
port number. Select OK. |
TraceRoute | Tests the path of a packet from one machine to another.
Returns timing information and the path of the packet. | At the prompt, type the IP address or Host name of the
destination machine. Select
OK. |
MTR | Tests the path of a packet and returns the list of
routers traversed and some statistics about each. | At the prompt, type the IP address or Host
name. Select OK. |
TCPDump | Tests network traffic, and examines all packets going
through the machine. | To filter information, by network interface, protocol,
Host, or port, type the criteria in the corresponding text
boxes. Select OK. |
SysLog | Sends syslog messages. Can be used to test syslog
connectivity. | In the Address field, enter the
IP address of the remote machine the syslogs will be sent
to. In the Port field, enter a port
number the remote machine is listening to. In the
Message field, enter a test message. Select
OK. On the remote machine, check if
the syslog was successfully sent. Note that the appliance
uses UDP syslog, so there is no way to validate whether the syslog
server is accessible. |
Show MAC | Finds out the MAC address for a given IP address.
Detects IP collision. | At the prompt, type the IP address or Host
name. Select OK. |
4.4.5.5 - Managing Firewall Settings
Protegrity internal firewall provides a way to allow or restrict inbound access from the outside to Protegrity Appliances. Using the Network Firewall tool you can manage your Firewall settings. For example, you can allow access to the management-network interface only from a specific machine while denying access to all other machines.
To improve security in the ESA, the firewall in v9.2.0.0 is upgraded to use the nftables framework instead of the iptables framework. The nftables framework helps remedy issues, including those relating to scalability and performance.
The iptables framework allows the user to configure IP packet filter rules. The iptables framework has multiple pre-defined tables and base chains, that define the treatment of the network traffic packets. With the iptables framework, you must configure every single rule. You cannot combine the rules because they have several base chains.
The nftables framework is the successor of the iptables framework. With the nftables framework, there are no pre-defined tables or chains that define the network traffic. It uses simple syntax, combines multiple rules, and one rule can contain multiple actions. You can export the data related to the rules and chains to json or xml using the nft userspace utility.
Verifying the nftables
This section provides the steps to verify the nftables.
To verify the nftables:
Log in to the CLI Manager.
Navigate to Administration > OS Console.
Enter the root password and select OK.
Run the command
nft list ruleset.
The nftables rules appear.
Listing the Rules
Using the Rules List option, you can view the available firewall rules.
To view the details of the rule:
Log in to the CLI Manager.
Navigate to Networking > Network Firewall.
Enter the root password and select OK.
The following screen appears.

From the menu, select Rules List to view the list of rules.
A list of rules appear.
Select a rule from the list and click More.
The policy, protocol, source IP address, interface, port, and description appear.
Click Delete to delete a selected rule. Once confirmed, the rule is deleted.
Log in to the Web UI.
Navigate to System > Information to view the rules.
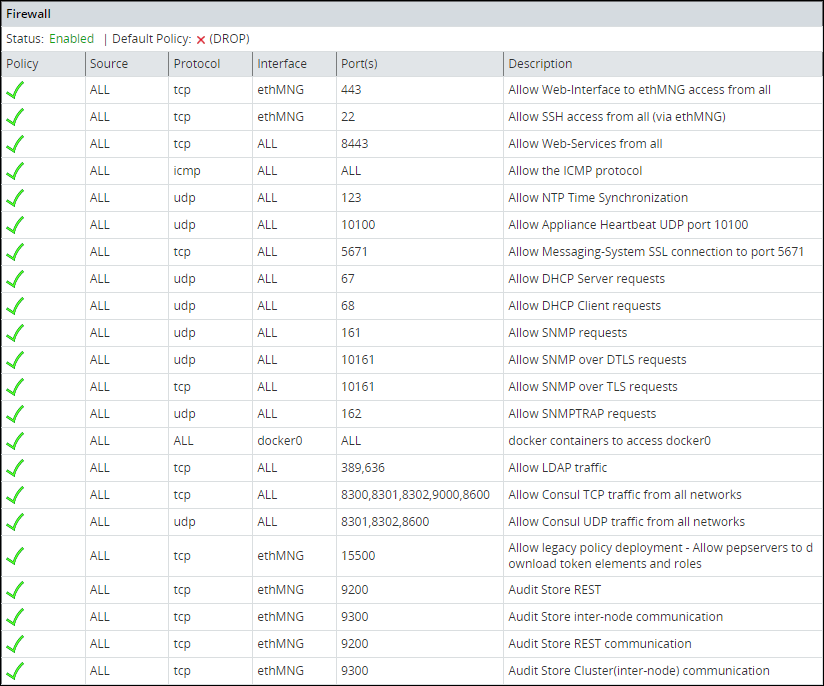
Reordering the Rules List
Using the Reorder Rules List option, you can reorder the list of rules. With buttons Move up and Move down you can move the selected rule. When done, click Apply for the changes to take effect.
The order of the specified rules are important. When reordering the firewall rules, take into account that rules which are in the beginning of the list are of the first priority. Thus, if there are conflicting rules in the list, the one which is the first in the list is applied.
Specifying the Default Policy
The default policy determines what to do on packets that do not match any existing rule. Using the Specify Default Policy option, you can set the default policy for the input chains. You can specify one of the following options:
- Accept - Let the traffic pass through.
- Drop - Remove the packet from the wire and generate no error packet.
If not specified by any rule, then the incoming packet will be dropped as the default policy. If specified by a rule, then the incoming packet will be allowed/denied or dropped depending on the policy of the rule.
Adding a New Rule
Every new rule specifies the criteria for matching packets and the action required. You can add a new rule using the Add New Rule option. This section explains how to add a firewall rule.
Adding a new rule is a multi-stage process that includes:
- Specifying an action to be taken for matching incoming traffic:
- Accept - Allow the packets.
- Drop - Remove the packet from the wire and generate no error packet.
- Reject - Remove the packet from the wire and return an error packet.
- Specifying the local service for this rule.
- Specifying the local network interface. It can be any or selected interface..
- Specifying the remote machine criteria.
- Providing a description for the rule. This is optional.
When a Firewall rule is added, it is added to the end of the Firewall list. If there is a conflicting rule in the beginning of the list, then the new rule may be ignored by the Firewall. Thus, it is recommended to move the new rule somewhere to the beginning of the Firewall rules list.
Adding a New Rule with the Predefined List of Functionality
Follow these instructions to add a new rule with the predefined list of functionality:
Select a policy for the rule, accept, drop, or reject, which will define how a package from the specific machine will be treated by the appliance Firewall.
Click Next.
Specify what will be affected by the rule. Two options are available: to specify the affected functionality list, in this case, you do not need to specify the ports since they are already predefined, or to specify the protocol and the port.
Select the local service affected by the rule. You can select one or more items to be affected by the firewall rule.
Click Next.
If you want to have a number of similar rules, then you can specify multiple items from the functionality list. Thus, for example, if you want to allow access from a certain machine to the appliance LDAP, SNMP, High Availability, SSH Management, or Web Services Management, you can specify these items in the list.
Click Manually.
In the following dialog box, select a protocol for the rule. You can select between TCP, UDP, ICMP, or any.
In the following screen, specify the port number and click Next.
In the following screen you are prompted to specify an interface. Select between ethMNG (Ethernet management interface), ethSRV0 (Ethernet security service interface), ethSRV1, or select Any.
In the following screen you are prompted to specify the remote machine. You can specify between single/IP with subnet or domain name.
When you select Single, you will be asked to specify the IP in the following screen.
When you select IP with Subnet, you will be asked to specify the IP first, and then to specify the subnet.
When you select Domain Name, you will be asked to specify the domain name.
When you have specified the remote machine, the Summary screen appears. You can enter the description of your rule if necessary.
Click Confirm to save the changes.
Click OK in the confirmation message listing the rules that will be added to the Rules list.
Disabling/Enabling the Firewall Rules
Using the Disable/Enable Firewall option, you can start your firewall. All rules that are available in the firewall rules list will be affected by the firewall when it is enabled. All new rules added to the list will be affected by the firewall. You can also restart, start, or stop the firewall using ESA Web UI.
Resetting the Firewall Settings
Using the Reset Firewall Settings option, you can delete all firewall rules. If you use this option, then the firewall default policy becomes accept and the firewall is enabled.
If you require additional security, then change the default policy and add the necessary rules immediately after you reset the firewall.
4.4.5.6 - Using the Management Interface Settings
Using the Management Interface Settings option, you can specify the network interface that will be used for management (ethMNG). By default, the first network interface is used for management (ethMNG). The first management Ethernet is the one that is on-board.

If you change the network interface, then you are asked to reboot the ESA for the changes to take effect.
Note: The MAC address is stored in the appliance configuration. If the machine boots or reboots and this MAC address cannot be found, then the default, which is the first network card, will be applied.
4.4.5.7 - Ports Allowlist
On the Proxy Authentication screen of the Web UI, you can add multiple AD servers for retrieving users. The AD servers are added as URLs that contain the IP address/domain name and the listening port number. You can restrict the ports on which the LDAP listens to by maintaining a port allowlist. This ensures that only those ports that are trusted in the organization are mentioned in the URLs.
On the CLI Manager, navigate to Networking > Ports Allowlist to set a list of trusted ports. By default, port 389 is added to the allowlist.
The following figure illustrates the Ports Allowlist screen.

This setting is applicable only to the ports entered in the Proxy Authentication screen of the Web UI.
Viewing list of allowed ports
You can view the list of ports that are specified in the allowlist.
On the CLI Manager, navigate to Networking > Ports Allowlist.
Enter the root credentials.
Select List allowed ports.
The list of allowed ports appears.
Adding ports to the allowlist
Ensure that multiple port numbers are comma-delimited and do not contain space between them.
On the CLI Manager, navigate to Networking > Ports Allowlist.
Enter the root credentials.
Select Add Ports.
Enter the required ports and select OK.
A confirmation message appears.
4.4.6 - Working with Tools
Protegrity appliances are equipped with a Tools menu. The following sections list and explain the available tools and their functionalities.

4.4.6.1 - Configuring the SSH
The SSH Configuration tool provides a convenient way to examine and manage the SSH configuration that would fit your needs. Changing the SSH configuration may be necessary for special needs, troubleshooting, or advanced non-standard scenarios. By default, the SSH is configured to deny any SSH communication with unknown remote servers. You can allow the authorized users with keys to communicate without passwords. Every time you add a remote host, the system obtains the SSH key for this host, and adds it to the known hosts.
Note: It is recommended to create a backup of the SSH settings/keys before you make any modifications.
For more information for Backup from CLI, refer to here.
For more information for Backup from Web UI, refer to here.
Using Tools > SSH Configuration, you can:
- Specify SSH Mode.
- Specify SSH configuration.
- Manage the hosts that the Appliance can connect to.
- Set the authorized keys.
- Manage the keys that belong to local accounts.
- Generate new SSH server keys.

4.4.6.1.1 - Specifying SSH Mode
Using SSH Mode tool, you can set restrictions for SSH connections. The restrictions can be hardened or made slack according to your needs. Four modes are available, as described in the following table:
| Mode | SSH Server | SSH Client |
|---|---|---|
| Paranoid | Disable root access | Disable password authentication, allows to connect only using public keys. Block connections to unknown hosts. |
| Standard | Disable root access | Allow password authentication. Allow connections to new or unknown hosts, enforce SSH fingerprint of known hosts. |
| Open | Allow root access Accept connections using passwords and public keys | Allow password authentication. Allow connection to all hosts – do not check hosts fingerprints. |
4.4.6.1.2 - Setting Up Advanced SSH Configuration
A user with administrative credentials can configure the SSH idle timeout and client authentication settings. The following screen shows the Advanced SSH Configuration.

In the Idle Timeout field, enter the idle timeout period in seconds. This allows the user to set idle timeout period for the SSH server before logout.
When you are working on the OS Console using the OpenSSH session, if the session is idle for the specified time, then the OS Console session gets closed. However, you are re-directed to the Administration screen.
In the Client Authentications field, specify the order for trying the SSH authentication method. This allows you to prefer one method over another. The default for this option is publickey, password.
4.4.6.1.3 - Managing SSH Known Hosts
Using Known Hosts: Hosts I can connect to, you can manage the hosts that you can connect to using SSH. The following table explains the options in the Hosts that I connect to dialog box:
| Using… | You can… |
|---|---|
| Display List | View the list of SSH allowed hosts you can connect to. |
| Reset List | Clear the SSH allowed hosts list. Only the local host, which is the default, appears. |
| Add Host | Add a new SSH allowed host. |
| Delete Host | Delete a host from the list of SSH allowed hosts. |
| Refresh (Sync) Host | Make sure that the available key is a correct key from each IP. To do this, go to each IP/host and re-obtain its key. |
4.4.6.1.4 - Managing Authorized Keys
SSH Authorized keys are used to specify SSH keys that are allowed to connect to this machine without entering the password. The system administrator can create such SSH keys and import the keys to this appliance. This is a standard SSH mechanism to allow secured access to machines without a need to enter a password.
Using the Authorized Keys tool, you can display the keys and delete the list of authorized keys from the Reset List option. This would reject all incoming connections that used the authorized keys reset with this tool.
Examine and manage the users that are authorized to access this host.
4.4.6.1.5 - Managing Identities
Using the Identities menu, you can manage and examine which users can start SSH communication from this host using SSH keys. You can:
- Display the list of such keys that already exist.
- Reset the SSH keys. This means that all SSH keys used for outgoing connections are deleted.
- Add an identity from the list already available by default or create one as required, using the Directory or Filter options.
- Delete an identity. This should be done with extreme care.
4.4.6.1.6 - Generating SSH Keys
Using the Generate SSH Keys, you can create new SSH keys. If you recreate the SSH Keys, then the remote machines that store the current SSH key, will not be able to contact the appliance until you manually update the SSH keys on those machines.
4.4.6.1.7 - Configuring the SSH
SSH is a network protocol that ensures a secure communication over an unsecured network. It comprises of a utility suite which provides high-level authentication encryption over unsecured communication channels. SSH utility suites provide a set of default rules that ensure the security of the appliances. These rules consist of various configurations such as password authentication, log level info, port numbers info, login grace time, strict modes, and so on. These configurations are enabled by default when the SSH service starts. These rules are provided in the sshd_config.orig file under the /etc/ssh directory.
You can customize the SSH rules for your appliances as per your requirements. You can configure the rules in the sshd_config.append file under the /etc/ksa directory.
Warning: To add customised rules or configurations to the SSH configuration file, modify the sshd_config.append file only. It is recommended to use the console for modifying these settings.
For example, if you want to add a match rule for a test user, test_user with the following configurations:
- User can only login with a valid password.
- Only three incorrect password attempts are permitted.
- Requires host-based authentication.
You must add the following configuration for the match rule in the sshd_config.append file. Make sure to restart the SSH service to apply the updated configurations.
Match user test_user
        PasswordAuthentication yes
        MaxAuthTries    3
        HostbasedAuthentication yes
Ensure that you must enter the valid configurations in the sshd_config.append file.
If the rule added to the file is incorrect, then the SSH service reverts to the default configurations provided in the sshd_config.orig file.
Consider an example where the SSH rule is incorrectly configured by replacing PasswordAuthentication with Password—Authentication. The following code snippet describes the incorrect configuration.
Match user test_user
        Password---Authentication yes
        MaxAuthTries    3
        HostbasedAuthentication yes
Then, the following message appears on the OS Console when the SSH services restart.
root@protegrity-esa858:/var/www# /etc/init.d/ssh restart
[ ok ] Stopping OpenBSD Secure Shell server: sshd.
The configuration(s) added is incorrect. Reverting to the default configuration.
/etc/ssh/sshd_config: line 274: Bad configuration option: Password---Authentication
/etc/ssh/sshd_config line 274: Directive 'Password---Authentication' is not allowed within a Match block
[ ok ] Starting OpenBSD Secure Shell server: sshd.
If you want to configure the SSH settings for an HA environment, then you must add the rules to both the nodes individually before creating the HA.
For more information about configuring rules to SSH, refer to here.
4.4.6.1.8 - Customizing the SSH Configurations
To configure SSH rules:
Login to the CLI Manager with the root credentials.
Navigate to Administrator > OS Console.
Configure a new rule using a text editor.
/etc/ksa/sshd_config.appendConfigure the required SSH rule and save the file.
Restart the SSH service through the CLI or Web UI.
- To restart the SSH service from the Web UI, navigate to System > Services > Secured Shell (SSH).
- To restart the SSH service from CLI Manager, navigate to Administration > Services > Secured Shell (SSH).
The SSH services starts with the customized rules or configurations.
- To restart the SSH service from the Web UI, navigate to System > Services > Secured Shell (SSH).
4.4.6.1.9 - Exporting/Importing the SSH Settings
You can backup or restore the SSH settings. To export these configurations, select the Appliance OS configuration option while exporting the custom files.

To import the SSH configurations, select the SSH Settings option.

Warning: You can configure SSH settings and SSH identities that are server-specific. It is recommended to not export or import these SSH settings as it may break the SSH services on the appliance.
For more information on Exporting Custom Files, refer to here.
4.4.6.1.10 - Securing SSH Communication
When the client communicates with the server using SSH protocol, a key exchange process occurs for encrypting and decrypting the communication. During the key exchange process, client and server decide on the cipher suites that must be used for communication. The cipher suites contain different algorithms for securing the communication. One of the algorithms that Protegrity appliances uses is SHA1, which is vulnerable to collision attacks. Thus, to secure the SSH communication, it is recommended to deprecate the SHA1 algorithm. The following steps describe how to remove the SHA1 algorithm from the SSH configuration.
To secure SSH communication:
On the CLI Manager, navigate to Administration > OS Console.
Navigate to the /etc/ssh directory.
Edit the sshd_config.orig file.
Remove the following entry:
MACs hmac-sha1,hmac-sha2-256,hmac-sha2-512Remove the following entry:
KexAlgorithms curve25519-sha256@libssh.org,ecdh-sha2-nistp521,ecdh-sha2-nistp384,ecdh-sha2-nistp256,diffie-hellman-group-exchange-sha256,diffie-hellman-group-exchange-sha1Save the changes and exit the editor.
Navigate to the /etc/ksa directory.
Edit the sshd_config.append file.
Append the following entries to the file.
MACs hmac-sha2-256,hmac-sha2-512
KexAlgorithms curve25519-sha256@libssh.org,ecdh-sha2-nistp521,ecdh-sha2-nistp384,ecdh-sha2-nistp256,diffie-hellman-group-exchange-sha256
Save the changes and exit the editor.
Restart the SSH service using the following command.
/etc/init.d/ssh restartThe SHA1 algorithm is removed for the SSH communication.
4.4.6.2 - Clustering Tool
Using Tools > Clustering Tool, you can create the Trusted cluster. The trusted cluster can be used to synchronize data from one server to another other one.
For more information about the ports needed for the Trusted cluster, refer to Open Listening Ports.
4.4.6.2.1 - Creating a TAC using the CLI Manager
About Creating a TAC using the CLI
Before creating a TAC, ensure that the SSH Authentication type is set to Public key or Password + PublicKey.
If you are using cloned machines to join a cluster, it is necessary to rotate the keys on all cloned nodes before joining the cluster.
If the cloned machines have proxy authentication, two factor authentication, or TAC enabled, it is recommended to use new machines. This avoids any limitations or conflicts, such as, inconsistent TAC, mismatched node statuses, conflicting nodes, and key rotation failures due to keys in use.
For more information about rotating the keys, refer here.
How to create the TAC using the CLI Manager
To create a cluster using the CLI Manager:
In the ESA CLI Manager, navigate to Tools > Clustering > Trusted Appliances Cluster.
The following screen appears.

Select Create: Create new cluster.
The screen to select the communication method appears.

Select Set preferred method to set the preferred communication method.
- Select Manage local methods to add, edit, or delete a communication method.
- For more information about managing communication methods for local node, refer here.
Select Done.
The Cluster Services screen appears and the cluster is created.
4.4.6.2.2 - Joining an Existing Cluster using the CLI Manager
If you are using cloned machines to join a cluster, it is necessary to rotate the keys on all cloned nodes before joining the cluster.
If the cloned machines have proxy authentication, two factor authentication, or TAC enabled, it is recommended to use new machines. This avoids any limitations or conflicts, such as, inconsistent TAC, mismatched node statuses, conflicting nodes, and key rotation failures due to keys in use.
For more information about rotating the keys, refer here.
Important : When assigning a role to the user, ensure that the Can Create JWT Token permission is assigned to the role.If the Can Create JWT Token permission is unassigned to the role of the required user, then joining the cluster operation fails.To verify the Can Create JWT Token permission, from the ESA Web UI navigate to Settings > Users > Roles.
To join a cluster using the CLI Manager:
In the ESA CLI Manager, navigate to Tools > Clustering > Trusted Appliances Cluster.
In the Cluster Services screen, select Join: Join an existing cluster.
The following screen appears.

Enter the IP address of the target node in the Node text box.
Enter the credentials of the user of the target node in the Username and Password text boxes.
- Ensure that the user has administrative privileges.
- Select Advanced to manage communication or set the preferred communication method.
For more information about managing communication methods, refer here.
- Ensure that the user has administrative privileges.
Select Join.
The node is joined to an existing cluster.
4.4.6.2.3 - Cluster Operations
Using Cluster Operations, you can execute the standard set of commands or copy files from the local node to other nodes in the cluster. You can only execute the commands or copy files to the nodes that are directly connected to the local node.
The following figure displays the Cluster Operations screen.

Executing Commands using the CLI Manager
This section describes the steps to execute commands using the CLI Manager.
To execute commands using the CLI Manager:
In the CLI Manager, navigate to Tools > Trusted Appliances Cluster > Cluster Operations: Execute Commands/Deploy Files.
Select Execute.
The Select command screen appears with the following list of commands:
- Display top 10 CPU Consumers
- Display top 10 memory Consumers
- Report free disk space
- Report free memory space
- Display TCP/UDP network information
- Display performance and system counters
- Display cluster tasks
- Manually enter a command
Select the required command and select Next.
The following screen appears.

Select the target node and select Next.
The Summary screen displaying the output of the selected command appears.
Copying Files from Local Node to Remote Node
This section describes the steps to copy files from local node to remote node.
To copy files from local node to remote nodes:
In the CLI Manager, navigate to Tools > Trusted Appliances Cluster > Cluster Operations: Execute Commands/Deploy Files .
The screen with the appliances connected to the cluster appears.
Select Put Files.
The list of files in the current directory appears. Select Directory to change the current directory
Select the required file and select Next.
The Target Path screen appears.

Select the required option and select Next.
The following screen appears.
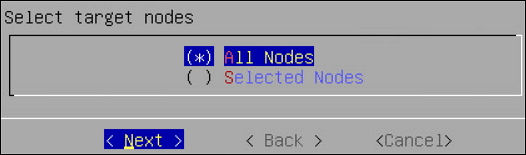
Select the target node and select Next.
The Summary screen confirming the file to be deployed appears.
Select Next.
The files are deployed to the target nodes.
4.4.6.2.4 - Managing a site
Using Site Management, you can perform the following operations:
- Obtain Site Information
- Add a site
- Remove sites added to the cluster, if more than one site exists in the cluster
- Rename a site
- Set the master site
The following screen shows the Site Management screen.

View a Site
You can view the information for all the sites in the cluster by selecting Show sites information. When a cluster is created, a master site with site1 is created by default. The following screen displays the Site Information screen.

Adding Sites to a Cluster
This section describes the steps to add multiple sites to a cluster from the CLI Manager.
To add a site to a cluster:
On the CLI Manager, navigate to Tools > Trusted Appliances Cluster > Site Management > Add Site.
The following screen appears.

Select OK.
The new site is added.
Renaming a Site
This section describes the steps to rename a site from the CLI Manager.
To rename a site:
On the CLI Manager, navigate to Tools > Trusted Appliances Cluster > Site Management > Update Cluster Site Settings.
Select the required site and select Rename.
The Rename Site screen appears.
Type the required site name and select OK.
The site is renamed.
Setting a Master Site from the CLI Manager
This section describes the steps to set a master site from the CLI Manager.
To set a master site from the CLI Manager:
On the CLI Manager, navigate to Tools > Trusted Appliances Cluster > Site Management > Set Master Site.
The Set Master Site screen appears.
Select the required site and select Set Master.
A message Operation has been completed successfully appears and the new master site is set. An empty cluster site does not contain any node. You cannot set an empty cluster site as a master site.
Deleting a Cluster Site
This section describes the steps to delete a cluster site from the CLI Manager. You can only delete an empty cluster site.
To delete a cluster site:
In the CLI Manager of the node hosting the appliance cluster, navigate to Tools > Trusted Appliances Cluster > Site Management > Remove: Remove Cluster sites(s).
The Remove Site screen appears.
Select the required site and select Remove.
Select OK.
The site is deleted.
4.4.6.2.5 - Node Management
Using Node Management, you can:
- List the nodes - The same option as List Nodes menu, refer here.
- Add a node to the cluster - If your appliance is a part of the cluster, and you want to add a remote node to this cluster.
- Update cluster information - For updating the identification entries.
- Manage communication method of the nodes.
- Remove a remote node from the cluster.
4.4.6.2.5.1 - Show Cluster Nodes and Status
The following table describes the fields that appear on the status screen.
| Field | Description |
|---|---|
| Hostname | Hostname of the node |
| Address | IP address of the node |
| Label | Label assigned to the node |
| Type | Build version of the node |
| Status | Online/Blocked/Offline |
| Node Messages | Messages that appear for the node |
| Connection | Connection setting of the node (On/Off) |
4.4.6.2.5.2 - Viewing the Cluster Status using the CLI Manager
To view the status of the nodes in a cluster using the CLI Manager:
In the CLI Manager, navigate to Tools > Trusted Appliances Cluster > Node Management > List Nodes.
The screen displaying the status of the nodes appears.

Select Change View to change the view.
The list of different reports is as follows:
- List View: Displays the list of all the nodes.
- Labels View: Displays a grouped view of the nodes.
- Status View: Displays the status of the nodes.
- Report view: Displays the cluster diagnostics, network or connectivity issues, and generate error or warning messages if required.
4.4.6.2.5.3 - Adding a Remote Node to a Cluster
To add a remote node to the cluster:
In the CLI Manager of the node hosting the cluster, navigate to Tools > Trusted Appliances Cluster > Node Management > Add Node: Add a remote node to this cluster.
The Add Node screen appears.

Enter the credentials of the local node user, which must have administrative privileges, into the Username and Password text boxes.
Type the preferred communication method on the Preferred Method text box.
Type the accessible communication method of the target node in the Reachable Address text box.
Type the credentials of the target node user in the Username and Password text boxes.
Select OK.
The node is invited to the cluster.
4.4.6.2.5.4 - Updating Cluster Information using the CLI Manager
It is recommended not to change the name of the node after you create the cluster task.
To update cluster information:
In the CLI Manager of the node hosting the cluster, navigate to Tools > Trusted Appliances Cluster > Node Management > Update Cluster Information.
The Update Cluster Information screen appears.

Type the name of the node in the Name text box.
Type the information describing the node in the Description text box.
Type the required label for the node in the Labels text box.
Select OK.
The details of the node are updated.
4.4.6.2.5.5 - Managing Communication Methods for Local Node
Every node in a network is identified using a unique identifier. A communication method is a qualifier for the remote nodes in the network to communicate with the local node.
There are two standard methods by which a node is identified:
- Local IP Address of the system (ethMNG)
- Host name
The nodes joining a cluster use the communication method to communicate with each other. The communication between nodes in a cluster occur over one of the accessible communication methods.
Adding a Communication Method from the CLI Manager
This section describes the steps to add a communication method from the CLI Manager.
To add a communication method from the CLI Manager:
In the ESA CLI Manager, navigate to Tools > Clustering > Trusted Appliances Cluster.
In the Cluster Services screen, select Node Management: Add/Remove Cluster Nodes/ Information.
In the Node Management screen, select Manage node’s local communication methods.
In the Select Communication Method screen, select Add.
Type the required communication method and select OK.
The new communication method is added.
Ensure that the length of the text is less than or equal to 64 characters.
Editing a Communication Method from the CLI Manager
This section describes the steps to edit a communication method from the CLI Manager.
To add a communication method from the CLI Manager:
In the ESA CLI Manager, navigate to Tools > Clustering > Trusted Appliances Cluster.
In the Cluster Services screen, select Node Management: Add/Remove Cluster Nodes/ Information.
In the Node Management screen, select Manage node’s local communication methods.
In the Select Communication Method screen, select the communication method to edit and select Edit.
In the Edit method screen, enter the required changes and select OK.
The changes to the communication method are complete.
Deleting a Communication Method from the CLI Manager
This section describes the steps to delete a communication method from the CLI Manager.
To delete a communication method from the CLI Manager:
In the ESA CLI Manager, navigate to Tools > Clustering > Trusted Appliances Cluster.
In the Cluster Services screen, select Node Management: Add/Remove Cluster Nodes/ Information.
In the Node Management screen, select Manage node’s local communication methods.
In the Select Communication Method screen, select the required communication method and select Delete.
The communication method of the node is deleted.
4.4.6.2.5.6 - Managing Local to Remote Node Communication
You can select the method that a node uses to communicate with another node in a network. The communication methods of all the nodes are visible across the cluster. You can select the specific communication mode to connect with a specific node in the cluster. In the Node Management screen, you can set the communication between a local node and remote node in a cluster.
You can also set the preferred method that a node uses to communicate with other nodes in a network. If the selected communication method is not accessible, then the other available communication methods of the target node are used for communication.
Selecting a Local to Remote Node Communication Method
This section describes the steps to select a local to remote node communication method.
To select a local to remote node communication method:
In the ESA CLI Manager, navigate to Tools > Clustering > Trusted Appliances Cluster.
In the Cluster Services screen, select Node Management: Add/Remove Cluster Nodes/ Information.
In the Node Management screen, select Manage local to other nodes communication methods.
In the Manage local to other nodes communication method, select the required node for which you want to change the communication method.
Select Change.
Select the required communication method and select Choose. If a new communication must be added so it can be chosen as the required communication method, select Add New to add it.
Select Ok.
The communication method is selected to communicate with the remote node in the cluster.
Changing a Local to Remote Node Communication Method
This section describes the steps to change a local to remote node communication method.
To change a local to remote node communication method:
In the ESA CLI Manager, navigate to Tools > Clustering > Trusted Appliances Cluster.
In the Cluster Services screen, select Node Management: Add/Remove Cluster Nodes/ Information.
In the Node Management screen, select Manage local to other nodes communication methods.
In the Manage local to other nodes communication method screen, select a remote node and select Change.
The following screen appears.
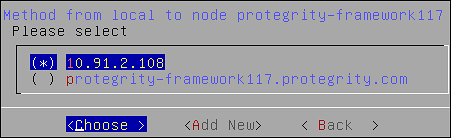
Select the required communication method.
Select Choose.
The new local to other nodes communication methods is set.
4.4.6.2.5.7 - Removing a Node from a Cluster using CLI Manager
Before attempting to remove a node, verify if it is associated with a cluster task. If a node is associated with a cluster task that is based on the hostname or IP address, then the Remove a (remote) cluster node operation will not remove node from the cluster. Ensure that you delete all such tasks before removing any node from the cluster.
To remove a node from a cluster using the CLI Manager:
In the ESA CLI Manager, navigate to Tools > Trusted Appliances Cluster.
In the Cluster Services screen, select Node Management: Add/Remove Cluster Nodes/Information.
The following screen appears.

Select Remove: Delete a (remote) cluster node and select OK.
The screen displaying the nodes in the cluster appears.
Select the required node and select OK.
The following screen appears.

Select OK.
Select REFRESH to view the updated status.
4.4.6.2.5.8 - Uninstalling Cluster Services
Before attempting to remove a node, verify if it is associated with a cluster task. If a node is associated with a cluster task that is based on the hostname or IP address, then the Uninstall Cluster Services operation will not uninstall the cluster services on the node. Ensure that you delete all such tasks before uninstalling the cluster services.
To remove a node from a cluster using the CLI Manager:
In the ESA CLI Manager, navigate to Tools > Trusted Appliances Cluster.
In the Cluster Services screen, select 7 Uninstall : Uninstall Cluster Services.
A confirmation message appears.
Select Yes.
The cluster services are uninstalled.
4.4.6.2.6 - Trusted Appliances Cluster
A Trusted Appliances cluster can be used to transfer data from one node to other nodes regardless of their location, as long as standard SSH access is supported. This mechanism allows you to run remote commands on remote cluster nodes, transfer files to remote nodes and export configurations to remote nodes. Trusted appliances clusters are typically used for disaster recovery. The trusted appliance cluster can be configured and controlled using the Appliance Web UI as well as the Appliance CLI.
Clustering details are fully explained in section Trusted Appliances Cluster (TAC). In that section you will find information how to:
- Setup a trusted appliances cluster
- Add the appliance to an existing trusted appliances cluster
- Remove an appliance from the trusted appliances cluster
- Manage cluster nodes
- Run commands on cluster nodes
Using the cluster maintenance, you can perform the following functions:
- List cluster nodes
- Update cluster keys
- Redeploy local cluster configuration to all nodes
- Review cluster service interval
- Execute commands as OS root user
4.4.6.2.6.1 - Updating Cluster Key
Before you begin
Ensure that all the nodes in the cluster are active, before changing the cluster key.
If a new key is deployed to a node that is unreachable, then connect the node to the cluster. In this scenario, remove the node from the cluster and re-join the cluster.
Generate a new set of the cluster SSH keys to the nodes that are directly connected to the local node. This ensures that the trusted appliance cluster is secure.
To re-generate cluster keys:
In the ESA CLI Manager, navigate to Tools > Clustering > Trusted Appliances Cluster > Maintenance: Update Cluster Settings.
The following screen appears.
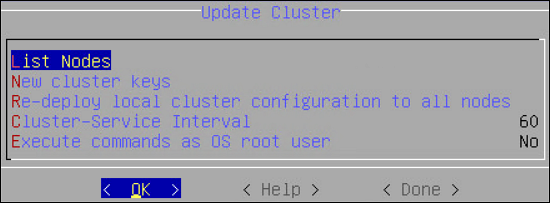
Select New Cluster Keys.
A message to re-generate the cluster keys appears.
Select Yes.
The new keys are deployed to the nodes that are directly connected.
4.4.6.2.6.2 - Redeploy Local Cluster Configuration to All Nodes
You can redeploy the local cluster configuration to force it to be applied on all connected nodes. Usually there is no need for such operation since the configurations are synchronized automatically. However, if the cluster status service is stopped or you want to force a specific configuration, then you can use this option to force the configuration.
When you select to Redeploy local cluster configuration to all nodes in the Update Cluster dialog box, the operation is performed at once with no confirmation.
4.4.6.2.6.3 - Cluster Service Interval
The cluster provides an auto-update mechanism that runs in the background as a background service which is responsible for updating local and remote cluster configurations and cluster health checks.
You can specify the cluster service interval in the Cluster Service Interval dialog box.

The interval (in seconds) specifies the sleep time between cluster background updates/operations. For example, if the specified value is 120 seconds, then every two minutes the cluster service will update its status and synchronize its cluster configuration with the other nodes (if changes identified).
4.4.6.2.6.4 - Execute Commands as OS Root User
By default, the cluster user is a restricted user which means that the cluster commands will be restricted by the OS. There are scenarios where you would like to disable these restrictions and allow the cluster user to run as the OS root user.
Using the details in the table below, you can specify whether to execute the commands as root or as a restricted user.
| You can specify… | To… |
|---|---|
| Yes | Always execute commands as the OS root user. It is less secure, risky if executing the wrong command. |
| No | Always execute commands as non-root restricted user. It is more secure, but not common for many scenarios. |
| Ask | Always be asked before a command is executed. |
4.4.6.3 - Working with Xen Paravirtualization Tool
Using Tools > Clustering Tool, you can setup an appliance virtual environment. The default installation of a Protegrity appliance uses hardware virtualization mode (HVM). The appliance can be reconfigured to use parallel virtualization mode (PVM) to optimize the performance of virtual guest machines.
Protegrity supports these virtual servers:
- Xen®
- Microsoft Hyper-V™
- KVM Hypervisor
XEN paravirtualization details are fully covered in section Xen Paravirtualization Setup. In that section you will find information how to:
- Set up Xen paravirtualization
- Follow the paravirtualization process
4.4.6.4 - Working with the File Integrity Monitor Tool
Using Tools > File Integrity Monitor, you can make a weekly check. The content modifications can be viewed by the Security Officer since the PCI specifications require that sensitive files and folders in the Appliance are monitored. This information contains password, certificate, and configuration files. All changes made to these files can be reviewed by authorized users.
4.4.6.5 - Rotating Appliance OS Keys
When you install the appliance, it generates multiple security identifiers such as, keys, certificates, secrets, passwords, and so on. These identifiers ensure that sensitive data is unique between two appliances in a network. When you receive a Protegrity appliance image or replicate an appliance image on-premise, the identifiers are generated with certain values. If you use the security identifiers without changing their values, then security is compromised and the system might be vulnerable to attacks. Using the Rotate Appliance OS Keys, you can randomize the values of these security identifiers on an appliance. This tool must be run only when you finalize the ESA from a cloud instance.
Set ESA communication and key rotations
When an appliance, such as DSG, communicates with ESA, the Set ESA communication must be performed. Before running the Set ESA communication process, ensure appliance OS keys are rotated.
For example, if the OS keys are not rotated, then you might not be able to add the appliances to a Trusted Appliances Cluster (TAC).
To rotate appliance OS keys:
From the CLI Manager, navigate to to Tools > Rotate Appliance OS Keys.
Enter the root credentials.
The following screen appears.
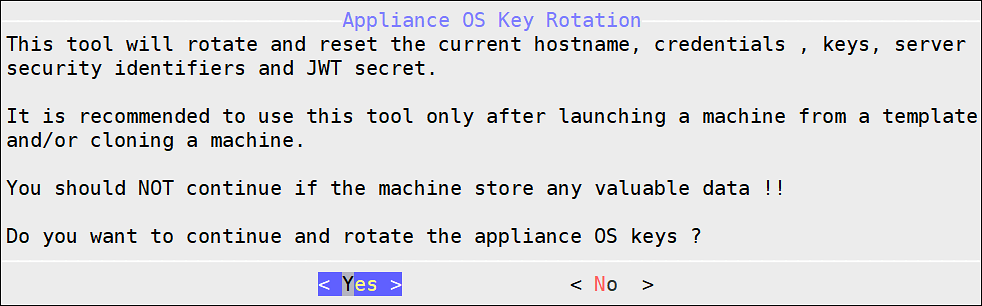
Select Yes.
The following screen appears.
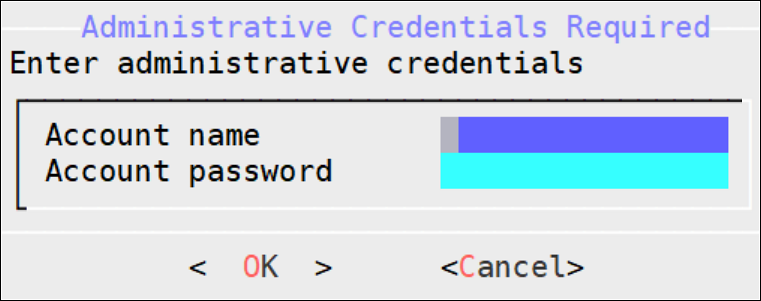
If you select No, then the Rotate Appliance OS Keys operation is discarded.
Enter the administrative credentials and select OK.
The following screen appears.
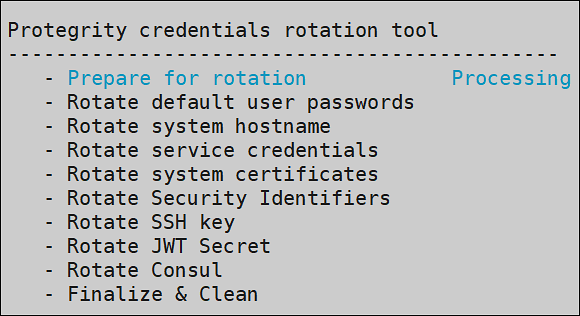
The following screen appears.
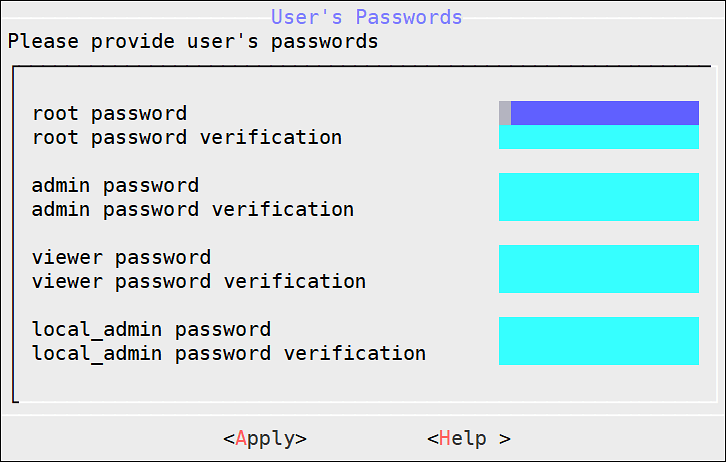
To update the user passwords, provide the credentials for the following users.
- root
- admin
- viewer
- local_admin
If you have deleted any of the default users, such as admin or viewer, those users will not be listed in the User’s Passwords screen.
Select Apply.
The user passwords are updated and the appliance OS keys are rotated.
After rotating appliance keys, rotate the Insight certificates using the steps from Rotating Insight certificates.
4.4.6.6 - Managing Removable Drives
As a security feature, you can restrict access to the removable drives attached to your appliances. You can enable or disable the access to the removable disks, such as, CD/DVD drive or USB Flash drives.
The access to the removable disks is enabled by default.
Disabling CD or DVD drive
To disable CD or DVD drive:
On the CLI Manager, navigate to Tools > Removable Media Management > Disable CD/DVD Drives.
Press ENTER.
The following message appears.
Disabling USB Flash Drive
To disable USB flash drive:
On the CLI Manager, navigate to Tools > Removable Media Management > Disable USB Flash Drives..
Press ENTER.
The following message appears.
Enabling CD or DVD Drive
To enable CD/DVD drive:
On the CLI Manager, navigate to Tools > Removable Media Management > Enable CD/DVD Drives.
Press ENTER.
Enabling USB Flash Drive
To enable USB flash drive:
On the CLI Manager, navigate to Tools > Removable Media Management > Enable Flash Drives.
Press ENTER.
4.4.6.7 - Tuning the Web Services
Using Tools > Web Services Tuning, monitor and configure the Application Protector Web Service Sessions. View information such as Session Shared Memory ID, maximum open sessions, open sessions, free sessions, and session timeout.
CAUTION: It is recommended to contact Protegrity Support before applying any changes for Web Services.
In the Web Services Tuning screen, the following fields can be configured.
Start Servers: In the StartServers field, configure the number of child servers processes created on startup. Since the number of processes is dynamically controlled depending on the load, there is usually no reason to adjust the default parameter.
Minimum Spare Servers: In the MinSpareServers field, set the minimum number of child server processes not handling a request. If the number of such processes is less than configured in the MinSpareServers field, then the parent process creates new children at a maximum rate of 1 per second. It is recommended to change the default value only when dealing with very busy sites.
Maximum Spare Servers: In the MaxSpareServers field, set the maximum number of child server processes not handling a request. When the number of such processes exceeds the number configured in MaxSpareServers, the parent process kills the excessive processes.
It is recommended to change the default value only when dealing with very busy sites. If the value is set lower than MinSpareServers, then it will automatically be adjusted to MinSpareServers value +1.
Maximum Clients: In the MaxClients field, set the maximum number of connections to be processed simultaneously.
Maximum Requests per Child: In the MaxRequestsPerChild field, set the limit on the number of requests that an individual child server will handle during its life. When the number of requests exceeds the value configured in the MaxRequestsPerChild field, the child process dies. If the MaxRequestsPerChild value is set to 0, then the process will never expire.
Maximum Keep Alive Requests: In the MaxKeepAliveRequest field, the maximum number of requests that can be allowed during a persistent connection can be set. If the value is set 0, then the number of allowed request will be unlimited. For maximum performance, leave this number high.
Keep Alive Timeout: In the KeepAliveTimeout field, the number of seconds to wait for the next request from same client on the same connection can be set.
4.4.6.8 - Tuning the Service Dispatcher
The Service Dispatcher parameters are the Apache Multi-Processing Module (MPM) worker parameters. The Apache MPM Worker module implements a multi-threaded multi-process web server that allows it to serve higher number of requests with limited system resources. For more information about the Apache MPM Worker parameters, refer to https://httpd.apache.org/docs/2.2/mod/worker.html.

To improve service dispatcher performance, navigate to Tools > Service Dispatcher Tuning.
The following table provides information about the configurable parameters and recommendations for Service Dispatcher performance.
| Parameter | Default Value | Description |
|---|---|---|
| StartServers | 64 | The number of apache server instances that start at the beginning when you start Apache. It is recommended not to enter the StartServers value more than the value for MaxSpareThreads, as this results in processes being terminated immediately after initializing. |
| ServerLimit | 1600 | The maximum number of child processes. It is recommended to change the ServerLimit value only if the values in MaxClients and ThreadsPerChild need to be changed. |
| MinSpareThreads | 512 | The minimum number of idle threads that are available to handle requests. It is recommended to keep the MinSpareThreads value higher than the estimated requests that will come in one second. |
| MaxSpareThreads | 1600 | The maximum number of idle threads. It is recommended to reserve adequate resources to handle MaxClients. If MaxSpareThreads are insufficient, the webserver will terminate and frequently create child processes, reducing performance. |
| ThreadLimit | 512 | The upper limit of the configurable threads per child process. To avoid unused shared memory allocation, it is recommended not to set the ThreadLimit value much higher than the ThreadsPerChild value. |
| ThreadsPerChild | 288 | The number of threads created by each child process. It is recommended to keep the ThreadsPerChild value such that it can handle common load on the server. |
| MaxRequestWorkers | 40000 | The maximum number of requests that can be processed simultaneously. It is recommended to take into consideration the expected load when setting the MaxRequestWorkers values. Any connection that comes over the load, will drop, and the details can be seen in the error log. Error log file path - /var/log/apache2-service_dispatcher/errors.log |
| MaxConnectionsPerChild | 0 | The maximum number of connections that a child server process can handle in its life. If the MaxConnectionsPerChild value is reached, this process expires. It is recommended to set the MaxConnectionsPerChild value to 0, so that this process never expires. |
4.4.6.9 - Working with Antivirus
The AntiVirus program uses ClamAV, an open source and cross-platform antivirus engine designed to detect malicious trojan, virus, and malware threats. A single file or directory, or the whole system can be scanned. Infected file or files are logged and can be deleted or moved to a different location, as required.
The Antivirus option allows you to perform the following actions.
| Option | Description |
|---|---|
| Scan Result | Displays the list of the infected files in the system. |
| Scan now | Allows the scan to start. |
| Options | Allows access to customize the antivirus scan options. |
| View log | Displays the list of scan logs. |
Customizing Antivirus Scan Options from the CLI
To customize Antivirus scan options from the CLI:
Go to Tools > AntiVirus.
Select Options.
Press ENTER.
The following table provides a list of the choices available to you to customize scan options.
Table 1. List of all scan options
Option Selection Description Action Ignore Ignore the infected file and proceed with the scan. Move to directory Move the infected files to specific directory. In the text box, enter the path where the infected file should be moved.Delete infected file Remove the infected file from the directory. Recursive True Scan sub-directories. False Do not scan sub-directories. Scan directory Path of the directory to be scanned.
4.4.6.10 - Forwarding system logs to Insight
Log in to the CLI Manager on the ESA or the appliance.
Navigate to Tools > PLUG - Forward logs to Audit Store.

Enter the password for the root user and select OK.

Enter the IP address of all the nodes in the Audit Store cluster with the Ingest role and select OK. Specify multiple IP addresses separated by comma.
To identify the node with the Ingest roles, log in to the ESA Web UI and navigate to Audit Store > Cluster Management > Overview > Nodes.

Enter y to fetch certificates and select OK.
Specifying y fetches td-agent certificates from target node. These certificates can then be used to validate and connect to the target node. They are required to authenticate with Insight while forwarding logs to the target node. The passphrase for the certificates are stored in the /etc/ksa/certs directory.
Specify n if the certificates are already available on the system, fetching certificates are not required, or custom certificates are to be used.

Enter the credentials for the admin user of the destination machine and select OK.

The td-agent service is configured to send logs to Insight and the CLI menu appears.
4.4.6.11 - Rotating Insight certificates

For more information about rotating the Insight certificates, refer here.
4.4.6.12 - Applying Audit Store Security Configuration
- From the ESA Web UI, navigate to System > Services > Audit Store.
- Start the Audit Store Repository service.
- Open the ESA CLI.
- Navigate to Tools.
- Run Apply Audit Store Security Configs.
- Select Exit on the completion screen.
4.4.6.13 - Setting the total memory for the Audit Store Repository
The RAM allocated for the Audit Store on the appliance is set to a optimal default value. If this value is not as per the existing requirement, then use this tool to modify the RAM allocation. However, when certain operations are performed, such as, when the role for the node is modified or a node is removed from the cluster, then the value set is overwritten. Additionally, the RAM allocation reverts to the optimal default value. In this case, perform these steps again for setting the RAM allocation after modifying the role of the node or adding a node back to the Audit Store cluster.
From the ESA Web UI, navigate to System > Services > Audit Store.
Start the Audit Store Repository service.
Open the ESA CLI.
Navigate to Tools.
Run Set Audit Store Repository Total Memory.
Enter the password for the root user and select OK.
Specify the total memory that must be allocated for the Audit Store Repository and select OK.
Select Exit to return to the menu.
Repeat the steps on the remaining nodes, if required.
4.4.6.14 - Forwarding audit logs to Insight
The example provided here is for DSG. Refer to the specific protector documentation for the protector configuration.
Log in to the CLI Manager on the appliance.
Navigate to Tools > ESA Communication.

Enter the password of the root user of the appliance and select OK.

Select the Logforwarder configuration option, press Tab to select Set Location Now, and press Enter.
The ESA Location screen appears.

Select the ESA to connect with, then press Tab to select OK, and press ENTER.
The ESA selection screen appears.

To enter the ESA details manually, select the Enter manually option. A prompt is displayed to enter the ESA IP address or hostname.
Enter the ESA administrator username and password to establish communication between the ESA and the appliance. Press Tab to select OK and press Enter.
The Enterprise Security Administrator - Admin Credentials screen appears.

Enter the IP address or hostname for the ESA. Press Tab to select OK and press ENTER. Specify multiple IP addresses separated by comma. To add an ESA to the list, specify the IP addresses of all the existing ESAs in the comma separated list, and then specify the IP for the additional ESA.
The Forward Logs to Audit Screen screen appears.

After successfully establishing the connection with the ESA, the following summary dialog box appears. Press Tab to select OK and press Enter.

Repeat step 1 to step 8 on all the appliance nodes in the cluster.
4.4.6.15 - Exporting alerting configurations
The configurations can be used as a backup or a template for importing on the same system or a different system. This feature is available from v10.2.0.
To export the configuration:
- Open the ESA CLI.
- Navigate to Tools.
- Run Export Alerting Configurations.
- Enter the password for the root user.
- Select OK.
- Specify a file name or a directory with the file name. If the directory does not exist, then it is created. If the file already exists, it is overwritten.
- Select OK. The export file is created in the
/opt/protegrity/insight/alerting_exportdirectory. - Select Exit to return to the main menu.
4.4.6.16 - Importing alerting configurations
The file to import must be located in the /opt/protegrity/insight/alerting_export directory. This utility imports all the alerting configurations specified in the exported file. The existing alerts on the system are retained. However, any alert configuration with the same name are overwritten.
To import the configuration:
- Open the ESA CLI.
- Navigate to Tools.
- Run Import Alerting Configurations.
- Enter the password for the root user.
- Select OK.
- Specify the file name or the directory with the file name.
- Select OK. The configurations are imported.
- Select Exit on the success message screen to return to the main menu.
4.4.7 - Working with Preferences
Set up the console preferences using the Preferences menu.

The following preferences can be configured:
- Show system monitor on OS Console
- Require password for CLI system tools
- Show user Notifications on CLI load
- Minimize the timing differences
- Set uniform response time for failed login
- Enable root credentials check limit
- Enable AppArmor
- Enable FIPS Mode
- Basic Authentication for REST APIs
4.4.7.1 - Viewing System Monitor on OS Console
You can choose to show a performance monitor before switching to OS Console. If you choose to show the monitor, then the dialog delays for one second before the initialization of the OS Console. The value must be set to Yes or No.
4.4.7.2 - Setting Password Requirements for CLI System Tools
Many CLI tools and utilities require different credentials, such as root and admin user credentials. You can choose to require or not to require a password for CLI system tools. The value must be set to Yes or No.
Specifying No here will allow the user to execute these tools without having to enter the system passwords. This can be useful when the system administrator is the security manager as well. This setting is not recommended since it makes the Appliance less secure.
4.4.7.3 - Viewing user notifications on CLI load
You can choose to display notifications in the CLI home screen every time a user logs in to the ESA. These notifications are specific to the user. The value must be set to Yes or No.
4.4.7.4 - Minimizing the Timing Differences
Sign in to the appliance to access different features provided. If incorrect credentials are used to sign in, the request is denied and the server sends an appropriate response indicating the reason for failure to log in. The time taken to send the response varies based on the different authentication failures, such as invalid password, invalid username, expired username, and so on. This time interval is vulnerable to security attacks for obtaining valid users from the system. Thus, to mitigate such attacks, the time interval to reduce the response time between an incorrect sign-in and server response can be minimized. To enable this setting, toggle the value of the Minimize the timing differences option from the ESA CLI Manager to Yes.
The default value of the Minimize the timing differences option is No.
When trying to log in with a locked user account, a notification indicating that the user account is locked appears. This notification will not appear when the value of Minimize the timing differences option is Yes. Instead you will get a notification indicating that the username or password is incorrect.
4.4.7.5 - Setting a Uniform Response Time
If invalid credentials are used to login to the ESA Web UI, then the time taken to respond to various authentication scenario failures, varies. The various scenarios can be invalid username, invalid password, expired username, and so on. This variable time interval may introduce a timing attack on the system.
To reduce the risk of a timing attack, reduce the variable time interval and specify a response time to handle invalid credentials. Thus, the response time for the authentication scenarios remains the same.
The response time for the authentication scenarios are based on different factors such as, hardware configurations, network configurations, and system performance. Thus, the standard response time would differ between organizations. It is therefore recommended to set the response time based on the settings in the organization.
For example, if the response time for a valid login scenario is 5 seconds, then set the uniform response time as 5.
Enter the time interval in seconds and select OK to enable the feature. Alternatively, enter 0 in the text box to disable the feature.
4.4.7.6 - Limiting Incorrect root Login
If an incorrect password is used to log in to a system, the permission to access the system is denied. Multiple attempts to log in with an incorrect password opens a route to brute force attacks on the system. Brute force is an exhaustive hacking method, where a hacker guesses a user password over successive incorrect attempts. Using this method, a hacker gains access to a system for malicious purposes.
In our appliances, the root user has access to various operations in the system such as accessing OS console, uploading files, patch installation, changing network settings, and so on. A brute force attack on this user might render the system vulnerable to other security attacks. Therefore, to secure the root login, limit the number of incorrect password attempts to the appliance. On the Preferences screen, enable the Enable root credentials limit check option to limit an LDAP user from entering incorrect passwords for the root login. The default value of the Enable root credentials limit check option is Yes.
If you enable the Enable root credentials limit check, the LDAP user can login as root only with a fixed number of successive incorrect attempts. After the limit on the number of incorrect attempts is reached, the LDAP user is blocked from logging in as root, thus preventing a brute force attack. After the locking period is completed, the LDAP user can login as root with the correct password.
When you enter an incorrect password for the root login, the events are recorded in the logs.
By default, the root login is blocked for a period of five minutes after three incorrect attempts. You can configure the number of incorrect attempts and the lock period for the root login.
For more information about configuring the lock period and successive incorrect attempts, contact Protegrity Support.
4.4.7.7 - Enabling Mandatory Access Control
For implementing Mandatory Access Control, the AppArmor module is introduced on Protegrity appliances. Define the profiles for protecting files that are present in the appliance.
4.4.7.8 - FIPS Mode
The Federal Information Processing Standards (FIPS) defines guidelines for data processing. These guidelines outline the usage of the encryption algorithms and other data security measures before accessing the data. Only a user with administrative privileges can access this functionality.
For more information about the FIPS, refer to https://www.nist.gov/standardsgov/compliance-faqs-federal-information-processing-standards-fips.
Enabling the FIPS Mode
To enable the FIPS mode:
Log in to the ESA CLI Manager and navigate to Preferences.
Enter the root password and click OK.
The Preferences screen appears.

Select the Enable FIPS Mode.
Press Select.
The Enable FIPS Mode dialog box appears.

Select Yes and click OK.
The following screen appears.

For more information on the anti-virus settings, refer here.
Click OK.
The following screen appears. Click OK.

After the FIPS mode is enabled, restart the ESA to apply the changes.
Disabling the FIPS Mode
To disable the FIPS mode:
Log in to the ESA CLI Manager and navigate to Preferences.
Enter the root password and click OK.
The Preferences screen appears.

Select the Enable FIPS Mode.
Press Select.
The Enable FIPS Mode dialog box appears.

Select No and click OK.
The following screen appears. Click OK.

After the FIPS mode is disabled, restart the ESA to apply the changes.
4.4.7.9 - Basic Authentication for REST APIs
The Basic Authentication mechanism provides only the user credentials to access protected resources on the server. The user credentials are provided in an authorization header to the server. If the credentials are accurate, then the server provides the required response to access the APIs.
For more information about the Basic Authentication, refer here.
Disabling the Basic Authentication
To disable the Basic Authentication:
Log in to the ESA CLI Manager and navigate to Preferences.
Enter the root password and click OK.
The Preferences screen appears.

Select the Basic Authentication for Rest APIs.
Press Select.
The Basic Authentication for REST APIs dialog box appears.

Select No and click OK.
The message Basic Authentication for REST APIs disabled successfully appears.
Click OK.
Important: If the Basic Authentication is disabled, then the following APIs are affected:
- GetCertificate REST API: Fetch certificate to protector.
- DevOps API: Policy Management REST API.
- RPS REST API: Resilient Package Immutable REST API.
The getcertificate stops working for the 9.1.x protectors when the Basic Authentication is disabled.
However, the DevOps and RPS REST APIs can also use the Certificate and JWT Authentication support.
Enabling the Basic Authentication
To enable the Basic Authentication:
Log in to the ESA CLI Manager and navigate to Preferences.
Enter the root password and click OK.
The Preferences screen appears.

Select the Basic Authentication for REST APIs.
Press Select.
The Basic Authentication for REST APIs dialog box appears.

Select Yes and click OK.
The message Basic Authentication for REST APIs enabled successfully appears.
Click OK.
4.5 - Web User Interface (Web UI) Management
The Web UI is a web-based environment for managing status, policy, administration,networking, and so on. The options that are performed using the CLI manager can also be performed using the Web UI.
4.5.1 - Working with the Web UI
The following screen displays the ESA Web UI.
The following table describes the details of options available on the Web UI menu.
| Options | Description |
|---|---|
| Dashboard | View user notifications, disk usage, alerts, server details, memory / CPU / network utilization, and cluster status |
| Policy Management | Manage creating and deploying policies. For more information about policies, refer Policy Management. |
| Key Management | Manage master data. For more information about keys, refer to the Key Management. |
| System | Configure Trusted Appliances Cluster, set up backup and restore, view system statistics, graphs, information, and manage services. |
| Logs | View logs that are generated for web services. |
| Settings | Configure network settings, set up certificates, manage users, roles, and licenses. |
| Audit Store | Manage the repository for all audit data and logs. For more information about the Audit Store, refer Audit Store. View dashboards that display information using graphs and charts for a quick understanding of the protect, unprotect, and reportect transactions performed. For more information about dashboards, refer Dashboards. |
The following figure describes the icons that are visible on the ESA Web UI.
| Icon | Description |
|---|---|
 | Download support logs, view product documentation, and view the version information about the ESA and its components. |
 | Extend session timeout |
 | Notifications and alerts |
 | Edit profile or sign out of the profile |
 | Power off or restart the system |
Logging into the ESA Web UI
Log in to the ESA Web User Interface (Web UI) to manage the appliance settings and monitor your appliance.
- When you login through the CLI or the Web UI for the first time, with the password policy enabled, the Update Password screen appears. It is recommended that to change the password since the administrator sets the initial password.
- It is recommended to configure the browser settings such that passwords are not saved. If the password is saved, then on the next login, it would start the session as a previously logged-in user.
The following screen displays the login screen of the Web UI.
To log in to the ESA Web UI:
- From the web browser, type the Management IP address for the ESA using HTTPS protocol, for example, https://10.0.0.185/.The Web Interface splash screen appears.
- Enter the user credentials.If the credentials are approved, then the ESA Dashboard appears.
Viewing user notifications
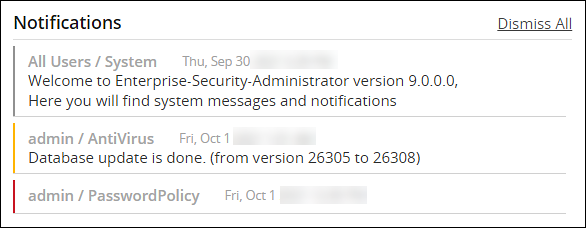
There is a message at the top of the screen with the number of notifications that appear on this page and other web pages. If you click on the notification, then it is directed to the Services and Status screen.
Alternatively, you can store the messages in the Audit Store and use Discover to view the detailed logs.
You can delete the messages after reading them.
The messages that are older than a year are automatically deleted from the User Notification list, but retained in the logs.
On the User Notifications area of the ESA, the notifications and events occurring on the appliances communicating with it are also visible.
For the notifications to appear on the ESA, ensure that same set of client key pair are present on the ESA and the appliances that communicate with the ESA.For more information about certificates, refer Certificate Management.
Scheduled tasks generate some of these messages. To view a list of scheduled tasks that generate these messages, navigate to System > Task Scheduler.
Logging out of the ESA Web UI
There are two ways to log off the ESA Web UI.
- Log off as a user, while the ESA continues to run.
- Restart or shut down the ESA.
In case of cloud platforms, such as, Azure, AWS or GCP, the instances run the appliance.
To log out as a user:
Click the second icon that appears on the right of the ESA Toolbar.
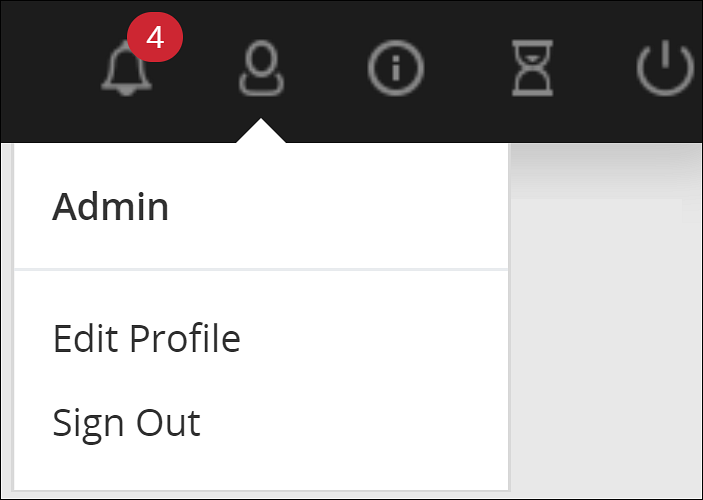
Click Sign Out.
The login screen appears.
Shutting down the ESA
The Reboot option shuts down the ESA and restarts it again. Users will need to login again when the authentication screen appears.
With cloud platforms such as Azure, AWS, or GCP, the instances run the appliance. Powering off the instance from the cloud console may not shut down the ESA gracefully. It is recommended to power off from the CLI Manager or Web UI.
To shut down the ESA:
Click the last icon from ESA Toolbar.
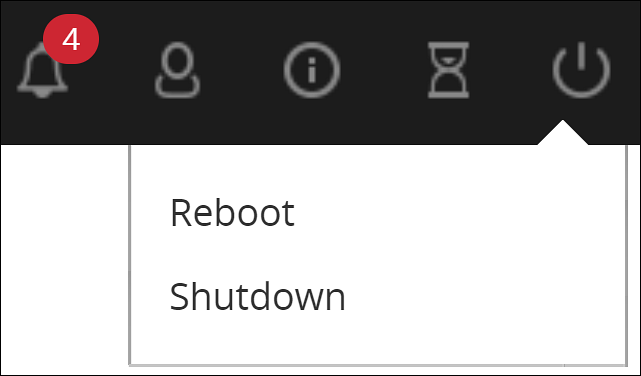
Click Shutdown.
Enter your password to confirm.
Provide the reason for the shut down and click OK.
The ESA server shuts down. The Web UI screen may continue to display on the window; however, the Web UI does not work.
4.5.2 - Description of ESA Web UI
The ESA Web UI appears upon successful login. This page shows the Host to which you are attached, IP address, and the current user logged on.
This operation might require a few minutes to begin.
The different menu options are given in the following table.
| Option | Using this navigation menu you can | Applicable to |
|---|---|---|
| Dashboard | A view-only window, which provides status at a glance – service, server, notifications, disk usage, and graphical representation of CPU, memory, and network usage. | All |
| Policy Management | Used to create data stores, data elements, masks, roles, keys, and deploy a policy. | ESA |
| Key Management | Used to view information, rotate, or change the key states of the Master Key, Repository Key, and Data Store Keys. View information for the active Key Store or switch the Key Store. | ESA |
| System |
| All |
| Logs | Used to view logs for separate tasks such as web services engine, policy management, DFSFP, and Appliance. | ESA |
| Settings |
| All |
| Audit Store | A repository for all audit data and logs. It is used to initialize analytics, view and analyze Insight dashboards, and manage cluster. | ESA |
| Cloud Gateway | Used to create certificate, tunnel, service, Rules for traffic flow management, add DSG nodes to cluster, monitor cluster health, view logs. | DSG |
The following graphic illustrates the different panes in the ESA Web UI.
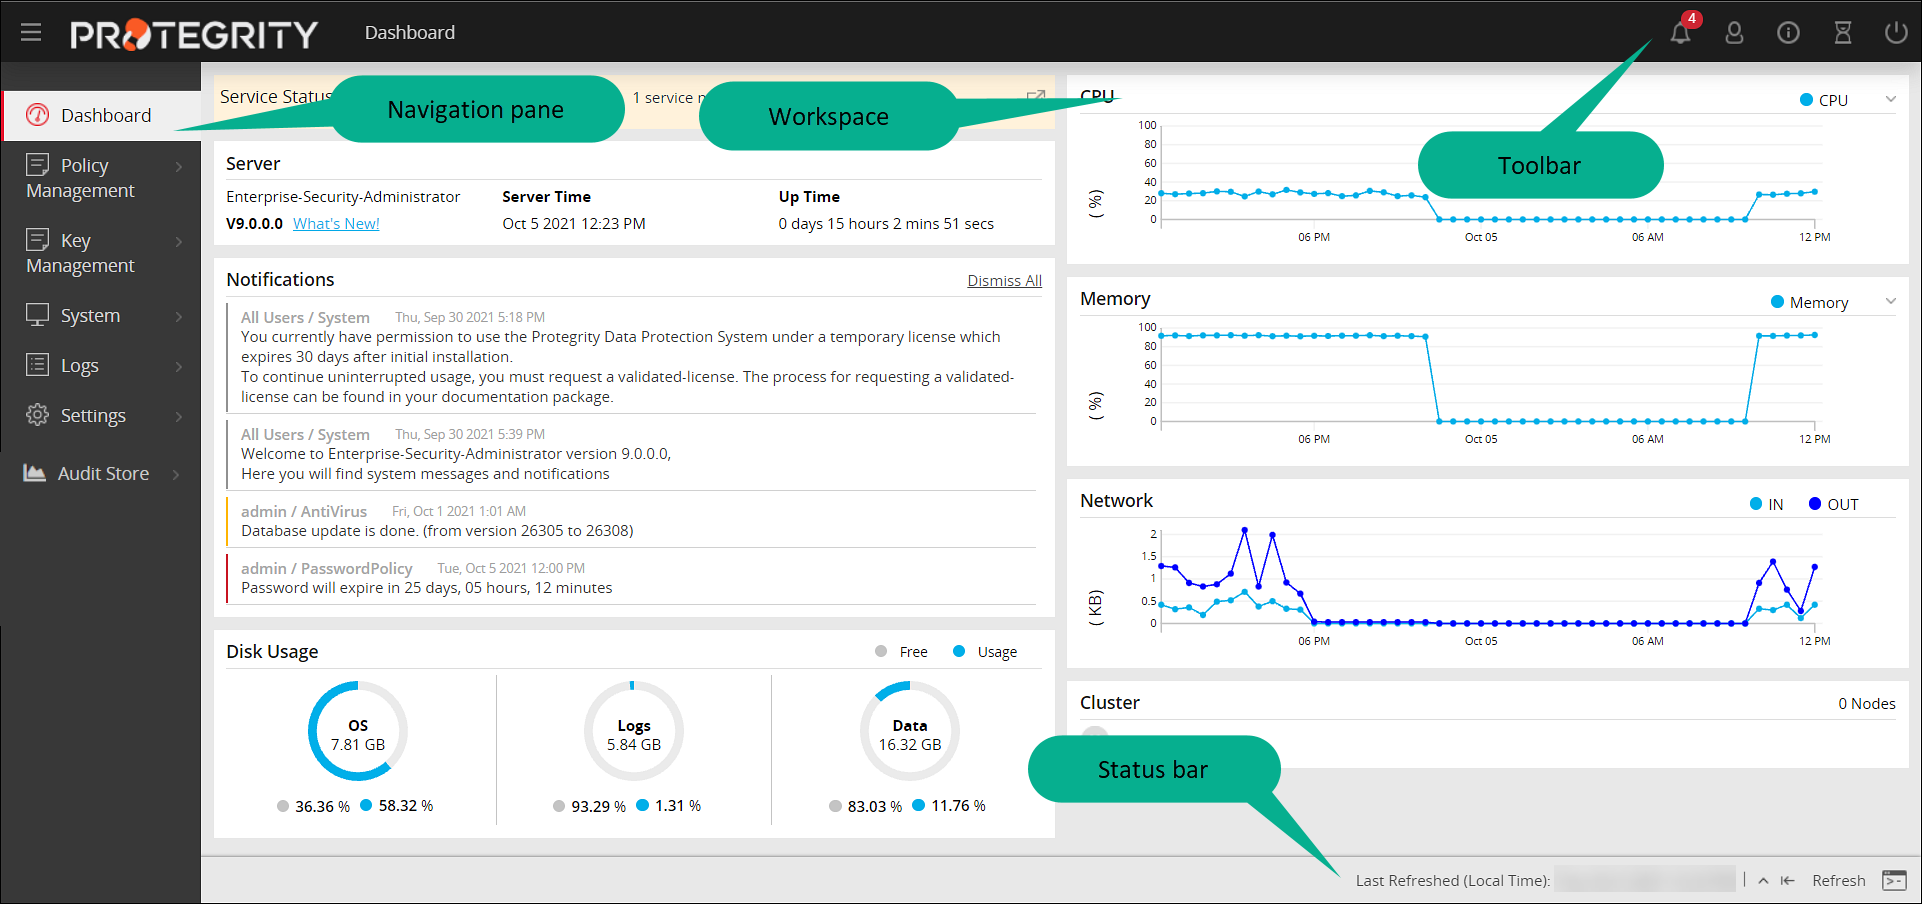
| Component | Description |
|---|---|
| Navigation Pane | The number of options in the navigation menu depends on the installed ESA. The functionality is also restricted based on the user permissions. You could have read-write or read-only permissions for certain options. Using the different options, you can create a policy, add a user, run a few security checks such as file integrity or scan for virus, review or change the network settings, among others. |
| Workspace | This window on the right includes either displayed information or fields where information needs to be added. When an option is selected, the resulting window appears. |
| Status Bar | The bar at the bottom displays the last refresh activity time. Also, if you click the rectangle a separate ESA CLI screen opens. All these options are available in the CLI screen as well. |
| Toolbar | This bar at the top displays the name of the currently open window on the left and icons on the right. |
The details of the icons in the toolbar is as follows:
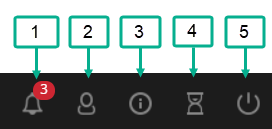
| Component | Icon Name | Description |
|---|---|---|
| 1 | Notification | The number is the total number of unopened messages for you. |
| 2 | User | Change your password or log out as a user. ESA continues to run. |
| 3 | Help | Download the file(s) that are required by Protegrity Support for troubleshooting, view the product documentation, and view the version information about the ESA and its components. |
| 4 | Session | Extend the session without timing out. You have to enter your credentials again to login. |
| 5 | Power Option | Reboot or shut down the ESA, after ensuring that the ESA is not being used. |
Support
The Help option on the toolbar, allows you to download information about the status of the ESA and other services that is sometimes required by Protegrity Services to troubleshoot.
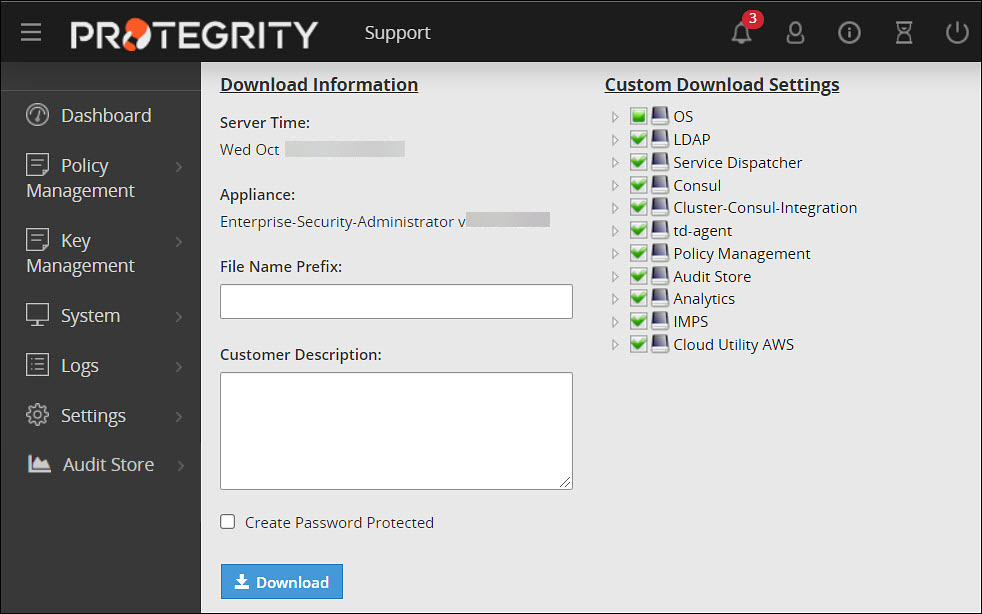
Check the boxes that you require and optionally provide a prefix to the automatically generated file name. You may optionally add a description and protect the resulting zip file and all the xml files inside with a password.
Viewing Version of the Installed Components of the ESA
The  > About option on the toolbar allows you to view the version information about the ESA and its components.
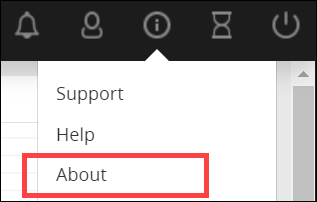
The following figure shows the version information of the installed components of the ESA.
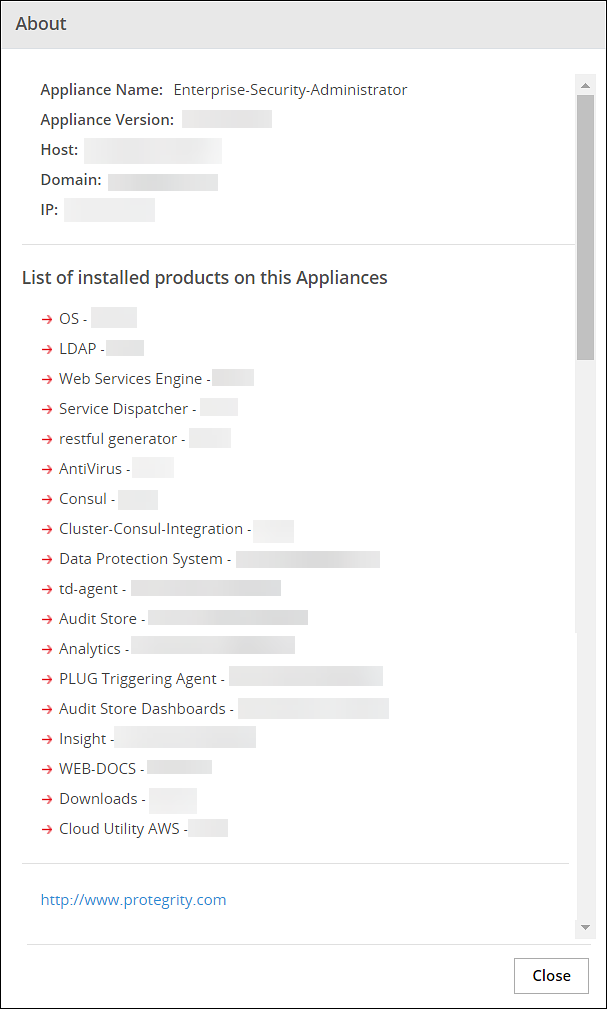
For example, you can view the version of the Data Protection System (DPS) that is being used.
Extending Timeout from ESA
The following icons are available on the top right corner of the ESA Web UI page.

The hourglass icon enables you to extend the working time for the ESA. To extend the timeout for the ESA Web UI, click on the hourglass icon.
A message appears mentioning Session timeout extended successfully.
4.5.3 - Working with System
The System Information navigation folder includes all information about the appliance listed below.
- Services and their statuses
- The hardware and software information
- Performance statistics
- Graphs
- Real-time graphs
- Appliance logs
System option available on the left pane provides the following options:
| System Options | Description |
|---|---|
| Services | View and manage OS, logging and reporting, policy management and other miscellaneous services. |
| Information | View the health of the system. |
| Trusted Appliances Cluster | View the status of trusted appliances clusters and saved files. |
| System Statistics | View the performance of the hardware and networks. |
| Backup and Restore | Take backups of files and restore these, as well as take backups of full OS and log files. |
| Task Scheduler | Schedule tasks to run in the background such as anti-virus scans and password policy checks, among others. |
| Graphs | View how the system is running in a graphical form. |
4.5.3.1 - Working with Services
You can manually start, restart, and stop services in the appliance. You can act upon all services at once, or select specific ones.
In the System > Services page, the tabs list the available services and their statuses. The Information tab appears with the system information like the hardware information, system properties, system status, and open ports.
Although the services can be started or stopped from the Web UI, the start/stop/restart action is restricted for some services. These services can be operated from the OS Console.Run the following command to start/stop/restart a service.
/etc/init.d/<service_name> stop/start/restart
For example, to start the docker service, run the following command.
/etc/init.d/docker start
If you stop the Service Dispatcher service from the Web UI, you might not be able to access ESA from the Web browser. Hence, it recommended to stop the Service Dispatcher service from the CLI Manager only.
Web Interface Auto-Refresh Mode
You can set the auto-refresh mode to refresh the necessary information according to a set time interval. The Auto-Refresh is available in the status bar that show the dynamically changing status information, such as status and logs. Thus, for example, an Auto Refresh pane is available in System > Services, at the bottom of the page.
The Auto-Refresh pane is not shown by default. You should click the Auto-Refresh button to view the pane.
To modify the auto-refresh mode, from the Appliance Web Interface, select the necessary value in the Auto-Refresh drop-down list. The refresh is applied in accordance with the set time.
4.5.3.2 - Viewing information, statistics, and graphs
Viewing System Information
All hardware information, system properties, system statuses, open ports and firewall rules are listed in the Information tab.
The information is organized into sections called Hardware, System Properties, System Status, Open Ports, and Firewall.
Hardware section includes information on system, chipset, processors, and amount of total RAM.
System Properties section appears with information on current Appliance, logging server, and directory server.
System Status section lists such properties as data and time, boot time, up time, number of logged in users, and average load.
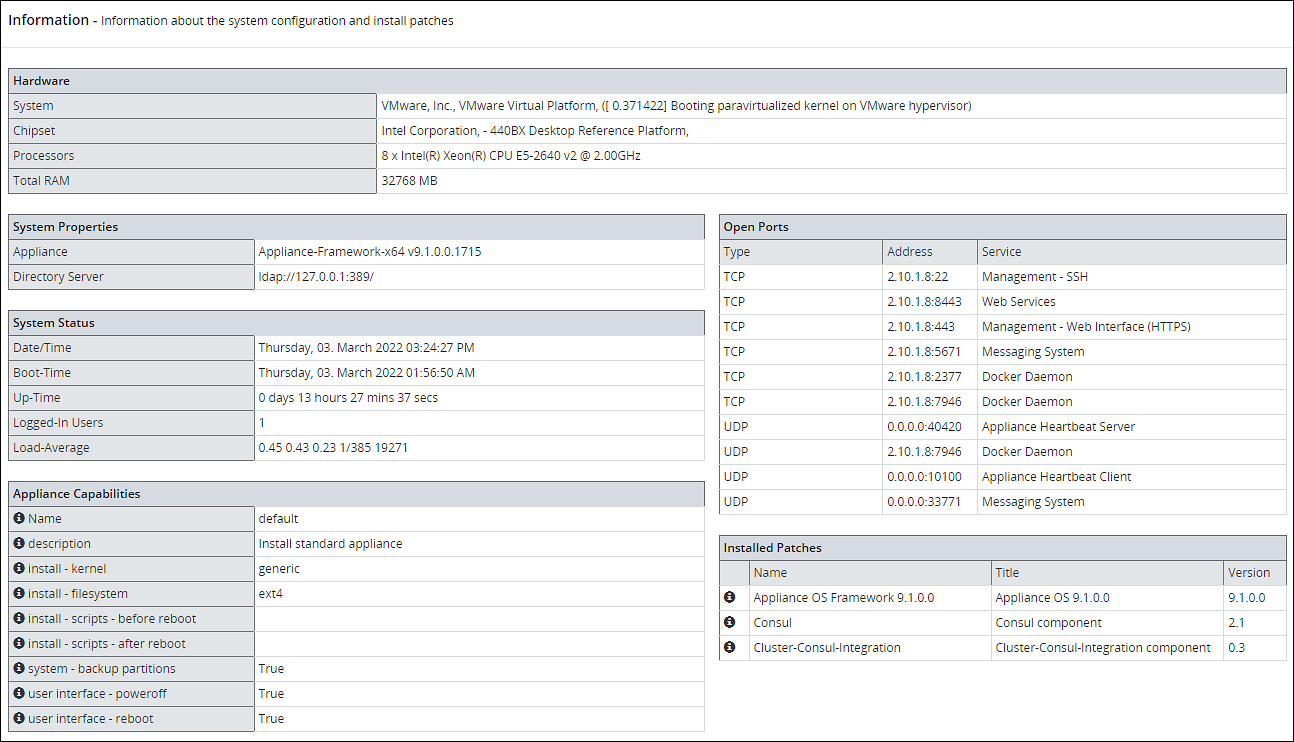
Open Ports section lists types, addresses, and names of services that are running.
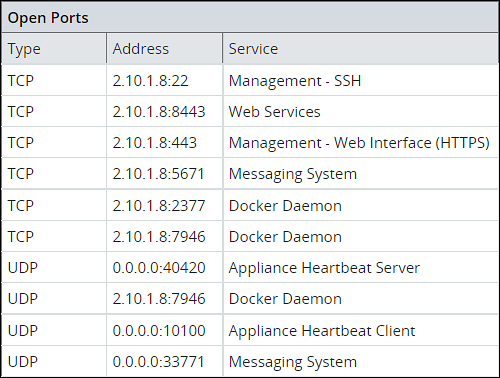
Firewall section in System > Information lists all firewall rules, firewall status (enabled/disabled), and the default policy (drop/accept) which determines what to do on packets that do not match any existing rule.
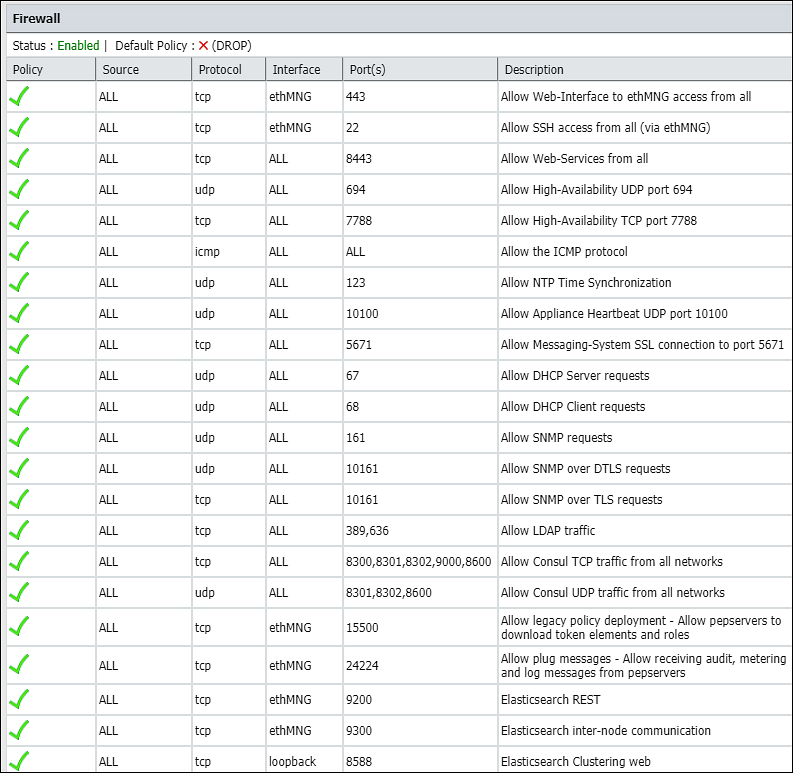
Viewing System Statistics
Using System > System Statistics, you can view performance statistics to assess system usage and efficiency. The Performance page refreshes itself every few seconds and shows the statistics in real time.
The Performance page shows system information:
- Hardware - System, chipset, processors, total RAM
- System Status - Date/time, boot time, up-time, users connected, load average
- Networking - Interface, address, bytes sent/received, packets sent/received
- Partitions - Partition name and size, used and avail
- Kernel - Idle time, kernel time, I/O time, user time
- Memory - Memory total, swap cached, and inactive, among others
You can customize the page refresh rate, so that you are viewing the latest information at any time.
Viewing Performance Graphs
Using System > Graphs, you can view performance graphs and real-time graphs in addition to statistics. In the Performance tab you can view a graphical representation of performance statistics from the past 5 minutes or past 24 hours for these items:
- CPU application use - % CPU I/O wait, CPU system use
- Total RAM - Free RAM, used RAM
- Total Swap - Free Swap, used Swap
- Free RAM
- Used RAM
- System CPU usage
- Application CPU use, %
- Log space used - Log space available, log space total
- Application data used - Application data available space, application data total size
- Total page faults
- File descriptor usage
- ethMNG incoming/ethMNG outgoing
- ethSRV0 incoming/ethSRV0 outgoing
- ethSRV1 incoming/ethSRV1 outgoing
In the Realtime Graphs tab you can monitor current state of performance statistics for these items:
- CPU usage
- Memory Status - free and used RAM
The following figure illustrates the Realtime Graphs tab.
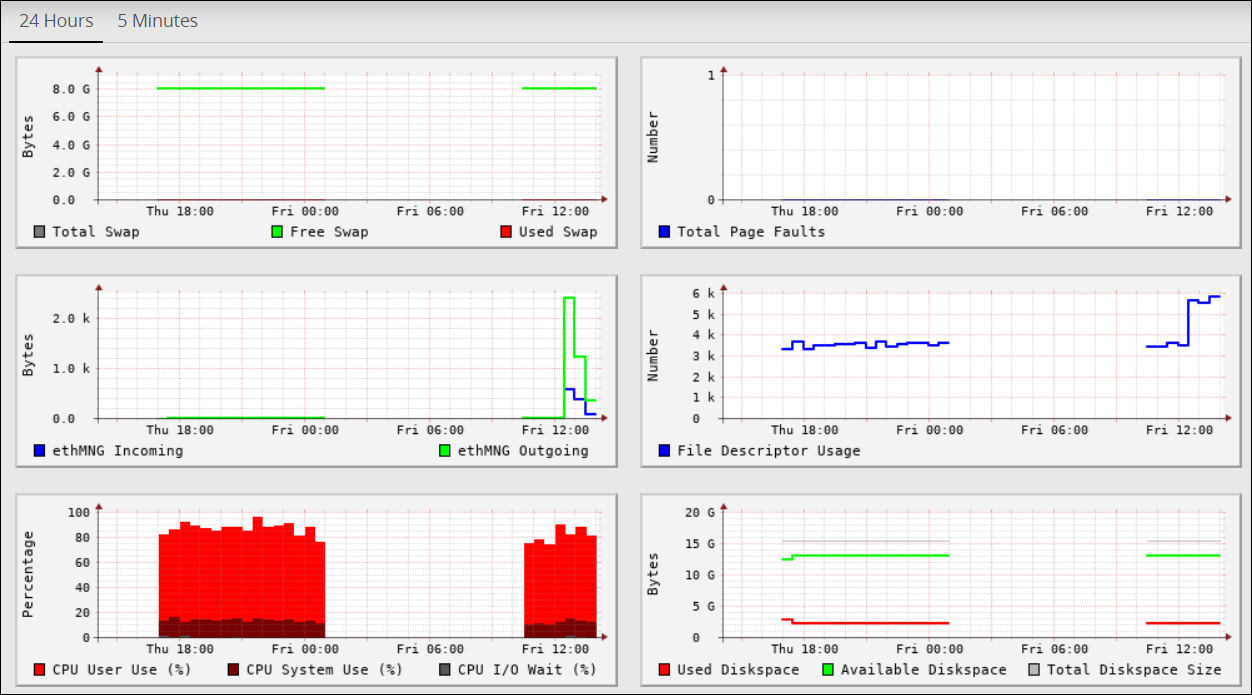
4.5.3.3 - Working with Trusted Appliances Cluster
The Clustering menu becomes available in the appliance Web Interface, System > Trusted Appliance Cluster. The status of the cluster is by default updated every minute, and it can be configured using Cluster Service Interval, available in the CLI Manager.
Status tab appears with the information on nodes which are in the cluster. In the Filter drop-down combo box, you can filter the nodes by the name, address and label.
In the Display drop-down combo box, you can select to display node summary, top 10 CPU consumers, top 10 Memory consumers, free disk report, TCP/UDP network information, system information, and display ALL.
Saved Files tab appears with the files that were saved in the CLI Manager. These files show the status of the appliance cluster node or the result of the command run on the cluster.
4.5.3.4 - Working with Backup and restore
The backup process copies or archives data. The restore process ensures that the original data is restored if data corruption occurs.
You can back up and restore configurations and the operating system from the Backup/Restore page. It is recommended to have a backup of all system configurations.
The Backup/Restore page includes Export, Import, OS Full, and Log Files tabs, which you can use to create configuration backups and restore them later.
Using Export, you can also export a configuration to a trusted appliances cluster, and schedule periodic replication of the configuration on all nodes that are in the trusted appliances cluster. Using export this way, you can periodically update the configuration on all, or just necessary nodes of the cluster.
Using Import, you can restore the created backups of the product configurations and appliance OS core configuration.
Using Full OS Backup, you can create backup of the entire appliance OS.
The Full OS Backup/Restore features of the Protegrity appliances is available only for the on-premise deployments. It is not available for virtual machines created using an OVA template and cloud-based virtual machines.
4.5.3.4.1 - Working with OS Full Backup and Restore
It is recommended to perform the full OS back up before any important system changes, such as appliance upgrade or creating a cluster, among others.
This option is available only for the on-premise deployments. It is not available for virtual machines created using an OVA template and cloud-based virtual machines.
Backing up the appliance OS
The backup process may take several minutes to complete.
Perform the following steps to back up the appliance OS.
Log in to the Appliance Web UI.
Proceed to System > Backup > Restore.
Navigate to the OS Full tab and click Backup.
A confirmation message appears.
Press ENTER.
The Backup Center screen appears and the OS backup process is initiated.
Navigate to Appliance Dashboard.A notification O.S Backup has been initiated appears. After the backup is complete, a notification O.S Backup has been completed appears.
Restoring the appliance OS
Use caution when restoring the appliance OS. Consider a scenario where it is necessary to restore a full OS backup that includes the external Key Store data. If the external Key Store is not working, then the HubController service does not start after the restore process.
Perform the following steps to restore the appliance OS.
- Login to the Appliance Web UI.
- Proceed to System > Backup & Restore.
- Navigate to the OS Full tab and click Restore.A message that the restore process is initiated appears.
- Select OK.The restore process starts and the system restarts after the process is completed.
- Log in to the appliance and navigate to Appliance Dashboard.A notification O.S Restore has been completed appears.
4.5.3.4.2 - Backing up the data
Using the Export tab, you can create backups of the product configurations and/or appliance OS core configuration.
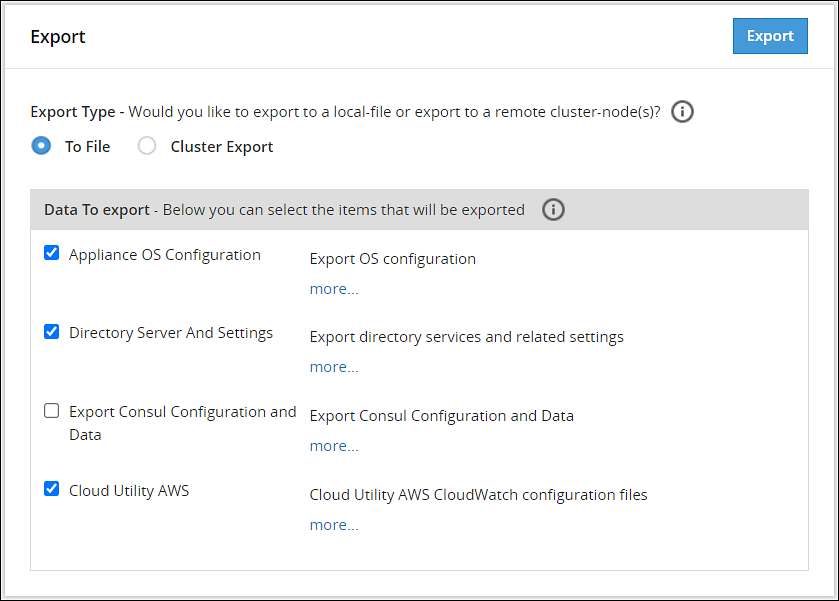
Before you begin
Starting from the Big Data Protector 7.2.0 release, the HDFS File Protector (HDFSFP) is deprecated. The HDFSFP-related sections are retained to ensure coverage for using an older version of Big Data Protector with the ESA 7.2.0.
If you plan to use ESAs in a Trusted Appliances Cluster, and you are using HDFSFP with the DFSFP patch installed on the ESA, then ensure that you clear the DFSFP_Export check box when exporting the configurations from the ESA, which will be designated as the Master ESA.
In addition, for the Slave ESAs, ensure that the HDFSFP datastore is not defined and the HDFSFP service is not added.
The HDFSFP data from the Master ESA should be backed up to a file and moved to a backup repository outside the ESA. This will help in retaining the data related to HDFSFP, in cases of any failures.
Backing up configuration to local file
Perform the following steps to backup the configuration to local file.
- Navigate to System > Backup & Restore > Export.
- In the Export Type area, select To File radio button.
- In the Data To export area, select the items to be exported.Click more.. for the description of every item.
- Click Export.The Output File screen appears.
- Enter information in the following fields:
- Output File: Name of the file.
If you want to replace an existing file on the system with this file, click the Overwrite existing file check box. - Password: Password for the file.
- Export Description: Information about the file.
- Output File: Name of the file.
- Click Confirm.A message
Export operation has been completed successfullyappears. The created configuration is saved to your system.
Exporting Configuration to Cluster
You can export your appliance configuration to the trusted appliances cluster, which your appliance belongs to. The procedure of creating the backup is almost the same as exporting to a file.
You need to define what configurations to export, and which nodes in the cluster receive the configuration. You do not need to import the files as is required when backing up the selected configuration. The configuration will be automatically replicated on the selected nodes when you export the configuration to the cluster.
When you are exporting data from one ESA to other, ensure that you run separate tasks to export the LDAP settings first and then the OS settings.
When exporting configurations to cluster nodes (from primary ESA to secondary ESAs), ensure to not select the following options in the Data To Export section:
- SSH Settings
- Certificates
- Management and WebService Certificates
- Import All Policy-Management Configs, Keys, Certs, Data but without Key Store files for Trusted Appliance Cluster
Important: Scheduled tasks are not replicated as part of cluster export.
For information about copying Insight certificates across systems, refer to Rotating Insight certificates.
Perform the following steps to export a configuration to a trusted appliances cluster.
Log in to the primary ESA using the admin credentials.
Navigate to System > Backup & Restore > Export.
In the Export Type area, select the To Cluster radio button.
In the Data to Export, select the items that you want to export from your machine and import to the cluster nodes.
Click Next.
In the Source Cluster Nodes, select the nodes that will run this task.
Specify the nodes by label or select individual nodes.
Click Next.
In the Target Cluster Nodes, select the nodes where the configuration needs to be exported. Specify them by label or select individual nodes. Select to show command line, if necessary.
Click Review.
The New Task screen appears.
Enter the required information in the following sections.
- Basic Properties
- Frequencies
- Restriction
- Logging
Click Save.
A dialog box to enter the root password appears.
Enter the root password and click OK.
The scheduled task is created.
Navigate to System > Task Scheduler.
Select the created task and click Run Now! to run the scheduled task immediately.
A confirmation dialog box appears. Click Ok.
The configurations are exported to the selected cluster nodes.
4.5.3.4.3 - Backing up custom files
In the ESA, you can export or import the files that cannot be exported using the cluster export task. The custom set of files include configuration files, library files, directories containing files, and any other files. On the ESA Web UI, navigate to Settings > System > Files to view the customer.custom file. That file contains the list of files to include for export and import.
The following figure displays a sample snippet of the customer.custom file.
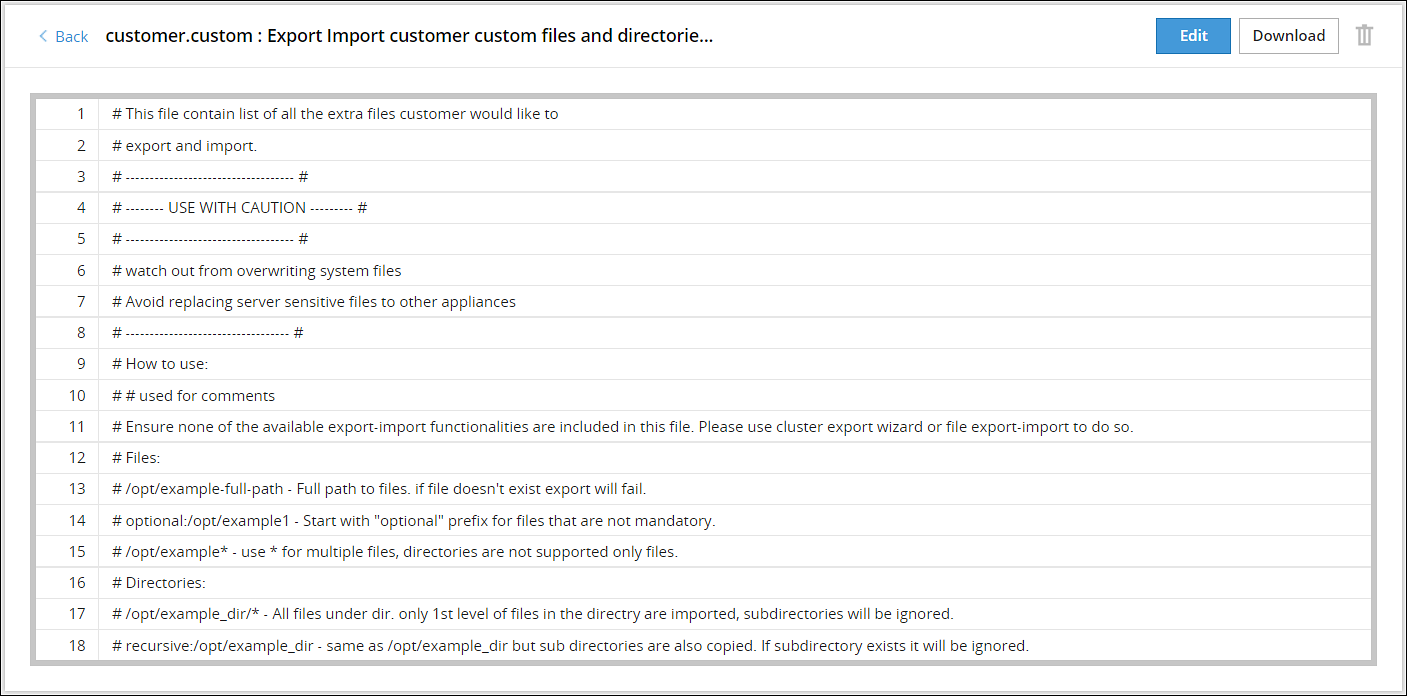
If you include a file, then you must specify the full path of the file. The following snippet explains the format for exporting a file.
/<directory path>/<filename>.<extension>
For example, to export the abc.txt file that is present in the test directory, you must add the following line in the customer.custom file.
/test/abc.txt
If the file does not exist, then an error message appears and the import export process terminates. In this case, you can add the prefix optional to the file path in the customer.custom file. This ensures that if the file does not exist, then the import export process continues without terminating abruptly.
If the file exists and the prefix optional is added, then the file is exported to the other node.For example, if the file 123.txt is present in the test directory, then it is exported to the other node. If the file does not exist, then the export of this file is skipped and the other files are exported.optional:/abc/test/123.txt
For more information about exporting files, refer Editing the customer.custom File.
If you include a directory, then you must specify the full path for the directory. All the files present within the directory are exported. The following snippet explains the format for exporting all the files in a directory.
/<directory path>/*
For example, to export a directory test_dir that is present in the /opt directory, add the following line in the customer.custom file.
/opt/test_dir/*
You can also include all the files present under the subdirectories for export. If you prefix the directory path with the value recursive, then all the files within the subdirectories are also exported.
For example, to export all the subdirectories present in the test_dir directory, add the following line in the customer.custom file.
recursive:/opt/test_dir/
For more information about exporting directories, refer to the section Editing the customer.custom File to Include Directories.
You must export the custom files before importing them to a file or on the other nodes on a cluster.
4.5.3.4.4 - Exporting the custom files
Perform the following steps to export the customer.custom file to a local file or to a cluster.
Exporting the customer.custom file to a local file
- Navigate to System > Backup & Restore > Export.
- In the Export Type area, select To File.
- In the Data To Export area, select Appliance OS Configuration.
- Click Export.The Output file screen appears.
- Enter the name of the file in the Export Name text box.
- Enter the required password in the Password text box.
- Click Confirm.The message Export operation has been completed successfully appears.
- Click the Done button.The file is exported and is stored in the
/products/exportsdirectory.
- On the CLI Manager, navigate to Administration > Backup/Restore Center > Export data/configurations to a local file.
- Select Appliance OS Configuration and select OK.A screen to enter the export information appears.
- Enter the required name of the file in the Export Name text box.
- Enter the required password in the Password and Confirm text boxes.
- Select OK.
- Select Done after the export operation completes.
Exporting the customer.custom file on a cluster
On the Web UI, navigate to System > Backup & Restore > Export.
In the Export Type area, select Cluster Export option.
If the configurations must be exported to a different ESA, then clear the Certificates check box. For information about copying Insight certificates across systems, refer to Rotating Insight certificates.
Click Start Wizard.
Select User custom list of files in the Data To Import tab.
Click Next.
Select the required options in the Source Cluster Nodes tab and click Next.
Select the required options in the Target Cluster Nodes tab and click Review.
Enter the required data in the Basic Properties, Frequency, Logging, and Restriction areas.For more information about the task details, refer Schedule Appliance Tasks. The message Export operation has been completed successfully appears.
Click Save.A File saved message appears.
- On the CLI Manager, navigate to Administration > Backup/Restore Center > Export data/configurations to remote appliance(s).
- Select the required file or configuration to export and select OK.
- Enter the required password for the file or configuration.
- Select Custom Files and folders and select OK.
- Enter the required credentials for the target appliance on the Target Appliance(s) screen.
- Select OK.The custom files and configurations are exported to the target node.
- Click Save.
4.5.3.4.5 - Importing the custom files
Perform the following steps to import the customer.custom file to a local file.
Importing the customer.custom file to a local file
- On the Web UI, navigate to System > Backup & Restore > Import.
- From the dropdown menu, select the exported file.
- Click Import.
- On the following screen, select Custom Files and folders.
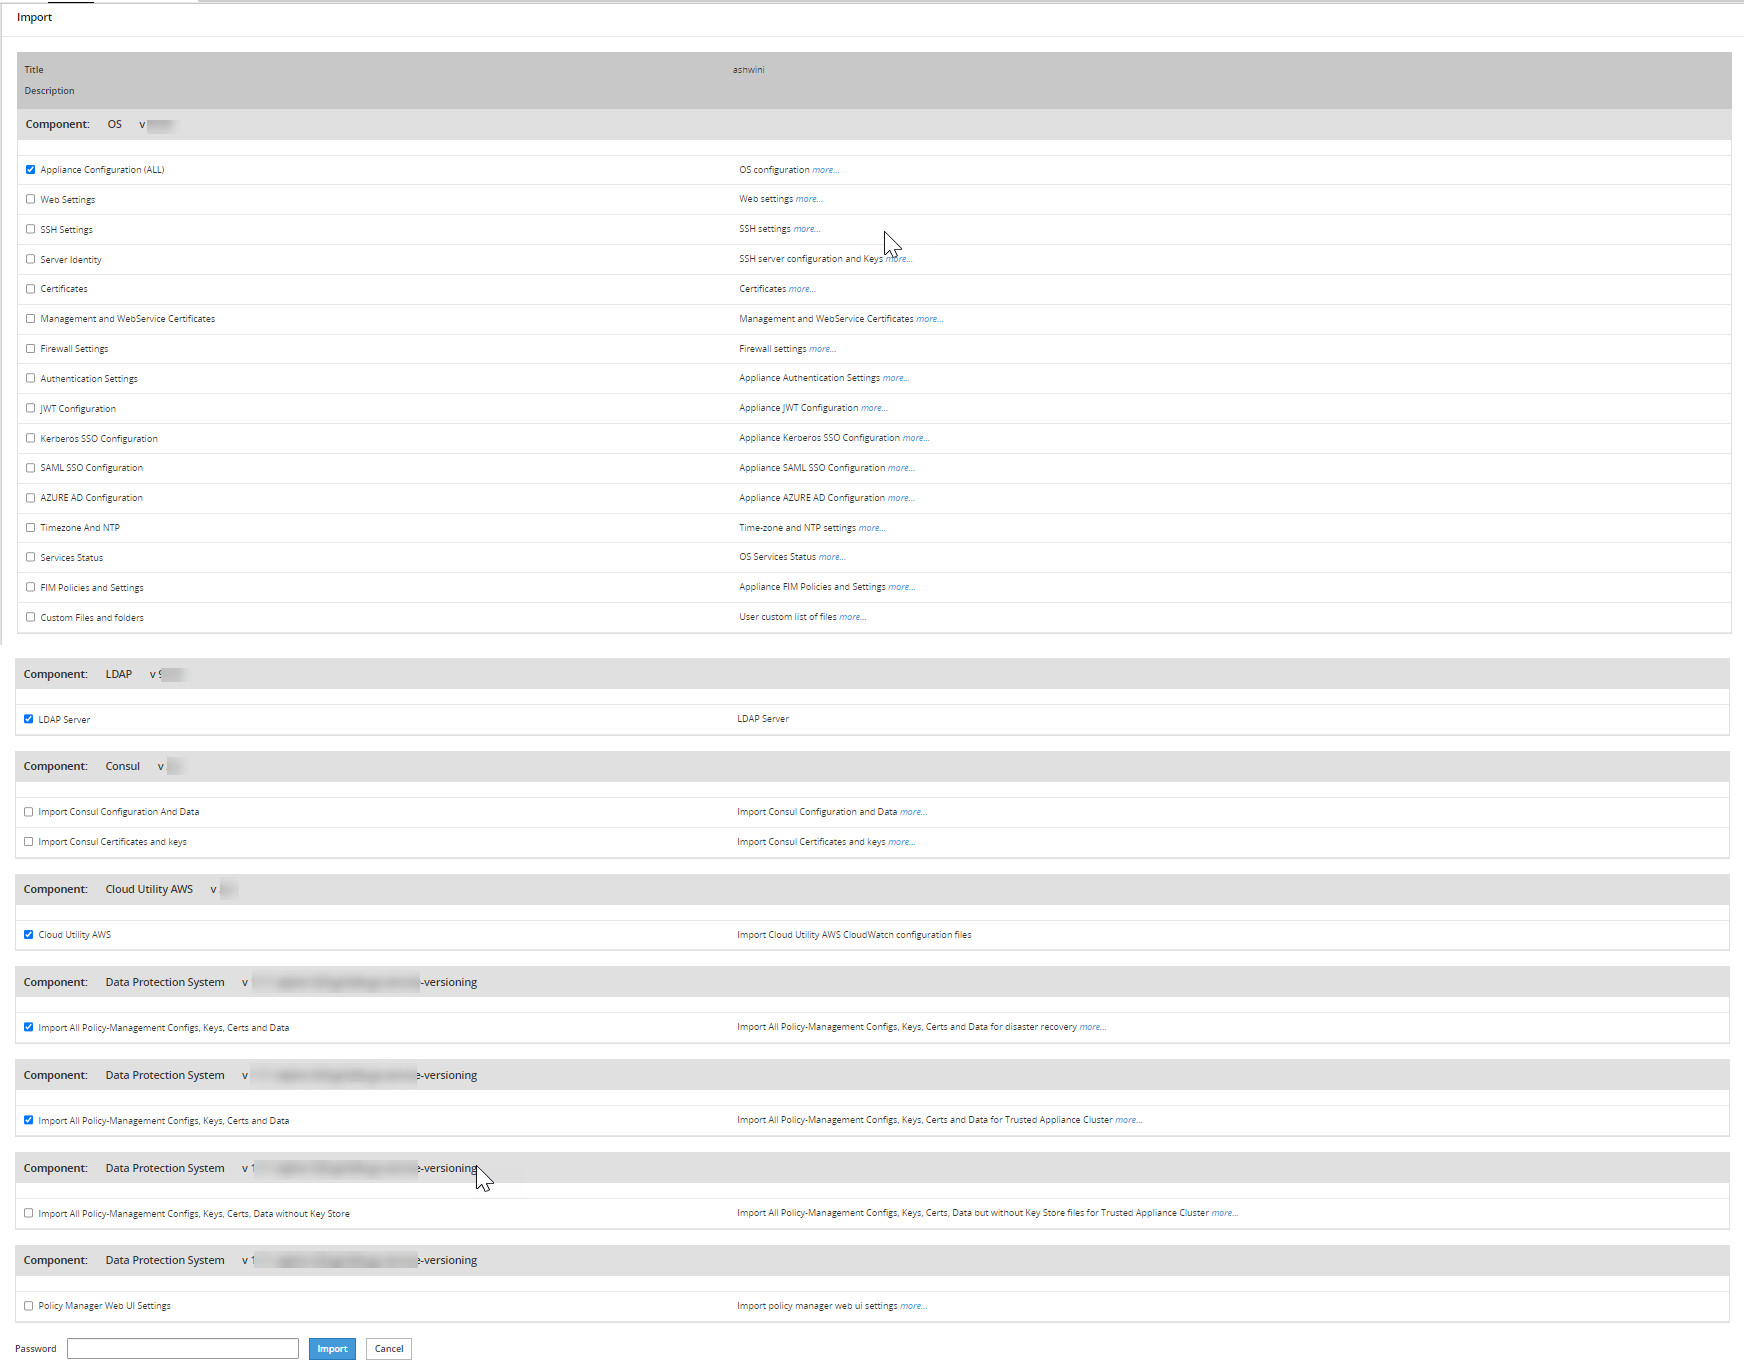
- Enter the password for the file in the Password text box and click Import.
The message File
has been imported successfully appears. - Click Done.
- On the CLI Manager, navigate to Administration > Backup/Restore Center > Import configurations from a local file.The Select an item to import screen appears.
- Select the required file or configuration to export and select OK.The contents of the file appear.
- Select OK.
- Enter the required password on the following screen and select OK.
- Select the required components.
Warning: Ensure to select each component individually.
- Select OK.The file import process starts.
- Select Done after the import process completes.
4.5.3.4.6 - Working with the custom files
Editing the customer.custom file
Administration privileges are required for editing the customer.custom file.
This section describes the various options that are applicable when you export a file.
Consider the following scenarios for exporting a file:
- Include a file abc.txt present in the /opt/test directory.
- Include all the file extensions that start with abc in the /opt/test/check directory.
- Include multiple files using regular expressions.
To edit the customer.custom file from the Web UI:
- On the Web UI, navigate to Settings > System > Files.
- Click Edit beside the customer.custom file.
- Configure the following settings to export the file.
#To include the abc.txt file /opt/test/abc.text #If the file does not exist, skip the export of the file optional:/opt/test/pqr.txt #To include all text files /opt/test/*.txt #To include all the files extensions for file abc present in the /opt/test/check directory /opt/test/check/abc.* #To include files file1.txt, file2.txt, file3.txt, file4.txt, and file5.txt /opt/test/file[1-5].txt - Click Save.
It is recommended to use the Cluster export task to export Appliance Configuration settings, SSH settings, Firewall settings, LDAP settings, and HA settings. Do not import Insight certificates using Certificates, rotate the Insight certificates using the steps from Rotating Insight certificates.If the files exist at the target location, then they are overwritten.
Editing the customer.custom File to Include Directories
This section describes the various options that are applicable when you export a file.
Consider the following scenarios for exporting files in a directory:
- Export files is the directory abc_dir present in the /opt/test directory
- Export all the files present in subdirectories under the abc_dir directory
Ensure that the files mentioned in the customer.custom file are not specified in the exclude file.For more information about the exclude file, refer to the section Editing the Exclude File.
To edit the customer.custom file from the Web UI:
On the Web UI, navigate to Settings > System > Files.
Click Edit beside to the customer.custom file.The following is a snippet listing the sample settings for exporting a directory.
#To include all the files present in the abc directory
/opt/test/abc_dir/*
#To include all the files in the subdirectories present in the abc_dir directory
recursive:/opt/test/abc_dir
If you have a Key Store configured with ESA, then you can export the Key Store libraries and files using the customer.custom file. The following is a sample snippet listing the settings for exporting a Key Store directory.
#To include all the files present in the Safeguard directory
/opt/safeguard/*
#To include all the files present in the Safenet directory
/usr/safenet/*
The following is a sample snippet listing the settings for exporting the self-signed certificates.
#To include all the files present in the Certificates directory
/etc/ksa/certificates
Click Save.
Editing the customer.custom File to include files
The library files and other settings that are not exported using the cluster export task can be addressed using the customer.custom file.
Ensure that the files mentioned in the customer.custom file are not specified in the exclude file.For more information about the exclude file, refer to the section Editing the Exclude File.
To edit the customer.custom file from the Web UI:
On the Web UI, navigate to Settings > System > Files.
Click Edit beside to the customer.custom file.If you have a Key Store configured with ESA, then you can export the Key Store libraries and files using the customer.custom file. The following is a sample snippet listing the settings for exporting a Key Store directory.
#To include all the files present in the Safeguard directory
/opt/safeguard/*
#To include all the files present in the Safenet directory
/usr/safenet/*
The following is a sample snippet listing the settings for exporting the self-signed certificates.
#To include all the files present in the Certificates directory
/etc/ksa/certificates
Click Save.
Editing the exclude files
The exclude file contains the list of system files and directories that you don’t want to export. You can access the exclude file from the CLI Manager only. The exclude file is present in the /opt/ExportImport/filelist directory.
- A user which has root privileges is required to edit the exclude file, as it lists the system directories that you cannot import.
- If a file or directory is present in both the exclude file and the customer.custom file, then the file or directory is not exported.
The following directories are in the exclude file:
- /etc
- /usr
- /sys
- /proc
- /dev
- /run
- /srv
- /boot
- /mnt
- /OS_bak
- /opt_bak
The list of files mentioned in the exclude file affect only the customer.custom file and not the standard cluster export tasks.
If you want to export or import files, then ensure that these files are not listed in the exclude file.
To edit the exclude file:
- On the CLI Manager, navigate to Administration > OS Console.
- Navigate to the
/opt/ExportImport/filelist/directory. - Edit the exclude file using an editor.
- Perform the required changes.
- Save the changes.
4.5.3.4.7 - Restoring configurations
Using the Import tab, you can restore the created backups of the product configurations and appliance OS core configuration. Using the Import tab, you also can upload a configuration file saved on your local machine to the appliance. You can also download a configuration file from the appliance and save it to your local machine.
Using the Import tab, you also can:
- Upload a configuration file saved on your local machine to the appliance.
- Download a configuration file from the appliance and save it to your local machine.
Before importing
Before importing the configuration files, ensure that the required products are installed in the appliance. For example, if you are importing files related to Consul Configuration and Data, ensure that the Consul product is installed in the appliance.
When you import files or configurations on an appliance from another appliance, different settings such as, firewall, SSH, or OS are imported. During this import, the settings on the target appliance might change. This might cause a product or component on the target appliance to stop functioning. Thus, after an import of the file or settings is completed, ensure that the settings, such as, ports, SSH, and firewall on the target machine are compatible with the latest features and components.For example, new features, such as, Consul are added to v7.1 MR2. When you import the settings from the previous versions, the settings in v7.1 MR2, such as, firewall or ports are overridden. So, you must ensure that the rules are added for the functioning of the new features.
When you import files or configurations, ensure that each component is selected individually.
Restoring configuration from backup
To restore a configuration from backup:
Navigate to the System > Backup & Restore.
Navigate to the Import tab, select a saved configuration from the list and click Import.
Choose specific components from the exported configuration if you do not want to restore the whole package.
If the configurations must be imported on a different ESA, then clear the Certificates check box. If you import the ESA Management and WebService Certificates from a different node in the cluster, then rotate the Insight certificates after the import is complete. For rotating the Insight certificates, use the steps from Rotating Insight certificates.
In the Password field, enter the password for the exported file and click Import.
4.5.3.4.8 - Viewing Export/Import logs
When you export or import files using the Web UI, the operation log is saved automatically. These log files are displayed in Log Files tab. You can view, delete, or download the log files.
When you export or import files using the CLI Manager, the details of the files are logged.
4.5.3.5 - Scheduling appliance tasks
Navigating to System > Task Scheduler you can schedule appliance tasks to run automatically. You can create or manage tasks from the ESA Web UI.
4.5.3.5.1 - Viewing the scheduler page
The following figure illustrates the default scheduled tasks that are available after you install the appliance.

The Scheduler page displays the list of available tasks.
To edit a task, click Edit. Click Save and then click Apply and enter the root password after performing the required changes.
To delete a task, select the required task and click Remove. Then, click Apply and enter the root password to remove the task.
On the ESA Web UI, navigate to Audit Store > Dashboard > Discover screen to view the logs of a scheduled task.
For creating a scheduled task, the following parameters are required.
- Basic properties
- Customizing frequency
- Execution
- Restrictions
- Logging
The following tasks must be enabled on any one ESA in the Audit Store cluster. Enabling the tasks on multiple nodes will result in a loss of data. If these scheduler task jobs are enabled on an ESA that was removed, then enable these tasks on another ESA in the Audit Store cluster.
- Update Policy Status Dashboard
- Update Protector Status Dashboard
Basic properties
In the Basic Properties section, you must specify the basic and mandatory attributes of the new task. The following table lists the basic attributes that you need to specify.
| Attribute | Description |
|---|---|
| Name | A unique numeric identifier must be assigned. |
| Description | The task displayed name, which should also be unique. |
| Frequency | You can specify the frequency of the task: |
Customizing frequency
In the Frequency section of the new scheduled task, you can customize the frequency of the task execution. The following table lists the frequency parameters which you can additionally define.
| Attribute | Description | Notes |
|---|---|---|
| Minutes | Defines the minutes when the task will be executed: | Every minute is the default. You can select several options, or clear the selection. For example, you can select to execute the task on the first, second, and 9th minute of the hour. |
| Days | Defines the day of the month when the task will be executed | Every day is the default. You can select several options, or clear the selection. |
| Days of the week | Defines the day of the week when the task will be executed: | Every DOW (day of week) is the default. You can select several options, or clear the selection. |
| Hours | Defines the hour when the task will be executed | Every hour is the default. You can select several options, or clear the selection. If you select *, then the task will be executed each hour.If you select */6, then the task will be executed every six hours at 0, 6, 12, and 18. |
| Month | Defines the month when the task will be executed | Every month is the default. You can select several options, or clear the selection. If you select *, then the task will be executed each month. |
The Description field of Frequency section will be automatically populated with the frequency details that you specified in the fields mentioned in the following table. Task Next Run will hint when the task next run will occur.
Execution
In the Command Line section, you need to specify the command which will be executed, and the user who will execute this command. You can optionally specify the command parameters separately.
Command LineIn the Command Line edit field, specify a command that will be executed. Each command can include the following items:
- The task script/executable command.
- User name to execute the task is optional.
- Parameters to the script as part of the command is optional, can be specified separately in the Parameters section.
ParametersUsing the Parameters section, you can specify the command parameters separately.
You can add as many parameters as you need using the Add Param button, and remove the unnecessary ones by clicking the Remove button.
For each new parameter you need to enter Name (any), Type (option), and Text (any).
Each parameter can be of text (default) and system type. If you specify system, then the parameter will be actually a script that will be executed, and its output will be given as the parameter.
UsernameIn the Username edit field, specify the user who owns the task. If not specified, then tasks run as root.
Only root, local_admin, and ptycluster users are applicable.
Restrictions
In a Trusted Appliance cluster, Restrictions allow you to choose the sites on which the scheduled tasks will be executed. The following table lists the restrictions that you can select.
| Attribute | Description |
|---|---|
| On master site | The scheduled tasks are executed on the Master site |
| On non-master site | The scheduled tasks are executed on the non-Master site |
If you select both the options, On master site and On non-master site, then the scheduled task is executed on both sites.
Logging
In the Logging section, you should specify the logging details explained in the table below:
| Logging Detail | Description | Notes |
|---|---|---|
| Show command line in logs? | Select a check-box to show the command line in the logs. | It is advisable not to select this option if the command includes sensitive data, such as passwords. |
| SysLogLog Server | Define the following details: | You should configure these fields to be able to easily analyze the incoming logs. Specifies whether to send an event to the Log Server (ESA) and the severity: No event, Lowest, Low, Medium, High, Critical for failed/success task execution. |
| Log File | Specify the files names where the success and failed operations are logged. | Specifies whether to store the task execution details in local log files. You can specify to use the same file for successful and failed events. These files will be located in /var/log. You can also examine the success and failed logs in the Appliance Logs, in the appliance Web Interface. |
4.5.3.5.2 - Creating a scheduled task
Perform the following steps to create a scheduled task.
- On the ESA Web UI, navigate to System > Task Scheduler.
- Click New Task. The New Task screen appears.
- Enter the required information in the Basic Properties section.For more information about the basic properties, refer here.
- Enter the required information in the Frequencies section.For more information about customizing frequencies, refer here.
- Enter the required information in the Command Line section.For more information about executing command line, refer here.
- Enter the required information in the Restrictions section.For more information about restrictions, refer here.
- Enter the required information in the Logging section.For more information about logging, refer here.
- Click Save.A new scheduled task is created.
- Click Apply to apply the modifications to the task.A dialog box to enter the root user password appears.
- Enter the root password and click OK.The scheduled task is now operational.
Running the task
After completing the steps, select the required task and click Run Now to run the scheduled task immediately.
Additionally, you can create a scheduled task, for exporting a configuration to a trusted appliances cluster using System > Backup/Restore > Export.
4.5.3.5.3 - Scheduling Configuration Export to Cluster Tasks
You can schedule configuration export tasks to periodically replicate a specified configuration on the necessary cluster nodes.
The procedure of creating a configuration export task is almost the same as exporting a configuration to the cluster. The is a slight difference between these processes. In exporting a configuration to the cluster, it is a one-time procedure which the user needs to run manually. A scheduled task makes periodic updates and can be run a number of times in accordance with the schedule that the user specifies.
To schedule a configuration export to a trusted appliances cluster:
From the ESA Web UI, navigate to System > Backup & Restore > Export.
Under Export, select the Cluster Export radio button.
If the configurations must be exported on a different ESA, then clear the Certificates check box during the export. For information about copying Insight certificates across systems, refer to Rotating Insight certificates.
Click Start Wizard.
The Wizard - Export Cluster screen appears.
In the Data to import, customize the items that you need to export from this machine and imported to the cluster nodes.
Click Next.
In the Source Cluster Nodes, select the nodes that will run this task.
You can specify them by label or select individual nodes.
Click Next.
In the Target Cluster Nodes, select the nodes to import the data.
Click Review.
The New Task screen appears.
Enter the required information in the following sections.
- Basic Properties
- Frequencies
- Command Line
- Restriction
- Logging
Click Save.
A new scheduled task is created.Click Apply to apply the modifications to the task.
A dialog box to enter the root user password appears.Enter the root password and click OK.
The scheduled task is operational.Click Run Now to run the scheduled task immediately.
4.5.3.5.4 - Deleting a scheduled task
Perform the following steps to delete a scheduled task:
- From the ESA Web UI, navigate to System > Task Scheduler.The Task Scheduler page displays the list of available tasks.
- Select the required task.
- Click Remove.A confirmation message to remove the scheduled task appears.
- Click OK.
- Click Apply to save the changes.
- Enter the root password and select Ok.The task is deleted successfully.
4.5.4 - Viewing the logs
Based on the products installed, you can view the logs in the Logs screen. Based on the components installed in ESA, the following are the logs are generated in the following screens:
- Web Services Engine
- Service Dispatcher
- Appliance Logs
The information icon on the screen displays the order in which the new logs appear. If the new logs appear on top, you can scroll down through the screen the view the previously generated logs.
Viewing Web Services Engine Logs
In the Web Services screen, you can view the logs for all the Web services requests on ports, such as, 443 or 8443.
The Web Services logs are classified as follows:
- HTTP Server Logs
- SOAP Module Logs
The following figure illustrates the HTTP Server Logs.

Navigate to Logs > Web Services Engine > Web Services HTTP Server Logs to view the HTTP Server logs.
Viewing Service Dispatcher Logs
You can view the logs for the Service Dispatcher under Logs > Service Dispatcher > Service Dispatcher Logs.
The following figure illustrates the service dispatcher logs.

Viewing Appliance Logs
You can view logs of the events occurring in the appliance under Logs > Appliance. The Appliance Logs page lists logs for each event and provides options for managing the logs. The logs files (.log extension) that are in the /var/log directory appear on the appliance logs screen. The logs can be categorized as all appliance component logs, installation logs, patch logs, kernel logs, and so on.
Current Event Logs are the most informative appliance logs and are displayed by default when you proceed to the Appliance Logs page. Depending on the logging level configuration (set in the appropriate configuration files of the appliance components), the Current Event Logs display the events in accordance with the selected level of severity (No logging, SEVERE, WARNING, INFO, CONFIG, ALL).
Based on the configuration set for the logs, they are rotated periodically.
The following figures illustrate the appliance logs.

The following table describes the actions you can perform on the appliance logs.
| Action | Description |
|---|---|
| Print the logs | |
| Download | Download the logs to a specific directory |
| Refresh | Refresh the logs |
| Save a copy | Save a copy of the current log with a timestamp |
| Purge Log | Clear the logs |
If the logs are rotated, the following message appears.Logs have been rotated. Do you want to continue with new logs?
Select OK to view the new logs generated.
For more information about configuring log rotation and log retention, refer here.
4.5.5 - Working with Settings
The Settings menu on the ESA Web UI allows you to configure various features, such as, antivirus, two-factor authentication, networking, file management, user management, and licences.
4.5.5.1 - Working with Antivirus
The Antivirus program uses ClamAV, an open source and cross-platform Antivirus engine designed to detect malicious Trojan, virus, and malware threats. A single file or directory, or the whole system can be scanned. Infected file or files are logged and can be deleted or moved to a different location, as required.
You can use Antivirus to perform the following functions:
- Schedule the scans or run these on demand.
- Update the virus data signature or database files, or run the update on demand.
- View the logs generated for every virus found.
Simple user interfaces and standard configurations for both Web UI and CLI of the Appliance make viewing logs, running scans, or updating the virus signature file easy.
FIPS mode and Antivirus
If the FIPS mode is enabled, then the Antivirus is disabled on the appliance.

For more information on the FIPS Mode, refer here.
4.5.5.1.1 - Customizing Antivirus Scan Options
In the Antivirus section, you can customize the scan by setting the following options:
- Action: Ignore the scan result, move the file to a separate directory, or delete the infected files
- Recursive: Implement and scan directories, sub-directories, and files
- Scan Directory: Specify the directory
To customize Antivirus scan options:
Navigate to Settings > Security > Antivirus.
Click Options.
Choose the required options and click Apply.A message
Option changes are accepted!appears.
4.5.5.1.2 - Scheduling Antivirus Scan
An Antivirus scan can be scheduled only from the Web UI.
Navigate to System > Task Scheduler.
Search Anti-Virus system scan.If it is present, then scanning is already scheduled.Verify the Frequency and update if required.
If Antivirus system scan is not present, then follow these steps:
a. Click +New Task.
b. Add the details, such as the Name, Description, and Frequency.
c. Add the command line steps, and Logging details.
Click Save at the top right of the window.
The Antivirus scanning automatically begins at the scheduled time and logs are saved.
4.5.5.1.3 - Updating the Antivirus Database
You must update the Antivirus database or the signature files frequently. This ensures the Antivirus is updated so it can pick up any new threats to the appliance. The Antivirus database can either be updated from the official ClamAV website, local websites, mirrors, or using the signature files. The signature files are downloaded from the website and uploaded on the ESA Web UI. The following are the Antivirus signature database files that must be downloaded:
- main.cvd
- daily.cvd
- bytecode.cvd
The Antivirus signature database files can be updated in one of the following two ways:
- SSH/HTTP/HTTPS/FTP
- Official website/mirror/local sites
It is recommended that you update the signature database files directly from the official website.
Updating the Antivirus Database Manually
Perform the following steps to update the Antivirus database.
On the ESA Web UI, navigate to Settings > Security > Antivirus.
Click Database Update > Settings.
Select one of the following settings.
| Settings | Description |
|---|---|
| Local/remote mirror server | Server containing the database update. Enter the URL of the server in Input the target URL text box. |
| Official website through HTTP proxy server | Proxy server of ClamAV containing the database update. Enter the following information: |
| Local directory | Local directory where the updated database signature files, such as, main.cvd, daily.cvd and bytecode.cvd are stored. Enter the directory path in Input the target directory text box. |
| Remote host | Host containing the updated database signature files. Connect to this host using an SSH, HTTP, HTTPS, or FTP connection. Enter information in the required fields to establish a connection with the remote host. |
- Select Confirm.The database update is initiated.
Updating the Antivirus Signature Files Manually
In case network is not available or the Internet is disconnected, you can manually update the signature database files. The signature files are downloaded from the website and placed in a local directory. The following are the Antivirus signature database files that must be downloaded:
- main.cvd
- daily.cvd
- bytecode.cvd
It is recommended that you update the signature database files directly from the official website.
Perform the following steps to manually update the Antivirus database signature files.
Download the Antivirus signature database files: main.cvd, daily.cvd, and bytecode.cvd.
On the CLI Manager, navigate to Administration > OS Console.
Create the following directory in the appliance:
/home/admin/clam_update/Save the downloaded signature database files in the /home/admin/clam_update/ directory.
Scheduling Update of Antivirus Signature Files
Scheduling an update option is available only on the Web UI.
Go to System > Task Scheduler.
Select the Anti-Virus database update row.
Click Edit from the Scheduler task bar.For more information about scheduling appliance tasks, refer here.
Click Save at the top right corner of the workspace window.
4.5.5.1.4 - Working with Antivirus Logs
Log files are generated for all system and database activities. These logs are stored in the local log
file, runtime.log which is saved in the /etc/opt/Antivirus/ directory.
You can view and delete the local log files.
Viewing Antivirus Logs
The logs for the Antivirus can be viewed from the ESA Web UI. The logs consist of Antivirus database updates, scan results, infections found, and so on. These logs are also available on the Audit Store > Dashboard > Discover screen. You can view all logs, including those deleted, in the local file.
Perform the following steps to view logs.
- Navigate to Settings > Security > Antivirus.
- Click Log.
Deleting Logs from Local File Using the Web UI
Perform the following steps to delete logs from local file using the Web UI.
- Navigate to Settings > Security > Antivirus.
- Click Log.
- Click Purge.All existing logs in the local log file are deleted.
Viewing Logs from the CLI Manager
Perform the following steps to delete logs from local file using the CLI Manager.
- Navigate to Status and Logs > Appliance Logs.
- Select System event logs.
- Press View.
- From the list of available installed patches, select patches.
- Press Show.A detailed list of patch related logs are displayed on the ESA Server window.
Configuring Log Rotation and Log Retention
Perform the following steps to configure log rotation and log retention.
Append the following configuration to the /etc/logrotate.conf file:
/var/log/clamav/*.log
{ missingok monthly size 10M rotate 1 }
For periodic log rotation, run the following command:
cd /etc/opt/Antivirus/
mv /etc/opt/Antivirus/runtime.log /var/log/clamav
ln -s /var/log/clamav/runtime.log runtime.log
4.5.5.2 - Configuring Appliance Two Factor Authentication
Two factor authentication is a verification process where two recognized factors are used to identify you before granting you access to a system or website. In addition to your password, you must correctly enter a different numeric one-time passcode or the verification code to finish the login process. This provides an extra layer of security to the traditional authentication method.
In order to provide this functionality, a trust is created between the appliance and the mobile device being used for authentication. The trust is simply a shared-secret or a graphic barcode that is generated by the system and is presented to the user upon first login.
There is an advantage of using the two-factor authentication feature. If a hacker manages to guess your password, then entry to your system is not possible. This is because a device is required to generate the verification code.
The verification code is a dynamic code that is generated by any smart device such as smartphone or tablet. The user enters the shared-secret or scans the barcode into the smart device, and from that moment onwards the smartphone generates a new verification-code every 30-60 seconds. The user is required to enter this verification code every time as part of the login process. For validating the one time password (OTP), ensure that the date and time on the ESA and your system are in sync.
Protegrity appliances and authenticators
There are a few requirements for using two factor authentication with Protegrity appliances.
- For validating one time passwords (OTP), the date and time on the ESA and the validating device must be in sync.
- Protegrity appliances only support use of the Google, Microsoft, or Radius Authenticator apps.
- Download the appropriate app on a mobile device, or any other TOTP-compatable device or application.
The Security Officer configures the Appliance Two Factor Authentication by any one of the following three methods:
Automatic per-user shared-secret is the default and recommended method. It allows having a separate shared-secret for each user, which is generated by the system for them. The shared-secret will be presented to the user upon the first login.
Radius Authentication is the authentication using the RADIUS protocol.
Host-based shared-secret allows a common shared-secret for all users, which can be specified and distributed to the users by the Security Officer. Host-based shared-secret method is useful to force the same secret code for multiple appliances in clustered environments.
4.5.5.2.1 - Working with Automatic Per-User Shared-Secret
Automatic per-user shared-secret is the default and recommended method for configuring two factor authentication. It allows having a separate shared-secret for each user, which is generated by the system for them. The shared-secret will be presented to the user upon the first login.
Configuring Two Factor Authentication with Automatic Per-User Shared-Secret
The following section describes how to configure two factor authentication using automatic per-user shared-secret.
Perform the following steps to configure two factor authentication with automatic per-user shared-secret.
From the ESA Web UI, navigate to Settings > Security > Two Factor Authentication.
Check the Enable Two-Factor-Authentication check box.
Select the Automatic per-user shared-secret option.
The following pane appears with the options to enable this authentication mode.

If required, then you can customize the message that will be presented to users upon their first login.
Check the Advanced Settings check box to display the Console Message button. By clicking Console Message, a new window appears where you can review and modify the message that will be presented to the user.

You can apply the following logging-settings in order to specify what to log:
- Log failed log-in attempts
- Log any successful log-ins
- Log only first-successful log-in
Click Apply to save the changes.
Logging in to the Web UI
Before beginning, be aware of time limits. When entering codes from the authenticator there is a time limit. Ensure codes are entered in the Enter Authentication code field within the displayed time limit.
The following section describes how to log in to the Web UI after configuring automatic per-user shared-secret.
Perform the following steps to login to the Web UI:
Navigate to the ESA Web UI login page.
In the Username and Password text boxes, enter the user credentials.
Click Sign in.The Two step authentication screen appears.

Scan the QR code using an authentication application.Alternatively, click the Can’t see QR code? link.A QR code gets generated and displayed below it as shown in the figure.

Enter the displayed code in the authentication app to generate One-time password.
In the Enter authentication code field box, enter the one-time password, and click Verify.
After the code is validated, the ESA home page appears.
4.5.5.2.2 - Working with Host-Based Shared-Secret
Host-based shared-secret allows a common shared-secret for all users, which can be specified and distributed to the users by the Security Officer. Host-based shared-secret method is useful to force the same secret code for multiple appliances in clustered environments.
Configuring Two Factor Authentication with Host-Based Shared-Secret
The following section describes how to configure two factor authentication using host-based shared-secret.
Perform the following steps to configure Two Factor Authentication with Host-based shared-secret.
- On the ESA Web UI, navigate to Settings > Security > Two Factor Authentication.
- Check the Enable Two-Factor-Authentication check box.
- Select Host-based shared-secret from Authentication Mode.
- Click Modify.The Host-based shared-secret key appears.
If required, click Generate to modify the Host-based shared-secret key. Ensure that you note the Host-based shared-secret key to generate TOTP. - You can apply the following logging-settings in order to specify what to log:
- Log failed log-in attempts
- Log any successful log-ins
- Click Apply to save the changes. A confirmation message appears.
Logging in to the Web UI
Before beginning, be aware of time limits. When entering codes from the authenticator there is a time limit. Ensure codes are entered in the authenticator code box within the displayed time limit
The following section describes how to log in to the Web UI after configuring host-based shared-secret.
To login to the Web UI:
Navigate to the ESA Web UI login page.
In the Username and Password text boxes, enter the user credentials.
Click Sign in.
The 2 step authentication screen appears.

Use the Host-Based Shared-Secret key obtained from the configuration process to generate authentication code.
Enter the Host-Based Shared-Secret key in the authentication app to generate authentication code.
In the authenticator code box, enter the authentication code, and click Verify.
After the code is validated, the ESA home page appears.
4.5.5.2.3 - Working with Remote Authentication Dial-up Service (RADIUS) Authentication
The Remote Authentication Dial-up Service (RADIUS) is a networking protocol for managing authentication, authorization, and accounting in a network. It defines a workflow for communication of information between the resources and services in a network. The RADIUS protocol uses the UDP transport layer for communication. The RADIUS protocol consists of two components, the RADIUS server and the RADIUS client. The server receives the authentication and authorization requests of users from the RADIUS clients. The communication between the RADIUS client and RADIUS server is authenticated using a shared secret key.
You can integrate the RADIUS protocol with an ESA for two-factor authentication. The following figure describes the implementation between ESA and the RADIUS server.

- The ESA is connected to the AD that contains user information.
- The ESA is a client to the RADIUS sever that contains the network and connection policies for the AD users. It also contains a RADIUS secret key to connect to the RADIUS server. The communication between the ESA and the RADIUS sever is through the Password Authentication Protocol (PAP).
- An OTP generator is configured with the RADIUS server. An OTP is generated for each user. Based on the secret key for each user, an OTP for the user is generated.
In ESA, the following two files are created as part of the RADIUS configuration:
- The dictionary file that contains the default list of attributes for the RADIUS server.
- The custom_attributes.json file that contains the customized list of attributes that you can provide to the RADIUS server.
Important : When assigning a role to the user, ensure that the Can Create JWT Token permission is assigned to the role.If the Can Create JWT Token permission is unassigned to the role of the required user, then remote authentication fails.To verify the Can Create JWT Token permission, from the ESA Web UI navigate to Settings > Users > Roles.
Configuring Radius Two-Factor Authentication
To configure Radius two-factor authentication:
On the ESA Web UI, navigate to Settings > Security > Two Factor Authentication.
Check the Enable Two-Factor-Authentication checkbox.
Select the Radius Server option as shown in the following figure.
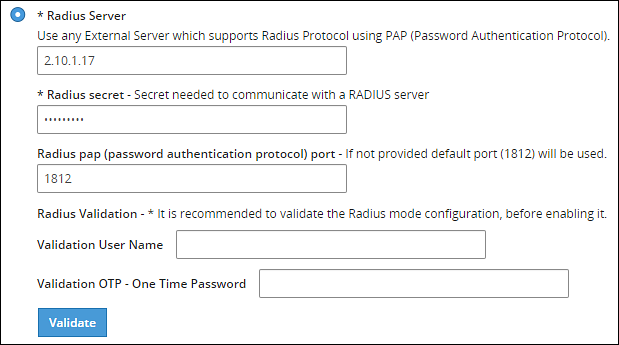
Type the IP address or the hostname of the RADIUS server in the Radius Server text box.
Type the secret key in the Radius Secret text box.
Type the port of the RADIUS server in the Radius port text box.Alternatively, the default port is 1812.
Type the username that connects to the RADIUS server in the Validation User Name text box.
Type the OTP code for the user in the Validation OTP text box.
Click Validate to validate the configuration.A message confirming the configuration appears.
Click Apply to apply the changes.
Logging in to the Web UI
Perform the following steps to login to the Web UI:
Open the ESA login page.
Type the user credentials in the Username and Password text boxes.
Click Sign-in.The following screen appears.
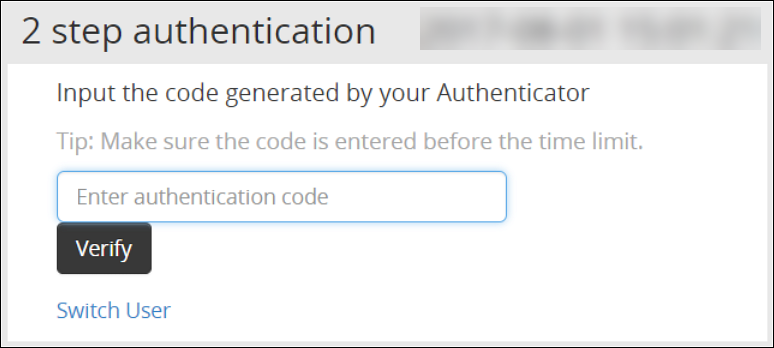
Type the OTP code and select Verify.After the OTP is validated, the ESA home page appears.
Editing the Radius Configuration Files
To edit the configuration files:
On the ESA Web UI, navigate to Settings > System.
Under OS-Radius Server tab, click Edit corresponding to the custom_attibutes.json or directory to edit the attributes.
If required, modify the attributes to the required values.
Click Save.The changes are saved.
Logging in to the CLI
Perform the following steps to login to CLI Manager:
Open the ESA CLI Manager.
Enter the user credentials.
Press ENTER .The following screen appears.
Type the verification code and select OK.After the code is validated, the main screen for the CLI Manager appears.
4.5.5.2.4 - Working with Shared-Secret Lifecycle
All users of appliance two factor authentication get a shared-secret for verification. This shared-secret for a user remains in the two factor authentication group list until it is manually deleted. Even if a user becomes ineligible to access the system, the username remains linked to the shared-secret.
This exception is valid for those users opting for per-user authentication.
If the same user or another user with the same name is again added to the system, then the user becomes eligible to use the already existing shared-secret.
To prevent this exception, ensure that an ineligible user is manually removed from the Two Factor Authentication group.
Revoking Shared-Secret for the User
The option to revoke shared-secret is useful when user needs to switch to another mobile device or the previous shared-secret cannot be retrieved from the earlier device.
Perform the following steps to revoke shared-secret for the user:
On the ESA Web UI, navigate to Settings > Security > Two Factor Authentication.
Ensure that the Enable Two-Factor-Authentication and Automatic per-user shared-secret checkbox are checked.
Inspect Users Shared Secrets area to identify user account to revoke.You can revoke users who have already logged in to the Appliance.
Click Revoke.
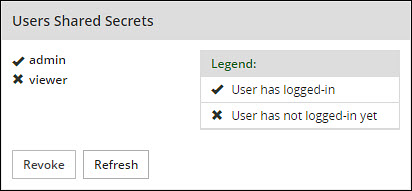
Select the user to discard by clicking the checkbox next to the username.
Click Apply to save the changes.A new shared-secret code will be created for the revoked user and is presented upon the next login.
4.5.5.2.5 - Logging in Using Appliance Two Factor Authentication
Perform the following steps to log in using Appliance Two Factor Authentication:
Navigate to ESA login page.
Enter your username.
Enter your password.
Click Sign in.After verification, a separate login dialog appears.

As a prerequisite, a new user must setup an account on Google Authenticator. Download the Google Authenticator app in your device and follow the instructions to create a new account.
Enter the shared-secret in your device.If the system is configured for per-user shared-secret, then this secret code is made available. If this is a web-session, then you are presented with a barcode and the applications that support it.
After you accept the shared-secret, the device displays a verification code.
Enter this verification code in the screen displayed in step 4.
Click Verify.
4.5.5.2.6 - Disabling Appliance Two Factor Authentication
Perform the following steps to disable Two Factor Authentication:
Using the ESA Web UI, navigate to Settings > Security > Two Factor Authentication.
Clear the Enable Two-Factor-Authentication checkbox.
Click Apply to save the changes.
Disable Two Factor through local console
You can also disable two-factor authentication from the local console.You need to switch to OS console and execute the following command.
# /etc/opt/2FA/2fa.sh -–disable
4.5.5.3 - Working with Configuration Files
The Product Files screen displays the configuration files of all the products that are installed in ESA. You can view, modify, delete, upload, or download the configuration files from this screen. In the ESA Web UI, navigate to Settings > System > Files to view the configuration files.
The following table describes the different products and their respective configuration files that are available in ESA.
| Product | Configuration Files | Description |
| OS – Radius Server | Dictionary | Contains the dictionary translations for analyzing requests and generating responses for RADIUS server. |
| custom_attributes.json | Contains the configuration settings of the header data for the RADIUS server. | |
| OS –Export/Import | Customer.custom | Lists the custom files that can be exported or
imported. For more information about exporting custom files, refer here. |
| Audit Store-SMTP Config Files | smtp_config.json | Contains the SMTP configuration settings for sending email alerts. |
| smtp_config.json.example | Contains SMTP configuration settings and example values for sending email alerts. This is a template file. | |
| Policy Management – Member Source Service User Files | exampleusers.txt | Lists the users that can be used in policy. For more
information about policy users, refer Policy Management. |
| Policy Management – Member Source Service Group Files | examplegroups.txt | Lists the user groups that can be used in policy. For
more information about policy user groups, refer Policy Management.
. |
| Settings → System → Files → Downloads - Other files | contractual.htm | Lists all the third-party software licenses that are
utilized in ESA.NoteYou cannot modify the file. |
| Distributed Filesystem File Protector – Configuration Files | dfscacherefresh.cfg | Contains the DFSFP configuration settings such as, logging,
SSL, Security, and so on. For more information about the
dfscacherefresh.cfg file, refer to the
Protegrity Big Data Protector Guide 9.2.0.0
.NoteStarting
from the Big Data Protector 7.2.0 release, the HDFS File Protector
(HDFSFP) is deprecated. The HDFSFP-related sections are retained
to ensure coverage for using an older version of Big Data
Protector with the ESA 7.2.0. |
| Cloud Gateway –Settings | gateway.json | Lists the log level settings for Data Security Gateway. For more information about the
gateway.json file, refer to the Protegrity Data Security Gateway User Guide
3.2.0.0. |
| alliance.conf | Configuration file to direct syslog events between servers over TCP or UDP. |
The following figure illustrates various actions that you can perform on the Product Files screen.
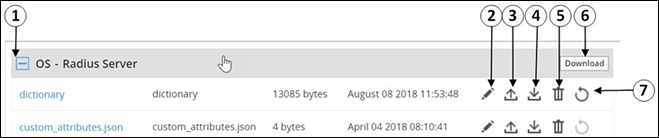
| Callout | Description | Action |
|---|---|---|
| 1 | Collapse/Expand | Collapse or expand to view the configuration files. |
| 2 | Edit | Edit the configuration file. |
| 3 | Upload | Upload a configuration file.Note: When you upload a file, it replaces the existing file in the system. |
| 4 | Download | Download the file to your local system. |
| 5 | Delete | Delete the file from the system. |
| 6 | Download | Download all the files of the product to your local system. |
| 7 | Reset | Reset the configuration to the previously saved settings. |
Viewing a Configuration File
You can view the contents of the configuration file from the Web UI. If the file size is greater than 5 MB, you must download the file to view the contents.
Perform the following steps to view a file:
Navigate to Settings > System > Files.The screen with the files appears.
Click on the required file. The contents of the file appear.
You can modify, download, or delete the file using the Edit, Download and Delete icon respectively.
Uploading a Configuration File
Configuration files can be uploaded using this option.For more information about the configuration files, refer Working with Configuration Files.
Perform the following steps to upload a file.
- Navigate to Settings > System > Files.The screen with the files appears.
- Click on the upload icon.The file browser icon appears.
- Select the configuration file and click Upload File.A confirmation message appears.
- Click Ok.A message confirming the upload appears.
Modifying a Configuration File
In addition to editing the file from the Files screen, you can also modify the content of the file from the view option. If you want to modify the content of a file whose size is greater than 5 MB, you must download the file to the local machine, modify the content, and then upload the file through the Web UI.
For instructions to download a configuration file, refer here.
Perform the following steps to modify a file.
- Navigate to Settings > System > Files.The screen with the files appears.
- Click on the required file.The contents of the file appear.
- Click the Edit to modify the file.
- Perform the required changes and click Save.A message confirming the changes appears.
Deleting a Configuration File
In addition to deleting the file from the Files screen, you can also delete the file from the view option. After you delete the file, an exclamation icon appears indicating that the file does not exist on the server. Using the reset functionality, you can restore the deleted file.
Perform the following steps to delete a file.
- Navigate to Settings > System > Files.The screen with the files appears.
- Click on the required file.The contents of the file appear.
- Click the Delete icon to modify the file.A message confirming the deletion appears.
- Select Yes.
Resetting a File
The Reset functionality is used to restore the changes that are done to your file. For every configuration file, the Reset icon is disabled. This icon is enabled when you perform any of the following changes:
- Modify the configuration file
- Delete the configuration file
When you modify or delete a file, the original file is backed up in the /etc/configuration-files-backup directory. For every modification, the file in the directory is overwritten. When you click the Reset icon, the file is retrieved from the directory and restored on the Files screen.
Perform the following steps to restore a file.
- Navigate to Settings > System > Files.The screen with the files appears.
- Click the Reset icon to restore a file.The file that is edited or deleted is restored.
Limits on resetting files
Only the changes that are performed on the files through the Web UI are backed up. Changes performed on the files through the CLI Manager are not backed up and cannot be restored.
4.5.5.4 - Working with File Integrity
The content modifications can be viewed by the Security Officer since the PCI specifications require that sensitive files and folders in the Appliance are monitored. This information contains password, certificate, and configuration files. The File Integrity Monitor makes a weekly check and all changes made to these files can be reviewed by authorized users.

To check file modifications at any given time, click Settings > Security > File Integrity > Check. The Security Officer views and accepts the changes, writing comments as necessary, in the comment box. Accepting changes means that the changes are removed from the viewable list. Changes cannot be rejected. You must not accept deletion of system files. These files must be available.
Only the last modification made to a file appears.
All the changes can also be viewed on the Audit Store > Dashboard > Discover screen. Another report shows all accepted changes. For more information about Discover, refer Discover.
Before applying a patch, it is recommended to check the files and accept the required changes under Settings > File Integrity > Check.
After installing the patches for appliances such as ESA or DSG, check the files and accept the required changes again under Settings > Security > File Integrity > Check.
4.5.5.5 - Managing File Uploads
You can upload a patch file of any size from the File Upload screen in the ESA Web UI. The files uploaded from the Web UI are available in the /opt/products_uploads directory.
After the file is uploaded, in the Uploaded Files section, select the file to view the file information, download it, or delete it.
To upload a file:
Navigate to Settings > System > File Upload.The File Upload page appears.
In the File Selection section, click Choose File.The file upload dialog box appears.
Select the required file and click Open.
- You can only upload files with .pty and .tgz extensions.
- If the file uploaded exceeds the Max File Upload Size, then a password prompt appears. Only a user with the administrative role can perform this action. Enter the password and click Ok.
- By default, the Max File Upload Size value is set to 25 MB. To increase this value, refer here.
Click Upload.The file is uploaded to the
/opt/products_uploadslocation.- If a file contains spaces in its name, then it will be automatically replaced with underline character (_).
- The files are scanned by the internal AntiVirus before they are uploaded in the ESA.
- If the FIPS mode is enabled, then the anti-virus scan is skipped during the file upload.
- The SHA512 checksum value is validated during the upload process.
- If the network is interrupted while uploading the file, then the ESA retries to upload the file.The retry upload process is attempted ten times. Each attempt lasts for ten seconds.
After the file is uploaded successfully, then from the Uploaded Files area, choose the uploaded patch.The information for the selected patch appears.
Verifying uploaded file integrity
To verify the integrity of the uploaded file, validate the checksum values displayed on the screen with the checksum values of the downloaded patch file.You can obtain the checksum values from the My.Protegrity or contact Protegrity Support.
4.5.5.6 - Configuring Date and Time
You can use the Date/Time tab to change the date and time settings. To update the date and time, navigate to Settings > System > Date/Time.
The Date and Time screen with the Update Time Periodically option enabled is shown in the following figure.

The date and time options are described in the following table.
| Setting | Details | How to configure/change |
|---|---|---|
| Update Time Periodically | Synchronize the time with the specified NTP Server, upon boot and once an hour. | You can enable this option using Enable button and disable it using Disable. Only enable or disable NTP settings from the CLI Manager or the Web UI. |
| Current Appliance Date/Time | Manually synchronize the time with the specified NTP Server. You can use NTP Server synchronization only if NTP service is running. | You can force and restart time synchronization using Reset NTP Sync. You can display NTP analysis using NTP Query button. |
| Set Time Zone | Specify the time zone for your appliance. | Select your local time zone from the Set Time Zone list and click Set Time Zone. |
| Set Manually Date/Time (mm/dd/yyyy hh:mm) | Set the time manually. | Type the date and time using the format mm/dd/yyyy hh/mm. Click Set Date/Time.Note: The Set Manually Date/Time (mm/dd/yyyy hh:mm) text box appears only if the Update Time Periodically functionality is disabled. |
4.5.5.7 - Configuring Email
The SMTP setting allows the system to send emails.

You can test that the email works by clicking Test. Error logs can be viewed on the Audit Store > Dashboard > Discover screen.
For more information about Discover, refer Working with Discover.
Some scripts run after you click Save.Ensure to save the details only when the connection is intact.

If the email address cannot be authenticated, then the Show Test Communication area displays the communication between the appliance and the SMTP server for debugging.
4.5.5.8 - Configuring Network Settings
On the Network Settings screen, you can configure the network details for the ESA. The following table explains the different settings that can be configured.
Information in the following table is specific to the Web UI. For information on the same features and configuring them in the CLI, refer here.
| Setting | Details | How to configure/change |
|---|---|---|
| Hostname | The hostname is a unique name for a system or a node in a network.In the hostname field, if special characters are to be used, then only hyphen (-) is supported. | Click Apply on the Web UI or change the hostname of the appliance from the Network Settings screen in the CLI Manager. |
| Management IP | The management IP, which is the IP address of the appliance, is defined through CLI Manager. | Select Blink to identify the interface. This will cause a LED on the NIC to blink and then click Change. |
| Default Route | The default route is an optional destination for all network traffic that does not belong to the LAN segment. For example, the IP address of your LAN router in the IP address format is 172.16.8.12. It is required only if the appliance is on a different subnet than the Appliance Web Interface. | Click Apply to set the default route. |
| Domain | The appliance domain name specified during appliance installation. | You can change it by specifying a new name and clicking Apply. |
| Search Domains | The appliance can belong to one domain and search an additional three domains. | You can add them using Add button. |
| Domain Name Servers | If your appliance uses domain names and IP addresses, then you must configure a domain name server (DNS) to help resolve Internet name addresses. The domain name should be for your local network, like Protegrity.com or math.mit.edu and the name servers should be IP addresses. The appliance can use up to three DNS servers for name resolving. Once you have configured a DNS, the system can be managed using an SSH connection. | You can add them using Add button, and remove them using Remove. You can specify them using Apply button. |
4.5.5.8.1 - Managing Network Interfaces
Using Settings > Network > Network Settings, you can view appliance network interfaces names and addresses and add them from the Interfaces page.

Changes to IP addresses
Changes to IP addresses are immediate. Changes to the management IP (on ethMNG), while connected via SSH or the Appliance Web Interface, causes the session to disconnect.
Assigning an Address to an Interface
Perform the following steps to assign an address to an interface.
- Navigate to Settings > Network.
- Click Network Settings.The Interfaces page appears.
- Identify the interface on the appliance by clicking Blink for the interface you want to identify.Select a LED on the NIC that blinks to indicate that interface.
- In the Interface row, type the address and Net mask of the interface, and then click Add.
Assigning an Address to an Interface Using Web UI
Perform the following steps to assign an address to an interface.
- In the Web UI, navigate to Settings > Network > Network Settings.The Network Settings page appears.
- In the Network Interfaces area, select Add New IP in the Gateway column.
Ensure that the IP address for the NIC is added. - Enter the IP address of the default gateway and select OK.The default gateway for the interface is added.
4.5.5.8.2 - NIC Bonding
The Network Interface Card (NIC) is a device through which appliances, such as ESA or DSG, on a network connect to each other. If the NIC stops functioning or is under maintenance, the connection is interrupted, and the appliance is unreachable. To mitigate the issues caused by the failure of a single network card, Protegrity leverages the NIC bonding feature for network redundancy and fault tolerance. In NIC bonding, multiple NICs are configured on a single appliance. You then bind the NICs to increase network redundancy. NIC bonding ensures that if one NIC fails, the requests are routed to the other bonded NICs. Thus, failure of a NIC does not affect the operation of the appliance. You can bond the configured NICs using different bonding modes.
Bonding Modes
The bonding modes determine how traffic is routed across the NICs. The MII monitoring (MIIMON) is a link monitoring feature that is used for inspecting the failure of NICs added to the appliance. The frequency of monitoring is 100 milliseconds. The following modes are available to bind NICs together:
- Mode 0/Balance Round Robin
- Mode 1/Active-backup
- Mode 2/Exclusive OR
- Mode 3/Broadcast
- Mode 4/Dynamic Link Aggregation
- Mode 5/Adaptive Transmit Load Balancing
- Mode 6/Adaptive Load Balancing
The following two bonding modes are supported for appliances:
- Mode 1/Active-backup policy: In this mode, multiple NICs, which are slaves, are configured on an appliance. However, only one slave is active at a time. The slave that accepts the requests is active and the other slaves are set as standby. When the active NIC stops functioning, the next available slave is set as active.
- Mode 6/Adaptive load balancing: In this mode, multiple NICs are configured on an appliance. All the NICs are active simultaneously. The traffic is distributed sequentially across all the NICs in a round-robin method. If a NIC is added or removed from the appliance, the traffic is redistributed accordingly among the available NICs. The incoming and outgoing traffic is load balanced and the MAC address of the actual NIC receives the request. The throughput achieved in this mode is high as compared to Mode 1/Active-backup policy.
Prerequisites
Ensure that you complete the following pre-requisites when binding interfaces:
- The IP address is assigned only to the NIC on which the bond is initiated. You must not assign an IP address to the other NICs.
- The NIC is not configured on an HA setup.
- The NICs are on the same network.
Creating a Bond
The following procedure describes the steps to create a bond between NICs. For more information about the bonding nodes, refer here.
Ensure that the IP address of the slave nodes are static.
Perform the following steps to create a bond.
On the Web UI, navigate to Settings > Network > Network Settings.The Network Settings screen appears.
Under the Network Interfaces area, click Create Bond corresponding to the interface on which you want to initiate the bond.The following screen appears.
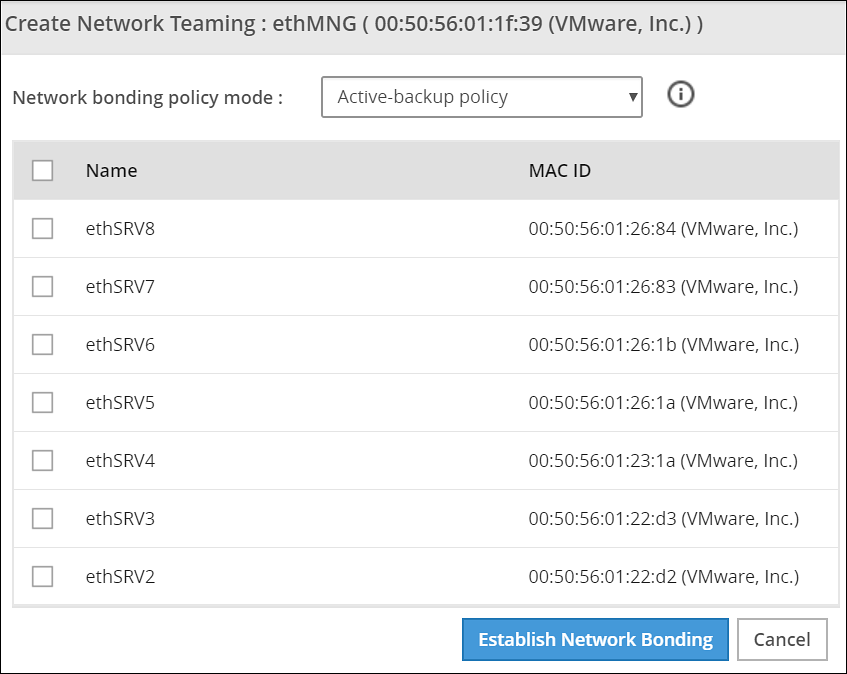
Ensure that the IP address is assigned to the interface on which you want to initiate the bond.
Select the following modes from the drop-down list:
- Active-backup policy
- Adaptive Load Balancing
Select the interfaces with which you want to create a bond.
Select Establish Network Bonding.A confirmation message appears.
Click OK.The bond is created, and the list appears on the Web UI.
Removing a Bond
Perform the following steps to remove a bond:
- On the Web UI, navigate to Settings > Network > Network Settings.The Network Settings screen appears with all the created bonds as shown in the following figure.
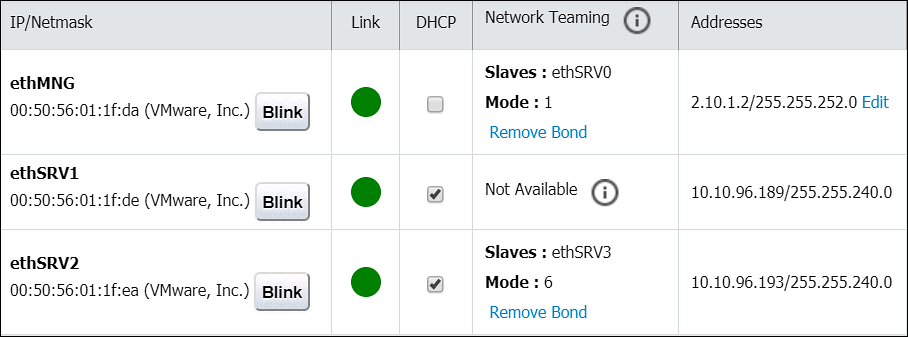
Under the Network Interfaces area, click Remove Bond corresponding to the interface on which the bonding is created.A confirmation screen appears.
Select OK.The bond is removed and the interfaces are visible on the IP/Network list.
Viewing a Bond
Using the DSG CLI Manager, you can view the bonds that are created between all the interfaces.
Perform the following steps to view a bond:
On the DSG CLI Manager, navigate to Networking > Network Settings.The Network Configuration Information Settings screen appears.
Navigate to Interface Bonding and select Edit.The Network Teaming screen displaying all the bonded interfaces appears as shown in the following figure.
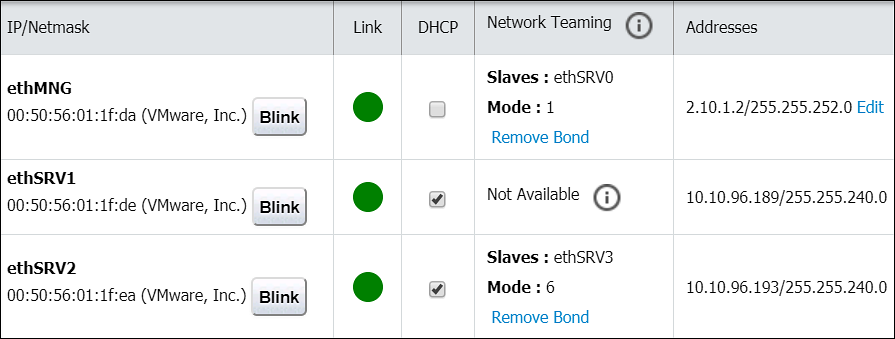
Resetting the Bond
You can reset all the bonds that are created for an appliance. When you reset the bonds, all the bonds created are disabled. The slave NICs are reset to their initial state, where you can configure the network settings for them separately.
Perform the following steps to reset all the bonds:
On the DSG CLI Manager, navigate to Networking > Network Settings.The Network Configuration Information Settings screen appears.
Navigate to Interface Bonding and select Edit.The Network Teaming screen displaying all the bonded interfaces appears.
Select Reset.The following screen appears.
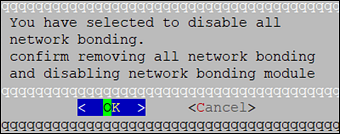
- Select OK.The bonding for all the interfaces is removed.
4.5.5.9 - Configuring Web Settings
Navigate to Settings > Network > Web settings, the Web Settings page contains the following sections:
- General Settings
- Session Management
- Shell In A Box Settings
- SSL Cipher Settings
4.5.5.9.1 - General Settings
The General Settings contains the following file upload configurations:
- Max File Upload Size
- File Upload Chunk Size
Increasing Maximum File Upload Size
By default, the maximum file upload size is set to 25 MB. You can increase the limit up to 4096 MB.
Perform the following steps to increase the maximum file upload size:
- From the ESA Web UI, proceed to Settings > Network > Web Settings.The Web Settings screen appears.

Move the Max File Upload Size slider to the right to increase the limit.
Click Update.
Increasing File Upload Chunk Size
By default, the file upload chunk size is set to 100 MB. You can increase the limit up to 512 MB.
Perform the following steps to increase the file upload chunk size:
- From the ESA Web UI, proceed to Settings > Network > Web Settings.The Web Settings screen appears.
Move the File Upload Chunk Size slider to the right to increase the limit.
Click Update.
4.5.5.9.2 - Session Management
Only the admin user can extend the time using this option. The extended time becomes applicable to all users of the ESA.
Managing the session settings
Only the admin user can extend the time using this option. The extended time becomes applicable to all users of the ESA.
Perform the following steps to timeout using ESA Web UI option:
From the ESA Web UI, proceed to Settings > Network.
Click Web Settings.The following screen appears.

Move the Session Timeout slider to the right to increase the time, in minutes.
Click Update.
Fixing the Session Timeout
Perform the following steps to fix the session timeout.
There may be cases where the timeout session should be fixed, and the appliance logs out even if the session is an active session.
From the ESA Web UI, proceed to Settings > Network.
Click Web Settings.The following screen appears.
Move the Session Timeout slider to the right or left to increase or decrease the time, in minutes.
Select the Is hard timeout check box.
Click Update.
4.5.5.9.3 - Shell in a box settings
This setting allows a user with Appliance Web Manager permission to configure access to the Shell In A Box feature which is available through the Web UI. This setting applies to all the users that have access to the Web UI.
When enabled the users are able to view the CLI icon on the bottom right corner of the web page.
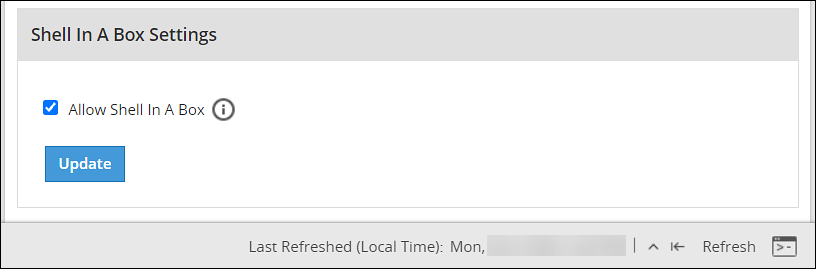
Perform the following steps to enable/disable Shell In A Box Settings.
From the ESA Web UI, proceed to Settings > Network.
Click Web Settings.The following screen appears.

To enable or disable the Shell In a Box Settings, select the Allow Shell In a Box check box.
Click Update.
4.5.5.9.4 - SSL cipher settings
The ESA uses the OpenSSL library to encrypt and secure connections. You can configure an encrypted connection using the following two strings:
- SSL Protocols
- SSL Cipher Suites
The protocols and the list of ciphers supported by the ESA are included in the SSLProtocol and SSLCipherSuite strings respectively. The SSLProtocol supports TLS v1, TLS v1.1, TLS v1.2, and TLS v1.3 protocols. It is recommended to use the TLS v1.3 protocol.
To disable any protocol from the SSLProtocol string, prepend a hyphen (-) to the protocol. To disable any cipher suite from the SSLCipherSuite string, prepend an exclamation (!) to the cipher suite.
For more information about the OpenSSL library, refer to http://www.openssl.org/docs.
Using TLS v1.3
The TLS v1.3 protocol is introduced from v8.1.0.0. If you want to use this protocol, then ensure that you append the following cipher suite in the SSLCipherSuite text box.
TLS_AES_256_GCM_SHA384:TLS_CHACHA20_POLY1305_SHA256:TLS_AES_128_GCM_SHA256:ECDHE-RSA-AES128-GCM-SHA256:ECDHE-ECDSA-AES128-GCM-SHA256:ECDHE-RSA-AES256-GCM-SHA384:ECDHE-ECDSA-AES256-GCM-SHA384:DHE-RSA-AES128-GCM-SHA256:DHE-DSS-AES128-GCM-SHA256:kEDH+AESGCM:ECDHE-RSA-AES128-SHA256:ECDHE-ECDSA-AES128-SHA256:ECDHE-RSA-AES128-SHA:ECDHE-ECDSA-AES128-SHA:ECDHE-RSA-AES256-SHA384:ECDHE-ECDSA-AES256-SHA384:ECDHE-RSA-AES256-SHA:ECDHE-ECDSA-AES256-SHA:DHE-RSA-AES128-SHA256:DHE-RSA-AES128-SHA:DHE-DSS-AES128-SHA256:DHE-RSA-AES256-SHA256:DHE-DSS-AES256-SHA:DHE-RSA-AES256-SHA:AES128-GCM-SHA256:AES256-GCM-SHA384:AES128-SHA256:AES256-SHA256:AES128-SHA:AES256-SHA:AES:CAMELLIA:!aNULL:!eNULL:!EXPORT:!DES:!RC4:!MD5:!PSK:!aECDH:!EDH-DSS-DES-CBC3-SHA:!EDH-RSA-DES-CBC3-SHA:!KRB5-DES-CBC3-SHA
4.5.5.9.5 - Updating a protocol from the ESA Web UI
Perform the following steps to update a protocol from the ESA Web UI:
In the ESA Web UI, navigate to Settings > Network > Web Settings.The Web Settings page appears.
Under SSL Cipher Settings tab, the SSLProtocol text box contains the value ALL-SSLv2-SSLv3.
Add
–to the required protocol.For example, to disable TLS1.1, type -TLSv1.1 in the SSLProtocol text box.

- Click Update to save the changes.
To re-enable TLSv1.1 using the Web UI, remove –TLSv1.1 from the SSLProtocol text box.
4.5.5.10 - Working with Secure Shell (SSH) Keys
The Secure Shell (SSH) is a network protocol that ensures an secure communication over unsecured network. A user connects to the SSH server using the SSH Client. The SSH protocol is comprised of a suite of utilities which provides high-level authentication encryption over unsecured communication channels.
A typical SSH setup consists of a host machine and a remote machine. A key pair is required to connect to the host machine through any remote machine. A key pair consists of a Public key and a Private key. The key pair allows the host machine to securely connect to the remote machine without entering a password for authentication.
For enhancing security, a Private key is secured using a passphrase. This ensures that only the rightful recipient can have access to the decrypted data. You can either generate key pairs or work with existing key pairs.
If you add a Private key without a passphrase, it is encrypted with a random passphrase. This passphrase is scrambled and stored.
If you choose a Private key with a passphrase, then the Private key is stored as it is. This passphrase is scrambled and stored.
For more information about generating the SSH key pairs, refer Adding a New Key.
The SSH protocol allows an authorized user to connect to the host machines from the remote machines. Both inbound communication and outbound communication are supported using the SSH protocol. An authorized user is a combination of an appliance user associated with a valid key pair. An authorized user must be listed as a valid recipient to connect using the SSH protocol.
The SSH protocol allows the authorized users to run tasks securely on the remote machine. When the users connect to the appliance using the SSH protocol, then the communication is known as inbound communication.
For more information about inbound SSH configuration, refer here.
When the users connect to a known host using their private keys, then the communication is known as outbound communication. The authorized users are allowed to initiate the SSH communication from the host.
For more information about outbound SSH configuration, refer here.
On the ESA Web UI, you can configure all the following standard aspects of SSH:
- Authorized Keys
- Identities Keys
- Known Hosts
SSH pane:With the SSH configuration Manager you can examine and manage the SSH configuration. The SSH keys can be configured in the Authentication Configuration pane on the ESA Web UI.
The following figure shows the SSH Configuration Manager pane.

Authentication Type:The SSH Server is configured in the following three ways:
- Password
- Public Key
- Password + publickey
| Authentication Type | Description |
|---|---|
| Password | In this authentication type, only the password is required for authentication to the SSH server. The public key is not required on the server for authentication. |
| Public Key | In this authentication type, the server requires only the public key for authentication. The password is not required for authentication. |
| Password + Public key | In this authentication type, the server can accept both, the keys and the password, for authentication. |
SSH Mode:
From the Web UI, navigate to Settings > Network > SSH. Using the SSH mode, restrictions for SSH connections can be set. The restrictions can be hardened or loosened based on the needs. There are four modes SSH mode types are shown below.
| Mode | SSH Server | SSH Client |
|---|---|---|
| Paranoid | Disable root access | Disable password authentication, that is, allow to connect only using public keys. Block connections to unknown hosts. |
| Standard | Disable root access | Allow password authentication. Allow connections to new (unknown) hosts, enforce SSH fingerprint of known hosts. |
| Open | Allow root access Accept connections using passwords and public keys. | Allow password authentication. Allow connection to all hosts – do not check hosts fingerprints. |
4.5.5.10.1 - Configuring the authentication type for SSH keys
Perform the following steps to configure the SSH Key Authentication Type.
From the ESA Web UI, navigate to Settings > Network.The Network Settings pane appears.
Select the SSH tab.The SSH Configuration Manager pane appears.
Select the authentication type from the Authentication Type drop down menu.

Select the SSH mode from the SSH Mode drop down menu.
Click Apply.A message Configuration saved successfully appears.
4.5.5.10.2 - Configuring inbound communications
The users who are allowed to connect to the ESA using SSH are listed in the Authorized Keys (Inbound) tab.
The following screen shows the Authorized Keys.
")
Adding a New Key
An authorized key has to be created for a user or a machine to connect to an ESA on the host machine.
Perform the following steps to add a new key.
From the ESA Web UI, navigate to Settings > Network.The Network Settings pane appears
Select the SSH tab.The SSH Configuration Manager pane appears.
Select the Authorized Keys (Inbound) tab.
Click Add New Key.The Add New Authorized Key dialog box appears.
Select a user.
Select Generate new public key.
The Root password is required to create Authorized Key prompt appears. Enter the root password and click Ok.
If the private key is to be saved, then select Click To Download Private Key.The private key is saved to the local machine.
If the public key is to be saved, then select Click To Download Public Key.The public key is saved to the local machine.
Click Finish.The new authorized key is added.
Uploading a Key
You can assign a public key to a user by uploading the key from the Web UI.
Perform the following steps to upload a key.
From the ESA Web UI, navigate to Settings > Network.The Network Settings pane appears.
Select the SSH tab.The SSH Configuration Manager pane appears.
Select the Authorized Keys (Inbound) tab.
Click Add New Key.The Add New Authorized Key dialog box appears.
Select a user.
Select Upload public key.The file browser dialog box appears.
Select a public key file.
Click Open.
The Root password is required to create Authorized Key prompt appears. Enter the root password and click Ok.The key is assigned to the user.
Reusing public keys between users
The public key of one user can be assigned as a public key of another user.
Perform the following steps to upload an existing key.
From the ESA Web UI, navigate to Settings > Network.The Network Settings pane appears.
Select the SSH tab.The SSH Configuration Manager pane appears.
Select the Authorized Keys (Inbound) tab.
Click Add New Key.The Add New Authorized Key dialog box appears.
Select a user.
Select Choose from existing keys.
Select the public key.
The Root password is required to create Authorized Key prompt appears. Enter the root password and click Ok.The public key is assigned to the user.
Downloading a Public Key
From the Web UI, you can download the public of a user to the local machine.
Perform the following steps to download a key.
From the ESA Web UI, navigate to Settings > Network.The Network Settings pane appears.
Select the SSH tab.The SSH Configuration Manager pane appears.
Select the Authorized Keys (Inbound) tab.
Select a user.
Select Download Public Key.The public key is saved to the local directory.
Deleting an Authorized Key
You can remove a key from the authorized users list. Once the key is removed from the list, the remote machine will no longer be able to connect to the host machine.
Perform the following steps to delete an authorized key:
From the ESA Web UI, navigate to Settings > Network.The Network Settings pane appears
Select the SSH tab.The SSH Configuration Manager pane appears.
Select the Authorized Keys (Inbound) tab.
Select a user.
Select Delete Authorized Key.A message confirming the deletion appears.
Click Yes.
The Root password is required to delete Authorized Key prompt appears. Enter the root password and click Ok.The key is deleted from the authorized keys list.
Clearing all Authorized Keys
You can remove all the public keys from the authorized keys list.
Perform the following steps to clear all keys:
From the ESA Web UI, navigate to Settings > Network.The Network Settings pane appears.
Select the SSH tab.The SSH Configuration Manager pane appears.
Select the Authorized Keys (Inbound) tab.
Click Reset List.A message confirming the deletion of all authorized keys appears.
Click Yes.
The Root password is required to delete all Authorized Keys prompt appears. Enter the root password and click Ok.All the keys are deleted.
4.5.5.10.3 - Configuring outbound communications
The users who can connect to the known hosts with their private keys are listed in the Identities Keys (Outbound) tab.
The following screen shows the Identities.
")
Adding a New Key
A new public key can be generated for the host machine to connect with another machine.
Perform the following steps to add a new key.
From the ESA Web UI, navigate to Settings > Network.The Network Settings pane appears.
Select the SSH tab.The SSH Configuration Manager pane appears.
Select the Identities Keys (Outbound) tab.
Click Add New Key.The Add New Identity Key dialog box appears.
Select a user.
Select Generate new keys.
The Root password is required to create Identity Key prompt appears. Enter the root password and click Ok.
If the public key is to be saved, then select Click to Download Public Key .The public key is saved to the local machine.
Click Finish.The new authorized key is added.
Downloading a Public Key
You can download the host’s public key from the Web UI.
Perform the following steps to download a key.
From the ESA Web UI, navigate to Settings > Network.The Network Settings pane appears.
Select the SSH tab.The SSH Configuration Manager pane appears.
Select the Identities Keys (Outbound) tab.
Select a user.
Select Download Public Key.The public key is saved to the local machine.
Uploading Keys
Perform the following steps to upload an existing key.
From the ESA Web UI, navigate to Settings > Network.The Network Settings pane appears.
Select the SSH tab.The SSH Configuration Manager pane appears.
Select the Identities Keys (Outbound) tab.
Click Add New Key.The Add New Identity Key dialog box appears.
Select a user.
Select Upload Keys.The list of public keys with the users that they are assigned to appears.
Select Upload Public Key.The file browser dialog box appears.
Select a public key file from your local machine.
Click Open.The public key is assigned to the user.
Select Upload Private Key.The file browser dialog box appears.
Select a private key file from your local machine.
Click Open.
If the private key is protected by a passphrase, then the text field Private Key Passphrase appears.Enter the private key passphrase.

- Click Finish.The new identity key is added.
Reusing public keys between users
The public and private key pair of one user can assigned as a public and private key pair of another user.
Perform the following steps to choose from an existing key.
From the ESA Web UI, navigate to Settings > Network.The Network Settings pane appears.
Select the SSH tab.The SSH Configuration Manager pane appears.
Select the Identities Keys (Outbound) tab.
Click Add New Key.The Add New Identity Key dialog box appears.
Select a user.
Select Choose from existing keys.
Select the public key.
The Root password is required to create Identity Key prompt appears. Enter the root password and click Ok.The public key is assigned to the user.
Deleting an Identity
You can delete an identity for a user. Once the identity is removed, the user will no longer be able to connect to another machine.
Perform the following steps to delete an identity:
From the ESA Web UI, navigate to Settings > Network.The Network Settings pane appears.
Select the SSH tab.The SSH Configuration Manager pane appears.
Select the Identities Keys (Outbound) tab.
Select a user.
Click Delete Identity.A message confirming the deletion appears.
Click Yes.
The Root password is required to delete the Identity Key prompt appears. Enter the root password and click Ok.The identity is deleted.
Clearing all Identities
You can remove all the public keys from the authorized keys list.
Perform the following steps to clear all identities.
From the ESA Web UI, navigate to Settings > Network.The Network Settings pane appears.
Select the SSH tab.The SSH Configuration Manager pane appears.
Select the Identities Keys (Outbound) tab.
Click Reset Identity List.A message confirming the deletion of all identities appears.
Click Yes.
The Root password is required to delete all Identity Keys prompt appears. Enter the root password and click Ok.All the identities are deleted.
4.5.5.10.4 - Configuring known hosts
By default, the SSH is configured to deny all the communications to unknown remote servers. Known hosts list the machines or nodes to which the host machine can connect to. The SSH servers to which the host can communicate with are added under Known Hosts.
Adding a New Host
You can add a host to the list of known hosts that can have a connection established.
Perform the following steps to add a host.
From the ESA Web UI, navigate to Settings > Network.The Network Settings pane appears.
Select the SSH tab.The SSH Configuration Manager pane appears.
Select the Known Hosts tab.
Click Add Host.The Enter the ip/hostname dialog box appears.
Enter the IP address or hostname in the Enter the ip/hostname text box.
Click Ok.All host is added to the known hosts list.
Updating the Host Keys
You can refresh the hostnames to check for updates to host’s public keys.
Perform the following steps to updated a host key.
From the ESA Web UI, navigate to Settings > Network.The Network Settings pane appears.
Select the SSH tab.The SSH Configuration Manager pane appears.
Select the Known Hosts tab.
Select a host name.
Click Refresh Host Key.The key for the host name is updated.
Deleting a Host
If a connection to a host is no longer required, then you can delete the host from the known host list.
Perform the following steps to delete a known host.
From the ESA Web UI, navigate to Settings > Network.The Network Settings pane appears.
Select the SSH tab.The SSH Configuration Manager pane appears.
Select the Known Hosts tab.
Select a host name.
Click Delete Host.A message confirming the deletion appears.
Click Yes.The host is deleted.
Resetting the Host Keys
You can set the keys of all the hosts to a default value.
Perform the following steps to reset all the host keys:
From the ESA Web UI, navigate to Settings > Network.The Network Settings pane appears.
Select the SSH tab.The SSH Configuration Manager pane appears.
Select the Known Hosts tab.
Select Reset Host Keys.A message confirming the reset appears.
Click Yes.The host keys for all the hostnames is set to a default value.
4.5.6 - Managing Appliance Users
Only authorized users can access the Appliances. These users are system users and LDAP administrative users. The roles of these users are explained in detail in the following sections.
Appliance Users
The root and local_admin users are appliance system users. These users are initialized during installation.
root and local_admin
As a root user, you can be asked to provide the root account password to log in to some CLI Manager tools. For example, Change Accounts and Passwords tool or Configure SSH tool.
The root account is used to exit the appliance command line interface and go directly into the host operating system command line. This gives the system administrator full control over the machine.
The local_admin is necessary for LDAP maintenance when the LDAP is not working or is not accessible.
The SSH permissions for local_admin are available by default.For information about SSH, refer Configuring the SSH.
LDAP Users
The admin and viewer user accounts are LDAP users that are initialized during installation.
For more information about users, refer here.
admin and viewer Accounts
The admin and viewer accounts are used to log onto CLI Manager or Appliance Web UI. These user accounts can be modified using:
- CLI Manager, for instructions refer to section Accounts and Passwords.
- Web UI, where these accounts are the part of the LDAP.
- Policy management.
When these passwords are changed in the CLI Manager or Appliance Web UI, the change applies to all other installed components, thus synchronizing the passwords automatically.
LDAP Target Users
When you have your appliance installed and configured, you can create LDAP users and assign necessary permissions to these users. You can also create groups of users. The system users are by default predefined in the internal LDAP directory.
For more information about creating users in LDAP and defining their security permissions, refer here.
System Roles
Protegrity Data Security Platform role-based access defines a list of roles, including a list of operations that a role can perform. Each user is assigned to one or more roles. User-based access defines a user to whom the operations are granted. There are several predefined roles on ESA.
The following table describes these roles.
| Role | Is used by… |
|---|---|
| root user | The OS system administrator who maintains the Appliance machine, which could be ESA or DSG. |
| admin user | The user who specifically manages the creation of roles and members in the LDAP directory. This user could also be the DBA, System Administrator, Programmer, and others. This user is responsible for installing, integrating, or monitoring Protegrity platform components into their corporate infrastructure for the purpose of implementing the Protegrity-based data protection solution. |
| viewer user | Personnel who can only view and not create or make changes. |
4.5.7 - Password Policy for all appliance users
The password policy applies to all LDAP users.
The LDAP user password should:
- Be at least 8 characters long
- Contain at least two of the following three character groups:
- Numeric [0-9]
- Alphabetic [a-z, A-Z]
- Special symbols, such as: ~ ! @ # $ % ^ & * ( ) _ + { } | : " < > ? ` - = [ ] \ ; ’ , . /
Thus, your password should look like one of the following examples:
- Protegrity123 (alphabetic and numeric)
- Protegrity!@#$ (alphabetic and special symbols)
- 123!@#$ (numeric and special symbols)
The strength of the password is validated by default. This strength validation can also be customized by creating a script file to meet the requirements of your organization.
From the CLI, press Administration > Accounts and Passwords > Manage Passwords and Local-Accounts. Select the correct Change option and update the password.
You can enforce organization rules for password validity from the Web UI, from Settings > Users > User Management, where the following can be configured:
- Minimum period for changeover
- Password expiry
- Lock on maximum failures
- Password history
For more information about configuring the password policy, refer here.
4.5.7.1 - Managing Users
You require users in every system to run the business application. The foremost step in any system involves setting up users that operate on different faces of the application.
In ESA, setting up a user involves operations such, as assigning roles, setting up password policies, setting up Active Directories (ADs) and so on. This section describes the various activities that constitute the user management for ESA. In ESA, you can add the following users:
- OS Users: Users for for managing and debugging OS related operations.
- Appliance users: User for performing various operations based on the roles assigned to them. Appliances users can be imported from other directory services too.
Understanding ESA Users
In any given environment, users are entities that consume services provided by a system. Only authorized users can access the system. In Protegrity appliances, users are created to manage ESA for various purposes. These users are system users and LDAP administrative users.
On ESA, navigate to Settings > Users > User Management to view the list of the users that are available in the appliance.
In ESA, users can be categorized as follows:
Internal Appliance Users
These are the users created by default when the ESA is installed. These users are used to perform various operations on the Web UI, such as managing cluster, managing LDAP, and so on. On ESA Web UI, navigate to Settings > Users > User Management to view the list of the users that are available in the appliance.
The following is the list of users that are created when ESA is installed.
| User Name | Description | Role |
|---|---|---|
| admin | Administrator account with access to the Web UI and CLI Manager options. | Security Administrator |
| viewer | User with view only access to the Web UI and CLI Manager options. | Security Administrator Viewer |
| PolicyUser | Perform security operations on the protector node. | Policy User |
| ProxyUser | Perform security operations on behalf of other policy users. | ProxyUser |
OS users
These are the users that contain access to all the CLI operations in the appliance. Local OS users can be created from the CLI Manager. On CLI Manager, navigate to Administration > Accounts and Passwords > Manage Passwords and Local Accounts to view and manage the OS users in the appliance.
The following is the list of OS users in the appliance.
| OS Users | Description |
|---|---|
| alliance | Handles DSG processes |
| root | Super user with access to all commands and files |
| local_admin | Local administrator that can be used when an LDAP user is not accessible |
| www-data | Daemon that runs the Apache, Service dispatcher, and Web services as a user |
| ptycluster | Handles TAC related services and communication between TAC through SSH. |
| service_admin and service_viewer | Internal service accounts used for components that do not support LDAP |
| clamav | Handles ClamAV antivirus |
| rabbitmq | Handles the RabbitMQ messaging queues |
| epmd | Daemon that tracks the listening address of a node |
| openldap | Handles the openLDAP utility |
| dpsdbuser | Internal repository user for managing policies |
Policy Users
These users are imported from a file or an external source for managing policy operations on ESA. Policy users are used by protectors that communicate with ESA for performing security operations.
External Appliance users
These are external users that are added to the appliance for performing various operations on the Web UI. The LDAP users are imported by using the External Groups or Importing Users.You can also add new users to the appliances from the User Management screen.
Ensure that the Proxy Authentication Settings are configured before importing the users.
Managing Appliance Users
After you configure the LDAP server, you can either add users to internal LDAP or import users from the external LDAP. The users are then assigned to roles based on the permissions you want to grant them.
Default users
The default users packaged with ESA that are common across appliances are provided in the following table. You can edit each of these roles to provide additional privileges.
| User Name | Description | Role |
|---|---|---|
| admin | Administrator account with full access to the Web UI and CLI Manager options. | Security Administrator |
| viewer | User with view only access to the Web UI and CLI Manager options. | Security Administrator Viewer |
| PolicyUser | Users who can perform security operations on the DSG Test Utility. | Policy User |
| ProxyUser | Users who can perform security operations on behalf of other policy users on the Protection Server.Note: The Protection Server is deprecated. This user should not be used. | ProxyUser |
Proxy users
The following table describes the three types of proxy users in ESA:
| Callout | Description |
|---|---|
| Local | Users that are authenticated using the local LDAP or created during installation. |
| Manual | Users that are manually created or imported manually from an external directory service. |
| Automatic | Users imported from an external directory service and are a part of different External Groups. For more information about External Groups, refer here. |
User Management Web UI
The user management screen allows you to add, import, and modify permissions for the users. The following screen displays the ESA User Management Web UI.

| Callout | Column | Description |
| 1 | Search User Name | Enter the name of the user you want to filter from the list of users. |
| 2 | User Name | Name of the user. This user can either be added to the internal LDAP server or imported from an external LDAP server. |
| 3 | Password Policy | Enable password policy for selected user. This option is
available only for local users. For more information about
defining password policy for users, refer Password Policy. |
| 4 | Block Users | Enable this option to block access to the appliance for the user. This option is available only for local users.
|
| 5 | User Password Status | Indicates status of the user. The available states are
as follows.
|
| 6 | Lock Status | User status based on the defined password policy. The
available states are as follows:
|
| 7 | Expiration Date | Indicates expiry status for a user. The available statuses
are as follows:
|
| 8 | User Type | Indicates if user is a local or manual (imported). |
| 9 | Additional Information | Provides information based on the defined password policy and block users. The available states are as follows:
|
| 10 | Last Unsuccessful Login (UTC) | Indicates the time of the last unsuccessful login attempted
by the user. The time displayed is in UTC. Note: If a user
successfully logs in through the Web UI or the CLI manager, then
the time stamp for any previous unsuccessful attempts is
reset. |
| 11 | Roles | Linked roles to that user. |
| 12 | Add User | Add a new internal LDAP user. |
| 13 | Import Users | Import users from the external LDAP server. Note: This option is available only when Proxy Authentication is enabled. |
| 14 | Import Azure Users | Import users from the Azure Active Directory. Note: This option is available only when Azure Active Directory is enabled. |
| 15 | Action | The following Actions are available.
|
| 16 | View Entries | Select number of users to be displayed in a single view. You can select to view up to 50 users. |
| 17 | Page Navigation | Navigate through pages to view more users. |
4.5.7.1.1 - Adding users to internal LDAP
You can create users with custom permissions and roles, and add them to the internal LDAP server.
Perform the following steps to add users to internal LDAP. In these steps, we will use the name “John Doe” as the name of the user being added to the internal LDAP.
In the Web UI, navigate to Settings > Users > User Management.
Click Add User to add new users.
- Click Cancel to exit the adding user screen.
- The & character is not supported in the Username field.
Enter John as First Name, Doe as Last Name, and provide a Description. The User Name text box is auto-populated. You can edit it, if required.
- The maximum number of characters that you can enter in the First Name, Last Name, and User Name fields is 100.
- The maximum number of characters that you can enter in the Description field is 200.
Click Continue to configure password.
Enter the password and confirm it in the consecutive text box.
Verify that the Enable Password Policy toggle button is enabled to apply password policy for the user.
The Enable Password Policy toggle button is enabled as default. For more information about password policy, refer here.
Click Continue to assign role to the user.
Select the role you want to assign to the user. You can assign the user to multiple roles.
Click Add User.
Enter your password prompt appears. Enter the password and click Ok. If the number of unsuccessful password attempts exceed the defined value in the password policy, the account gets locked.
For more information about Password Policy, refer here.
After 5 mins, the session ends, and you can no longer add users. The following figure shows this feature in the Web UI.
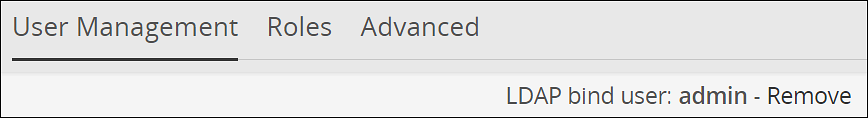
4.5.7.1.2 - Importing users to internal LDAP
In the User Management screen, you can import users from an external LDAP to the internal LDAP. This option gives you the flexibility to add selected users from your LDAP to the ESA.
Ensure that Proxy Authentication is enabled before importing users from an external directory service.
For more information about working with Proxy Authentication, refer to here.
The username in local LDAP is case-sensitive and the username in Active Directory is case-insensitive. It is recommended not to import users from external LDAP where the username in the local LDAP and the username in the external LDAP are same.
The users imported are not local users of the internal LDAP. You cannot apply password policy to these users. To convert the imported user to a local user, navigate to Settings > Users > User Management, select the user, and then click Convert to Local user ![]() . When you convert a user to a local LDAP user, ESA creates the user in its local LDAP server.
. When you convert a user to a local LDAP user, ESA creates the user in its local LDAP server.
Perform the following steps to import users to internal LDAP.
In the Web UI, navigate to Settings> Users > User Management.
Click Import Users to add an external LDAP user to the internal LDAP.The Import Users screen appears.
Select Search by Username to search the users by username or select Search by custom filter to search the users using the LDAP filter.
Type the required number of results to display in the Display Number of Results text box.
If you want to overwrite existing user, click Overwrite Existing Users.
Click Next.The users matching the search criteria appear on the screen.
Select the required users and click Next.The screen to select the roles appears.
Select the required roles for the selected users and click Next.
The Enter your password prompt appears. Enter the password and click Ok. If the number of unsuccessful password attempts exceed the defined value in the password policy, the account gets locked.
For more information about Password Policy, refer here.
The screen displaying the roles imported appears.
The users, along with the roles, are imported to the internal LDAP.
4.5.7.1.3 - Password policy configuration
The user with administrative privileges can define password policy rules. PolicyUser and ProxyUser have the Password Policy option as disabled, by default.
Defining a Password Policy
If the number of unsuccessful password attempts exceed the defined value in the password policy, the account gets locked.
For more information about Password Policy, refer here.
Perform the following steps to define a password policy.
From the ESA Web UI, navigate to Settings > Users.
On the User Management tab under the Define Password Policy area, click Edit (
 ).
).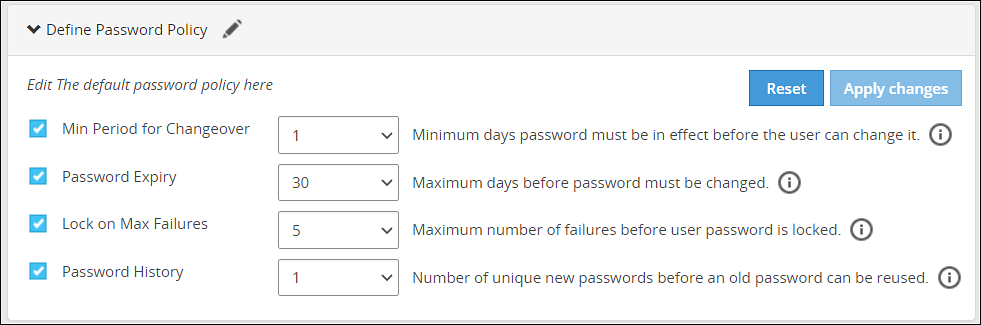
Select the password policy options for users which is described in the following table:
Password Policy Option Description Default Value Possible Values Minimum period for changeover Number of days since the last password change. 1 0-29 Password expiry Number of days a password remains valid. 30 0-720 Lock on maximum failures Number of attempts a user makes before the account is locked and requires Admin help for unlocking. 5 0-10 Password history Number of older passwords that are retained and checked against when a password is updated. 1 0-64 Click on Apply Changes.
Enter your password prompt appears. Enter the password and click Ok.
Resetting the password policy to default settings
If the number of unsuccessful password attempts exceed the defined value in the password policy, the account gets locked.
For more information about Password Policy, refer here.
The password policy is set to default values as mentioned in the Password Policy Configuration table.
The users imported into LDAP have Password Policy disabled, by default. This option cannot be enabled for imported users.
Perform the following steps to reset the password policy to default settings.
Click Reset.A confirmation message appears.
Click Yes.
The Enter your password prompt appears. Enter the password and click Ok.
Enabling password policy for Local LDAP users
Perform the following steps to enable password policy for Local LDAP users.
From the ESA Web UI, navigate to Settings > Users.
In the Manage Users area, click Password Policy toggle for the user.A dialog box appears requesting LDAP credentials.
The Enter your password prompt appears. Enter the password and click Ok.
After successful validation, password policy is enabled for the user.
Users locked out from too many password failures
If the number of unsuccessful password attempts exceed the defined value in the password policy, the account gets locked. Users who have been locked out receive the error message “Login Failure: Account locked” when trying to log in. To unlock the user, a user with administrative privileges must reset their password.
When an Admin user is locked, the local_admin user can be used to unlock the Admin user from the CLI Manager. Note that the local_admin is not part of LDAP, so it cannot be locked. For more information about Password Policy, including resetting passwords, refer Password Policy.
4.5.7.1.4 - Edit users
For every change done for the user, the Enter your password prompt appears. Enter the password and click Ok.
Perform the following steps to edit the user.
Navigate to Settings > Users > User Management. Click on a User Name.
Under the General Info section, edit the Description.
Under the Password Policy section, toggle to enable or disable the Password Policy.
Under the Roles section, select role(s) from the list for the user.
Click Reset Password to reset password for the user.
Click the
 icon to delete the user.
Users locked out from too many password failures
If the number of unsuccessful password attempts exceed the defined value in the password policy, the account gets locked.
For more information about Password Policy, refer here.
4.5.7.2 - Managing Roles
Roles are templates that include permissions and users can be assigned to one or more roles. Users in the appliance must be attached to a role.
The default roles packaged with ESA are as follows:
| Roles | Description | Permissions |
|---|---|---|
| Policy Proxy User | Allows a user to connect to DSG via SOAP/REST and access web services using Application Protector (AP). | Proxy-User |
| Policy User | Allows user to connect to DSG via SOAP/REST and perform security operations using Application Protector (AP). | Policy-User |
| Security Administrator Viewer | Role that can view the ESA Web UI, CLI, and reports. | Security Viewer, Appliance CLI Viewer, Appliance web viewer, Reports Viewer |
| Shell Accounts | Role who has direct SSH access to Appliance OS shell.Note: It is recommended that careful consideration is taken when assigning the Shell Accounts role and permission to a user.Ensure that if a user is assigned to the Shell Account role, no other role is linked to the same user. The user has no access to the Web UI or CLI, except when the user has password policy enabled and is required to change password through Web UI. | Shell (non-CLI) AccessNote: The user can access SSH directly if the permission is tied to this role. |
| Security Administrator | Role who is responsible for setting up data security using ESA policy management, which includes but is not limited to creating policy, managing policy, and deploying policy. | Security Officer, Reports Manager, Appliance Web Manager, Appliance CLI Administrator, Export Certificates, DPS Admin, Directory Manager, Export Keys, RLP Manager |
The capabilities of a role are defined by the permissions attached to the role. Though roles can be created, modified, or deleted from the appliance, permissions cannot be edited. The permissions that are available to map with a user and packaged with ESA as default permissions are as follows:
The ESA Roles web UI is as seen in the following image.
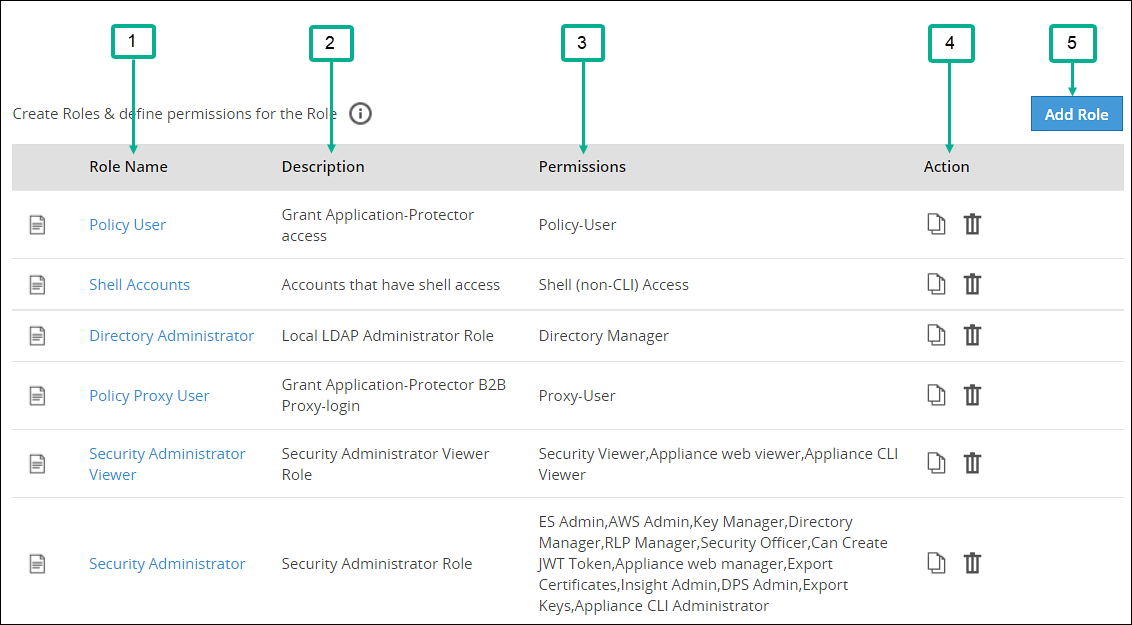
| Callout | Column | Description |
|---|---|---|
| 1 | Role Name | Name of the role available on ESA. Note: If you want to edit an existing role, click the role name from the displayed list. After making required edits, click Save to save the changes. |
| 2 | Description | Brief description about the role and its capabilities. |
| 3 | Permissions | Permission mapped to the role. The tasks that a user mapped to a role can perform is based on the permissions enabled. |
| 4 | Action | The following Actions are available.
|
| 5 | Add Role | Add a custom role to ESA. |
Duplicating and deleting roles
Keep the following in mind when duplicating and deleting roles.
- It is recommended to delete a role from the Web UI only. This ensures that the updates are reflected correctly across all the users that were associated with the role.
- When you duplicate or delete a role, the Enter your password prompt appears. Enter the password and click Ok to complete the task.
Adding a Role
You can create a custom business role with permissions and privileges that you want to map with that role. Custom templates provide the flexibility to create additional roles with ease.
Perform the following steps to add a role. In those steps we will use an example role named “Security Viewer”.
In the Web UI, navigate to Settings > Users > Roles.
If you want to edit an existing role, click the role name from the displayed list. After making required edits, click Save to save the changes.
Click Add Role to add a business role.
Enter Security Viewer as the Name.
Enter a brief description in the Description text box.
Select custom as the template from the Templates drop-down.
Under Role Permissions and Privileges area, select the permissions you want to grant to the role.Click Uncheck All to clear all the check boxes. Ensure that you do not select the Shell (non-CLI) Access permission for users who require Web UI and CLI access.
Click Save to save the role.
Enter your password prompt appears. Enter the password and click Ok.
4.5.7.3 - Configuring the proxy authentication settings
To configure the proxy authentication from the Web UI, the directory_administrator permission must be associated with the required role. It is also possible to do this through the CLI manager. For more information about configuring LDAP from the CLI manager, refer to here.
Perform the following steps to configure proxy authentication settings.
In the Web UI, navigate to Settings > Users > Proxy Authentication. The following figure shows example LDAP configuration.

Enter the LDAP IP address for the external LDAP in LDAP URI.The accepted format is ldap://host:port.
- Click the
 icon to add multiple LDAP servers.
 - Click the
 icon to remove the LDAP server from the list.
- Click the
Enter data in the fields as shown in the following table:
Fields Description Base DN The LDAP Server Base distinguished name. For example: Base DN: dc=sherwood, dc=com. Bind DN Distinguished name of the LDAP Bind User.
It is recommended that this user is granted viewer permissions. For example: Bind DN: administrator@sherwood.comBind Password The password of the specified LDAP Bind User. StartTLS Method Set this value based on configuration at the customer LDAP. Verify Peer Enable this setting to validate the certificate from an AD. If this setting is enabled, ensure that the following points are considered: - You must require a CA certificate to verify the server certificate from AD.For more information about certificates, refer Certificate Management.
- The LDAP Uri matches the hostname in the server and CA certificates.
- LDAP AD URI hostname is resolved in the hosts file.
LDAP Filter Provide the attribute to be used for filtering users in the external LDAP. For example, you can use the default attribute, sAMAccountName, to authenticate users in a single AD.
Note: In case of same usernames across multiple ADs, it is recommended to use LDAP filter such as UserPrincipalName to authenticate users.Click Test to test the provided configuration.A LDAP test connectivity passed successfully message appears.
Click Apply to apply and save the configuration settings.
The Enter your password prompt appears. Enter the password and click Ok.A Proxy Authentication was ENABLED and configuration were saved successfully message appears.
Navigate to System > Services and verify that the Proxy Authentication Service is running.

If you make any changes to the existing configuration, click Save to save and apply the changes. Click Disable to disable the proxy authentication.
After the Proxy Authentication is enabled, the user egsyncd_service_admin is enabled. It is recommended not to change the password for this user.
After enabling Proxy Authentication, you can proceed to adding users and mapping roles to the users. For more information about importing users, refer here.
4.5.7.4 - Working with External Groups
The directory service providers, such as, Active Directory (AD) or Oracle Directory Server Enterprise Edition (ODSEE), are identity management systems that contain information about the enterprise users. You can map the users in the directory service providers to the various roles defined in the Appliances. The External Groups feature enables you to associate users or groups to the roles.
You can import users from a directory service to assign roles for performing various security and administrative operations in the appliances. Using External Groups, you connect to an external source, import the required users or groups, and assign the appliance-specific roles to them. The appliances automatically synchronize with the directory service provider at regular time intervals to update user information. If any user or group in a source directory service is updated, it is reflected across the users in the external groups. The updates made to the local LDAP do not affect the source directory service provider.
If any changes occur to the roles or users in the external groups, an audit event is triggered.
Ensure that Proxy Authentication is enabled to use an external group.
The following screen displays the External Groups screen.

Only users with Directory Manager role can configure the External Groups screen.
The following table describes the actions you can perform on the External Groups screen.
| Icon | Description |
|---|---|
| List the users present for the external group. | |
| Synchronize with the external group to update the users. | |
| Delete the external group. |
Required fields for External Groups
Listed below are the required fields for creating an External Group.
Title: Name designated to the External Group
Description: Additional text describing the External Group
Group DN: Distinguished name where groups can be found in the directory
Query by: To pull users from the directory server, query the directory server using required parameters. This can be achieved using one of the following two methods:
Query by UserQuery by User allows to add specific set of users from a directory server.
Group PropertiesIn the Group Properties, the search is based on the values entered in the Group DN and Member Attribute Name text boxes. Consider an example, where the values in the Group DN and Member Attribute Name are cn=esa,ou=groups,dc=sherwood,dc=com and memberOf respectively. In this case, the search is performed on every user that is available in the directory server. The memberOf value of the users are matched with the specified Group DN. Only those users whose memberOf value matches the Group DN values are returned.
Search FilterThis field facilitates searching multiple users using regex patterns. Consider an example, where the values in the Search Filter for the user is cn=S*. In this case all the users beginning with cn=S in the directory server are retrieved.
Query by GroupUsing this method, you can search and add users of a group in the directory server. All the users belonging to the group are retrieved in the search process.
Group PropertiesIn the Group Properties, the search is based on the values entered in the Group DN and Member Attribute Name text boxes. Consider an example, where the values in the Group DN and Member Attribute Name are cn=hr,ou=groups,dc=sherwood,dc=com and member respectively. The search is performed in the directory server for the group mentioned in the Group DN text box. If the group is available, then all the users of that group containing value of member attribute as cn=hr,ou=groups,dc=sherwood,dc=com are retrieved.
Search FilterThis field facilitates searching multiple groups across the directory server. The users are retrieved based on the values provided in the Search Filter and Member Attribute Name text boxes. A search is performed on the group mentioned in Search Filter and the value mentioned in the Member Attribute Name attribute of the group is fetched. Consider an example, where the values in the Search Filter for the group is cn=accounts and the value in the Member Attribute Name value is member. All the groups that match with cn=accounts are searched. The value that is available in the member attribute of those groups are retrieved as the search result.
Adding an External Group
You can add an external group to assign roles for a group of users. For example, consider a scenario to add an external group with data entered in the Search Filter textbox.
Perform the following steps to add an external group.
In the ESA Web UI, navigate to Settings > Users > External Groups.
Click Create.
Enter the required information in the Title and Description fields.

If you select Group Properties, then enter the Group DN and Member Attribute Name.For example,
Enter the following DN in the Group DN text box:
cn=Joe,ou=groups,dc=sherwood,dc=comEnter the following attribute in the Member Attribute Name text box:
memberOfThis text box is not applicable for ODSEE.
If you select Search Filter, enter the search criteria in the Search Filter text box.
For example,
For AD, you can enter the search filter as follows:
(&(memberOf=cn=John,dc=Bob,dc=com))For ODSEE, you can enter the search filter as follows:
isMemberOf=cn=Alex,ou=groups,dc=sherwood,dc=comClick Preview Users to view the list of users for the selected search criteria.
Select the required roles from the Roles tab.
Click Save.
An external group is added.
The Users tab is visible, displaying the list of users added as a part of the external group.
Importing from ODSEE and special characters
If you are importing users from ODSEE, usernames containing special characters are not supported. Special characters include semi colon, forward slash, curly brackets, parentheses, angled brackets, or plus sign. That is: ;, /, {}, () , <>, or +, respectively.
Editing an External Group
You can edit an external group to modify fields such as Description, Mode, Roles, or Group Properties. If any updates are made to the roles of the users in the external groups, the modifications are applicable immediately to the users existing in the local LDAP.
Ensure that you synchronize with the source directory service if you update the Group DN or the search filter.
Perform the following steps to edit an external group:
In the ESA Web UI, navigate to Settings > Users > External Groups.
Select the required external group.
Edit the required fields.
Click Save.
The Enter your password prompt appears. Enter the password and click Ok.The changes to the external group are updated.
Deleting an External Group
When you delete an external group, the following scenarios are considered while removing a user from an external group:
- If the users are not part of other external groups, the users are removed from the local LDAP.
- If the users are a part of multiple external groups, only the association with the deleted external group and roles is removed.
Perform the following steps to remove an External Group:
In the ESA Web UI, navigate to Settings > Users > External Groups.
Select the required external group and click the Delete (
) icon.The Enter your password prompt appears. Enter the password and click Ok.The external group is deleted.
Synchronizing the External Group
When the proxy authentication is enabled, the External Groups Sync Service is started. This service is responsible for the automatic synchronization of the external groups with the directory services. The time interval for automatic synchronization is 24 hours.
You can manually synchronize the external groups with the directory services using the Synchronize (![]() ) icon.
) icon.
After clicking theSynchronize (![]() ) icon, the Enter your password prompt appears. Enter the password and click Ok.
) icon, the Enter your password prompt appears. Enter the password and click Ok.
The following scenarios occur when synchronization is performed between the external groups and the directory services.
- Users are added to ESA and roles are assigned.
- Roles of existing users in ESA are updated.
- Users are deleted from the ESA if they are associated with any external groups.
Based on the scenarios, the messages appearing in the Web UI, when synchronization is performed, are described in the following table.
| Message | Description |
|---|---|
| Added | Users are added to the ESA the roles mentioned in the external groups are assigned to the user. |
| Updated | Roles pertaining to the users are updated ESA. |
| Removed | Roles corresponding to the deleted external group is removed for the users. Users are not deleted from ESA. |
| Deleted | Users are deleted from ESA as they are not associated to any external group. |
| Failed | Updates to the user fail. The reason for the failure in update appears in the Web UI. |
If a GroupDN for an external group is not available during synchronization, the users are removed or deleted. The following log appears in the Insight logs:
Appliance Warning: GroupDN is missing in external Source.
Also, in the Appliance logs, the following message appears:
External Group: <Group name>, GroupDN: <domain name> could not be found on the external source
4.5.7.5 - Configuring the Azure AD Settings
You can configure the Azure AD settings from the Web UI. Using the Web UI, you can enable the Azure AD settings to manage user access to cloud applications, import users or groups, and assign specific roles to them.
For more information about configuring Azure AD Settings from the CLI Manager, refer here.
Before configuring Azure AD Settings on the ESA, you must have the following information that is required to connect the ESA with the Azure AD:
- Tenant ID
- Client ID
- Client Secret or Thumbprint
For more information about the Tenant ID, Client ID, Authentication Type, and Client Secret/Thumbprint, search for the text Register an app with Azure Active Directory on Microsoft’s Technical Documentation site at https://learn.microsoft.com/en-us/docs/
The following are the list of the API permissions that must be granted.
- Group.Read.All
- GroupMember.Read.All
- User.Read
- User.Read.All
To assign API permissions in Microsoft Azure, contact your Microsoft Azure administrator.
For more information about configuring the application permissions in the Azure AD, please refer https://learn.microsoft.com/en-us/graph/auth-v2-service?tabs=http.
Ensure that the Allow public client flows setting is Enabled. To enable the Allow public client flows setting, navigate to Authentication > Advanced settings, click the toggle button, and select Yes.
Perform the following steps to configure Azure AD settings:
- On the Web UI, navigate to Settings > Users > Azure AD.The following figure shows an example of Azure AD configuration.

Enter the data in the fields as shown in the following table:
Setting Description Tenant ID Unique identifier of the Azure AD instance. Client ID Unique identifier of an application created in Azure AD. Auth Type Select one of the Auth Type: - SECRET indicates a password-based authentication. In this authentication type, the secrets are symmetric keys, which the client and the server must know.
- CERT indicates a certificate-based authentication. In this authentication type, the certificates are the private keys, which the client uses. The server validates this certificate using the public key.
Client Secret/Thumbprint The client secret/thumbprint is the password of the Azure AD application. - If the Auth Type selected is SECRET, then enter Client Secret.
- If the Auth type selected is CERT, then enter Client Thumbprint.
Disable Password Login Enable or disable password-based login for Azure AD Users. - When this toggle is enabled, password-based login is disabled for Azure AD users.
- When this toggle is disabled, password-based login is retained for Azure AD users.
For more information about the Tenant ID, Client ID, Authentication Type, and Client Secret/Thumbprint, search for the text Register an app with Azure Active Directory on Microsoft’s Technical Documentation site at https://learn.microsoft.com/en-us/docs/.
Click Test to test the provided configuration.The Azure AD settings are authenticated successfully. To save the changes, click ‘Apply/Save’. message appears.
Click Apply to save and enable the Azure AD settings.The Azure AD settings are saved and enabled successfully message appears.
4.5.7.5.1 - Importing Azure AD Users
Before importing Azure users, ensure that the following prerequisites are considered:
- Ensure that the user is not present in the nested group. If the user is present in the nested group, then the nested group will not be synced on the ESA.
- Check the user status before importing them to the ESA. If a user with the Disabled status is imported, then that user will not be able to login to the ESA.
- Ensure that an external user is not added to the group. If an external user is added to the group, then that user will not be synced on the ESA.
- Ensure that the special character # (hash) is not used while creating the username. If you are importing users from the Azure AD, then the usernames containing the special character # (hash) will not be able to login to the ESA. The usernames containing the following special characters are supported in the ESA.
- ’ (single quote)
- . (period)
- ^ (caret)
- ! (exclamation)
- ~ (tilde)
- - (minus)
- _ (underscore)
- Ensure that the Azure AD settings are enabled before importing the users.
You can import users from the Azure AD to the ESA, on the User Management screen.
For more information about configuring the Azure AD settings, refer here.
Perform the following steps to import Azure AD users.
On the Web UI, navigate to Settings > Users > User Management.
Click Import Azure Users.
The Enter your password prompt appears. Enter the password and click Ok.The Import Users screen appears.
Search a user by entering the name in the Username/Filter box.
If required, toggle the Overwrite Existing Users option to ON to overwrite users that are already imported to the ESA.
Click Next.The users matching the search criteria appear on the screen.
Select the required users and click Next.The screen to select the roles appears.
Select the required roles for the selected users and click Next.The screen displaying the imported users appears.
Click Close.The users, with their roles, are imported to the ESA.
4.5.7.5.2 - Working with External Azure Groups
The Azure AD is an identity management system that contains information about the enterprise users. You can map the users in the Azure AD to the various roles defined in the ESA. The External Azure Groups feature enables you to associate users or groups to the roles.
You can import users from the Azure AD to assign roles for performing various security and administrative operations on the ESA. Using External Azure Groups, you connect to Azure AD, import the required users or groups, and assign the appliance-specific roles to them.
Ensure that Azure AD is enabled to use external Azure group.
The following screen displays the External Azure Groups screen.

Only users with the Directory Manager permissions can configure the External Groups screen.
The following table describes the actions that you can perform on the External Groups screen.
| Icon | Description |
|---|---|
| List the users present for the Azure External Group. | |
| Synchronize with the Azure External Group to update the users. | |
| Delete the Azure External Group. |
Adding an Azure External Group
You can add an Azure External Group to assign roles for a group of users.
Perform the following steps to add an External Group.
From the ESA Web UI, navigate to Settings > Users > Azure External Groups.
Click Add External Group.
Enter the group name in the Groupname/Filter field.

Click Search Groups to view the list of groups.
Select one group from the list, and click Submit.
Enter a description in the Description field.
Select the required roles from the Roles tab.
Click Save.The External Group has been created successfully message appears.
Editing an Azure External Group
You can edit an Azure external group to modify Description and Roles. If any updates are made to the roles of the users in the Azure External Groups, then the modifications are applicable immediately to the users existing on the ESA.
Perform the following steps to edit an External Group:
On the ESA Web UI, navigate to Settings > Users > Azure External Groups.
Select the required external group.
Edit the required fields.
Click Save.
The Enter your password prompt appears. Enter the password and click Ok.The changes to the external group are updated.
Synchronizing the Azure External Groups
When the Azure AD is enabled, the Azure External Groups is started. You can manually synchronize the Azure External Groups using the Synchronize (![]() ) icon.
) icon.
After clicking the Synchronize (![]() ) icon, the Enter your password prompt appears. Enter the password and click Ok.
) icon, the Enter your password prompt appears. Enter the password and click Ok.
Note: If the number of unsuccessful password attempts exceed the defined value in the password policy, then the user account gets locked.
For more information about Password Policy, refer here.
The messages appearing on the Web UI, when synchronization is performed between Azure External Groups and the ESA, are described in the following table.
| Message | Description |
|---|---|
| Success |
|
| Failed | Updates to the user failed.Note: The reason for the failure in updating the user appears on the Web UI. |
Deleting Azure External Groups
When you delete an Azure External Group, the following scenarios are considered while removing a user from the Azure External Group:
- If the users are not part of other external groups, then the users are removed from the ESA.
- If the users are a part of multiple external groups, the only the association with the deleted Azure External Group and roles is removed.
Perform the following steps to remove an Azure External Group.
From the ESA Web UI, navigate to Settings > Users > Azure External Groups.
Select the required external group and click the Delete (
) icon.The Enter your password prompt appears. Enter the password and click Ok.The Azure External Group is deleted.
4.6 - Trusted Appliances Cluster (TAC)
Network clustering is where a group of computers are organized so they function together, providing highly available resources. Clustering is highly desirable for disaster recovery. Failure of one system will not affect business continuity and the performance of resources is maintained.
A Trusted Appliances cluster (TAC) is a tool, where appliances, such as, ESA or DSG replicate and maintain information. In a TAC, multiple appliances are connected using SSH. A trusted channel is created to transfer data between the appliances in the cluster. You can also run remote commands, backup data, synchronize files and configurations across multiple sites, or import/export configurations between appliances that are directly connected to each other.
In a TAC, all the systems in the cluster are in an active state. The request for security operations are handled across the active appliances in the cluster. Thus, in case of a failure of an appliance, the requests are balanced across other appliances in the cluster.
4.6.1 - TAC Topology
The TAC is a connected graph with a fully connected cluster. In a fully connected cluster, every node directly communicates with other nodes in the cluster.
The following figure shows a connected graph with four nodes A, B, C, and D that are directly connected to each other.

In a TAC, each appliance is classified either as a client or a server.
- Client: A client is a stateless agent that requests information from a server.
- Server: A server maintains information about all the appliances in the cluster, performs regular health checks, and responds to queries from the clients.
A server can be further classified as a leader or a follower. The leader is responsible for maintaining the status of cluster and replicating cluster-related information among other servers in the cluster. The first appliance that is added the cluster is the leader. The other appliances added to the cluster are followers.
It is important to maintain the number of servers to keep the cluster available. For a cluster to be available, the number of servers available must be (N/2) + 1, where N is the number of servers in the cluster. Thus, it is recommended to have a minimum of three servers in your cluster for fault tolerance.
4.6.2 - Cluster Configuration Files
In a cluster, you can deploy an appliance as a server or a client by modifying the cluster configuration files. For deploying an appliance on a cluster, the following configuration files are available for an appliance.
agent.json
The agent.json file specifies the role of an appliance in the cluster. The file is available in the /opt/cluster-consul-integration/configure directory.
The following table describes the attributes that can be configured in the agent.json file.
| Attribute | Description | Values |
|---|---|---|
| type | The role of the appliance in the cluster. |
|
agent_auto.json
This file is considered only if the type attribute in the agent.json file is set to auto. The agent_auto.json file specifies the maximum number of servers allowed in a cluster. Additionally, you can also specify which appliances can be added to the cluster as servers.
The agent_auto.json file is available in the /opt/cluster-consul-integration/configure directory.
The following table describes the attributes that can be configured in the agent_auto.json file.
| Attribute | Description | Values |
|---|---|---|
| maximum_servers | The maximum number of servers that can be deployed in a cluster. | 5 (default)Note
|
| PAP_eligible_servers | The list of appliances that can be deployed as servers. |
|
config.json
This file contains the cluster-related information for an appliance, such as, data center, ports, Consul certificates, bind address, and so on. The config.json file is available in the /opt/consul/configure directory.
4.6.3 - Deploying Appliances in a Cluster
You can deploy the appliances in a cluster as a server or a client. The type attribute in the agent.json file and the PAP_eligible_servers and maximum_servers attributes in the agent_auto.json file determine how the appliance is deployed in the cluster.
The files agent.json and agent_auto.json are located at /opt/cluster-consul-integration/configure directory.
The following flowchart illustrates how an appliance is deployed in a cluster.

Example process for deploying appliances in a cluster
Consider an ESA appliance, ESA001, on which you create a cluster. As this is the first appliance on the cluster, ESA001 is becomes the leader of the cluster. The following are the values of the default attributes of the agent.json and agent_auto.json files on ESA001.
- type: auto
- maximum_servers: 5
- PAP_eligible_servers: ESA
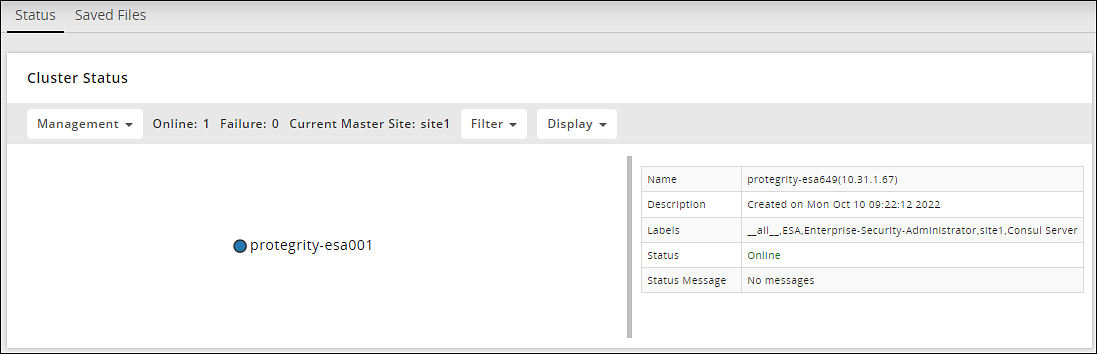
Now, you want to add another ESA appliance, ESA002, to this cluster as a server. In this case, you must ensure that the type attribute in the agent.json file of ESA002 is set as server.
If you want to add an ESA003 to the cluster as a client, you must ensure that the type attribute in the agent.json file of ESA003 is set as client.
The following figure illustrates the cluster comprising of nodes ESA001, ESA002, and ESA003.
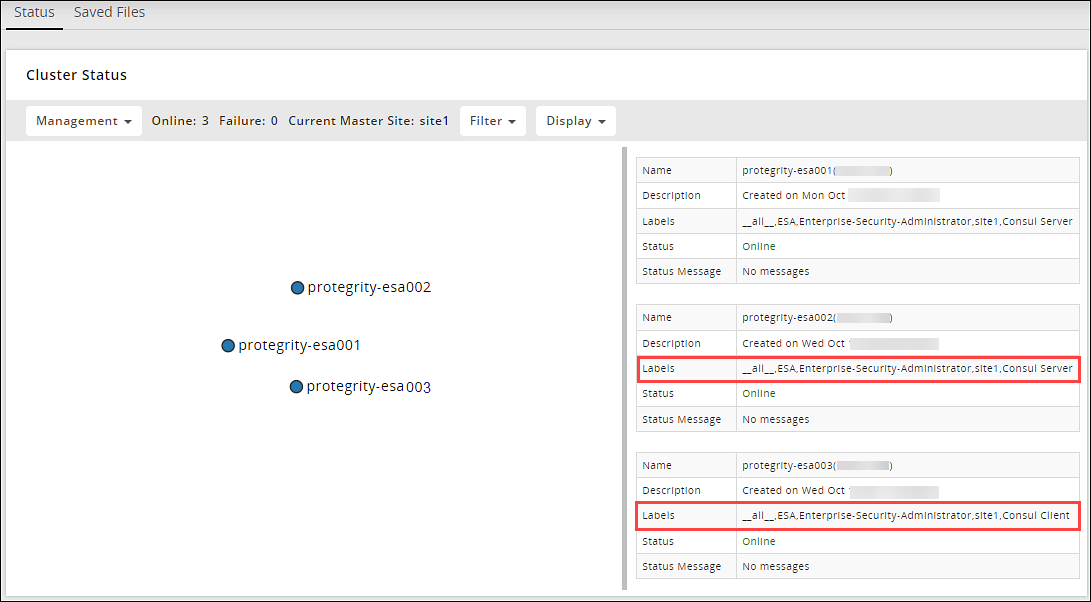
Now, you add another ESA appliance, ESA004, to this cluster with the following attributes:
- type: auto
- maximum_servers: 5
- PAP_eligible_servers: ESA
In this case, the following checks are performed:
- Is the value of maximum_servers greater than zero? Yes.
- Is the number of servers in the cluster exceeding the maximum_servers? No
- Is the appliance code of ESA004 in the PAP_eligible_servers list? Yes.
The name or appliance code of appliances can be viewed in the Appliance_code file in the /etc directory.
As long as the limit of the number of servers on the cluster is not exceeded and the appliance is a part of the server list, ESA004 is added as a server as shown in the following figure.
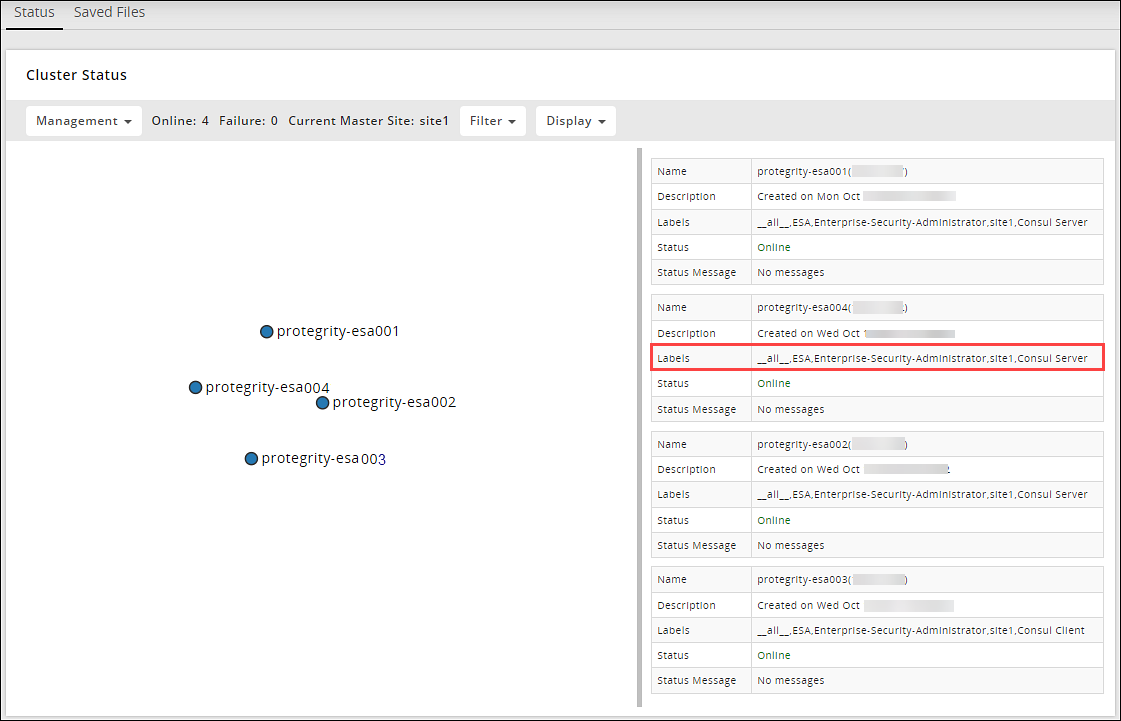
Now add a DSG appliance named CG001 to this cluster with the following attributes:
- type: auto
- maximum_servers: 5
- PAP_eligible_servers: CG
In this case, the following checks are performed:
- Is the maximum_servers greater than zero? Yes.
- Is the number of servers in the cluster exceeding the maximum_servers? No.
- Is the appliance code of CG001 in the PAP_eligible_servers list? Yes.
Thus, DSG1 is added to the cluster as a server.
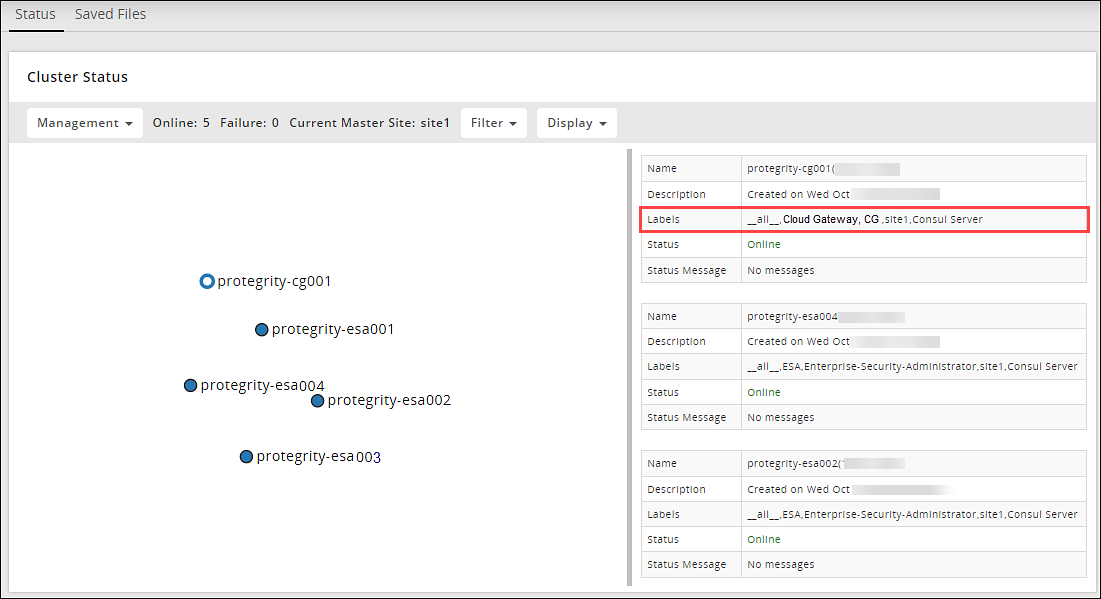
Now, consider a cluster with five servers, ESA001, ESA002, ESA003, ESA004, and ESA006 as shown in the following figure.
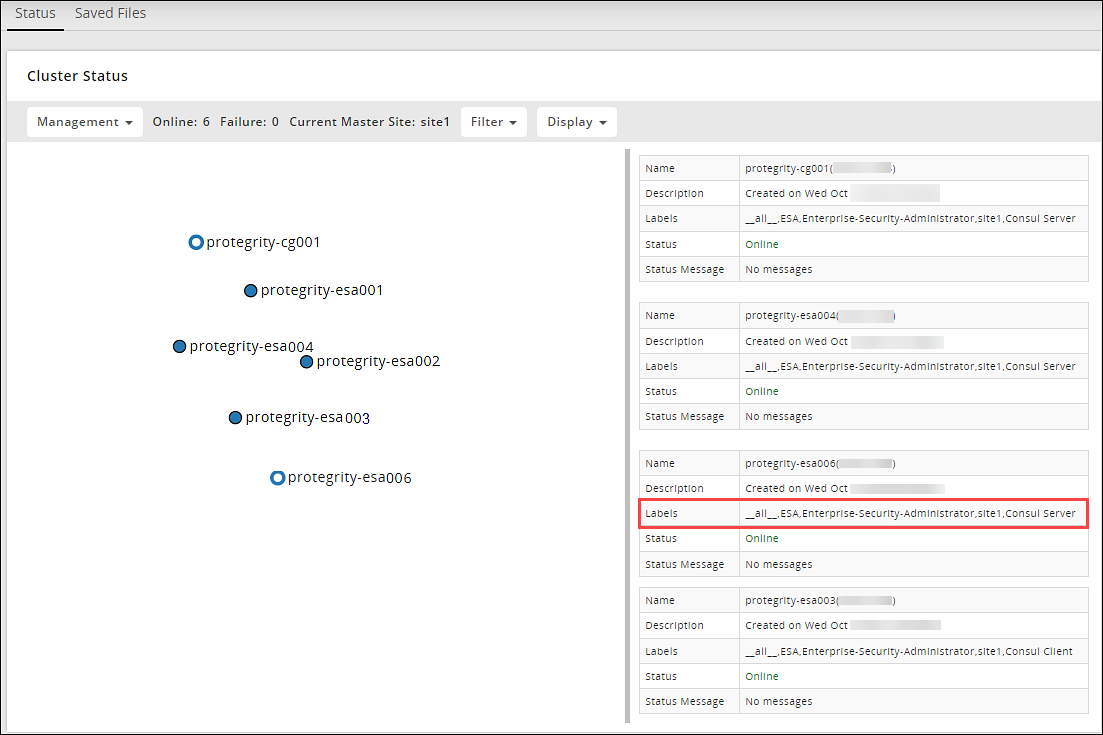
You now add another ESA appliance, ESA007 to this cluster, with the following attributes:
- type: auto
- maximum_servers: 5
- PAP_eligible_servers: ESA
In this case, the following checks are performed:
- Is the maximum_servers greater than zero? Yes.
- Is the number of servers in the cluster exceeding the maximum_servers? Yes
- Is the appliance code of ESA007 in the PAP_eligible_servers list? Yes
Thus, as the limit of the number of servers in a cluster is exceeded, ESA007 is added as a client.
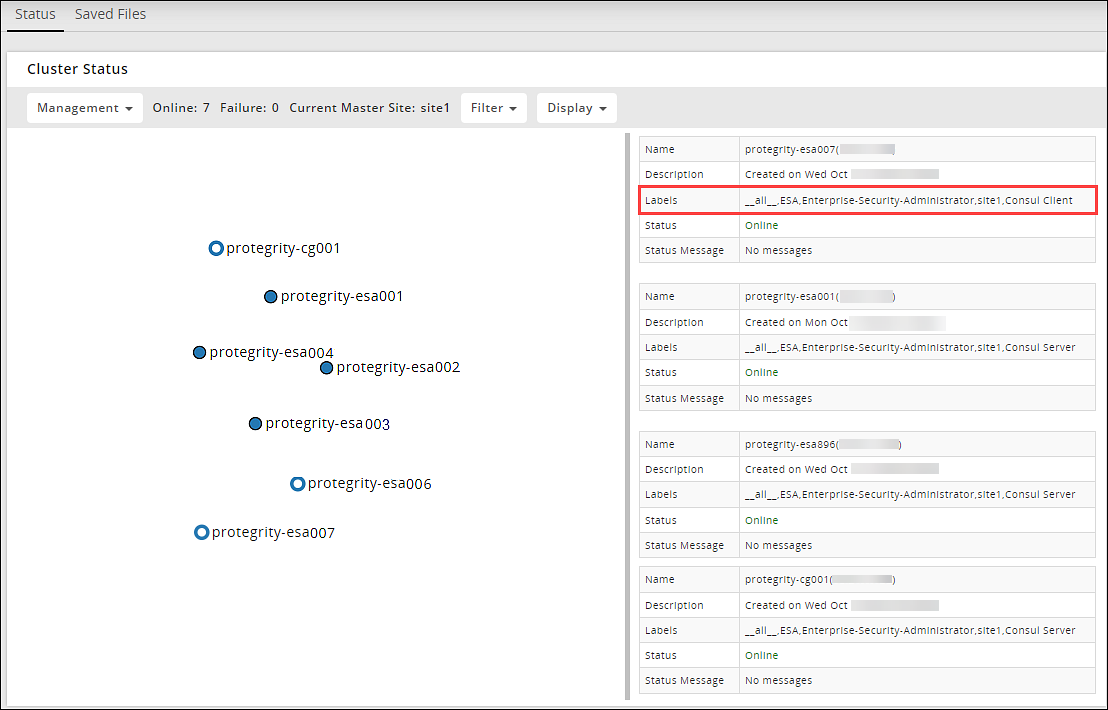
4.6.4 - Cluster Security
This section describes about the Cluster Security.
Gossip Key
In the cluster, the appliances communicate using the Gossip protocol. The cluster supports encrypting the communication using the gossip key. This key is generated during the creation of the cluster. The gossip key is then shared across all the appliances in the cluster.
SSL Certificates
SSL certificates are used to authenticate the appliances on the cluster. Every appliance contains the following default cluster certificates in the certificate repository:
- Server certificate and key for Consul
- Certificate Authorities(CA) certificate and key for Consul
In a cluster, the server certificates of the appliances are validated by the CA certificate of the appliance that initiated the cluster. This CA certificate is shared across all the appliances on the cluster for SSL communication.
You can also upload your custom CA and server certificates to the appliances on the cluster. The CA.key file is not mandatory when you deploy custom certificates for an appliance.
Ensure that you apply a single CA certificate on all the appliances in the cluster.
If the CA.key is available, the appliances that are added to the cluster download the CA certificate and key. The new server certificate for the appliance are generated using the CA key file.
If the CA.key is not available, all the keys and certificates are shared among the appliances in the cluster.
Ensure that the custom certificates match the following requirements:
The CN attribute of the server certificate is set in the following format:
server.<datacenter name>.<domain>
The domain and datacenter name must be equal to the value mentioned in theconfig.json file. For example, server.ptydatacenter.protegrity.
The custom certificates contain the following entries:
localhost
- 127.0.0.1
- FQDN of the local servers in the clusterFor example, an SSL Certificate with SAN extension of servers ESA1, ESA2, and ESA3 in a cluster has the following entries:
localhost
- 127.0.0.1
- ESA1.protegrity.com
- ESA2.protegrity.com
- ESA3.protegrity.com
The following figure illustrates the certificates.

Ports
The following ports are used for enabling communication between appliances:
- TCP port of 8300 – Used by servers to handle incoming request
- TCP and UDP ports of 8301 – Used by appliances to gossip on LAN
- TCP and UDP ports of 8302 – Used by appliances to gossip on WAN
Appliance Key Rotation
If you are using cloned machines to join a cluster, it is necessary to rotate the keys on all cloned nodes before joining the cluster. If the cloned machines have proxy authentication, two factor authentication, or TAC enabled, it is recommended to use new machines. This avoids any limitations or conflicts, such as, inconsistent TAC, mismatched node statuses, conflicting nodes, and key rotation failures due to keys in use.
For more information about rotating the keys, refer here.
4.6.5 - Reinstalling Cluster Services
If the configuration files for TAC are corrupted, you can reinstall the consul service.
Before you begin
Ensure that Cluster-Consul-Integration service is uninstalled before reinstalling Consul service.
To reinstall the Cluster-Consul-Integration service:
In the CLI Manager, navigate to Administration > Add/Remove Services.
Press ENTER.
Enter the root password and select OK.
Select Install applications.
Select the Consul service and select OK.
Select Yes.
The Consul product is reinstalled on your appliance.
Install the Cluster-Consul-Integration service.
For more information about installing services, refer to the Protegrity Installation.
4.6.6 - Uninstalling Cluster Services
If there is cluster with a maximum of ten nodes and you do not want to continue with the integrated cluster services, then uninstall the cluster services.
To uninstall cluster services:
Remove the appliance from the TAC.
In the CLI Manager, navigate to Administration > Add/Remove Services.
Press ENTER.
Enter the root password and select OK.
Select Remove already installed applications.
Select Cluster-Consul-Integration v1.0.0 and select OK.
The integration service is uninstalled.
Select Consul v2.4.0 and select OK.
The Consul product is uninstalled from your appliance.
If the node contains scheduled tasks associated with it, then you cannot uninstall the cluster services on it. Ensure that you delete all the scheduled tasks before uninstalling the cluster services.
4.6.7 - FAQs on TAC
This section lists the FAQs on TAC.
| Question | Answer |
|---|---|
| Can I block communication between appliances? | No. Blocking communication between appliances is disabled from release v7.1.0 MR2. |
| What is the recommended minimum quorum of servers required in a cluster? | The recommended minimum quorum of servers required in a cluster is three. |
| How to determine which appliance is the leader of the cluster? | In the OS Console of an appliance, run the following command:/usr/local/consul operator raft list-peers -http-addr https://localhost:9000 -ca-file /opt/consul/ssl/ca.pem -client-cert /opt/consul/ssl/cert.pem -client-key /opt/consul/ssl/cert.key |
| Can I change the certificates of an appliance that is added to a cluster? | Yes. Ensure that the certificates are valid. For more information about the validity of the certificates, refer here. |
| Can I remove the last server from the cluster? | No, you cannot remove the last server from the cluster. The clients depend on this server for cluster related information. If you remove this server, then you risk de-stabilizing the cluster. |
| How to determine the role of an appliance in a cluster? | In the Web UI, navigate to the Trusted Appliance Cluster. On the screen, the labels for the appliances appear. The label for the server is Consul Server and that of the client is Consul Client. |
| Can I add an appliance other than ESA as server? | Yes. Ensure that the value of the type attribute in the agent.json file under the /opt/cluster-consul-integration/configure directory is set as server. |
| Can I clone a machine and join it to the cluster? | Yes, you can clone a machine to join in the cluster.However, if you are using cloned machines to join a cluster, it is necessary to rotate the keys on all cloned nodes before joining the cluster. If the cloned machines have proxy authentication, two factor authentication, or TAC enabled, it is recommended to use new machines. This avoids any limitations or conflicts, such as, inconsistent TAC, mismatched node statuses, conflicting nodes, and key rotation failures due to keys in use. |
| For more information about rotating the keys, refer here. |
4.6.8 - Creating a TAC using the Web UI
You can create a TAC, where you add an appliance to the cluster.
Before you begin
When setting up or adding appliances to your cluster, you may be required to request a license for new nodes from Protegrity.
For more information about licensing, refer to the Protegrity Data Security Platform Licensing and your license agreement with Protegrity.
Before creating a TAC, ensure that the SSH Authentication type is set to Password + PublicKey.
If you are using cloned machines to join a cluster, it is necessary to rotate the keys on all cloned nodes before joining the cluster.
If the cloned machines have proxy authentication, two factor authentication, or TAC enabled, it is recommended to use new machines. This avoids any limitations or conflicts, such as, inconsistent TAC, mismatched node statuses, conflicting nodes, and key rotation failures due to keys in use.
For more information about rotating the keys, refer here.
Creating a TAC
In the ESA Web UI, navigate to System > Trusted Appliances Cluster.
The Join Cluster screen appears.
Select Create a new cluster.
The following screen appears.

Select the preferred communication method.
Select Add New to add, edit, or delete a communication method.
For more information about managing communication methods, refer here.
Click Save.
A cluster is created.
4.6.9 - Connection Settings
In a TAC, you can create a partially connected cluster using the Connecting Setting feature. In a partially connected cluster, the nodes selectively communicate with other nodes in the cluster without disconnecting the graph. If you want to avoid redundant information between certain nodes in the cluster, you can block the direct communication between them.
This feature is only supported if the Cluster-Consul-Integration and Consul components are not installed on your system.
The following figure shows a partially connected cluster connected graph with four nodes, where the nodes selectively communicate with some nodes in the cluster.

As shown in the figure, the direct communication between nodes C and D, A and D, B and C are blocked. If node B requires information about node C, it receives information from node A. The cluster is a fully connected graph where you can communicate directly or indirectly with every node in the cluster.
In a disconnected graph, there is no communication path between one node and other nodes in the cluster. You cannot create a TAC with a disconnected graph.
In a partially connected cluster, as some nodes are not connected to each other directly, there might be a delay in propagating data, depending on the path that the data needs to traverse.
Connection Settings for Nodes
This section describes the steps to set the connection settings for nodes in a cluster.
To set connection settings for nodes in the cluster:
In the CLI Manager, navigate to Tools > Trusted Appliances Cluster > Connection Management: Set connection settings for cluster nodes.
The following screen appears.

Select the required node in the cluster.
Select Choose.
The list of connection settings between the node and other nodes in the cluster appears.

Press SPACEBAR to toggle the connection setting for a particular node.
Select Apply.
The connection settings for the node are saved.
Caution: You can only create cluster export tasks between nodes that are directly connected to each other.
4.6.10 - Joining an Existing Cluster using the Web UI
If your appliance is not a part of any trusted appliances cluster, then you can add it to an existing cluster. This section describes the steps to join a TAC using the Web UI.
Before you begin
If you are using cloned machines to join a cluster, it is necessary to rotate the keys on all cloned nodes before joining the cluster.
If the cloned machines have proxy authentication, two factor authentication, or TAC enabled, it is recommended to use new machines. This avoids any limitations or conflicts, such as, inconsistent TAC, mismatched node statuses, conflicting nodes, and key rotation failures due to keys in use.
For more information about rotating the keys, refer here.
Important : When assigning a role to the user, ensure that the Can Create JWT Token permission is assigned to the role.If the Can Create JWT Token permission is unassigned to the role of the required user in the target node, then joining the cluster operation fails.To verify the Can Create JWT Token permission, from the ESA Web UI navigate to Settings > Users > Roles.
Adding to an existing cluster
On the ESA Web UI, navigate to System > Trusted Appliances Cluster.
The following screen appears.

Enter the IP address of the target node in the Node text box.
Enter the credentials of the user of the target node in the Username and Password text boxes.
Click Connect.
The Site drop-down list and the Communication Methods options appear.
If you need to add a new communication method, click Add New. Otherwise, continue on to the next step.
Select the site and the preferred communication method.
Click Join.
The node is added to the cluster and the following screen appears.

Handling Consul certificates after adding an appliance to the cluster
After joining an appliance to the cluster, during replication, the Consul certificates are copied from the source to the target appliance. In this case, it is recommended to delete the Consul certificates pertaining to the target node from the Certificate Management screen. Navigate to Settings > Network > Certificate Repository. Click the delete icon next to Server certificate and key for Consul.

4.6.11 - Managing Communication Methods for Local Node
Every node in a network is identified using a unique identifier. A communication method is a qualifier for the remote nodes in the network to communicate with the local node.
There are two standard methods by which a node is identified:
- Local IP Address of the system (ethMNG)
- Host name
The nodes joining a cluster use the communication method to communicate with each other. The communication between nodes in a cluster occur over one of the accessible communication methods.
Adding a Communication Method from the Web UI
This section describes the steps to add a communication method from the Web UI.
In the Web UI, you can add a communication method only before creating a cluster. Perform the following steps to add a communication method from the Web UI.
In the Web UI, navigate to System > Trusted Appliances Cluster.
The Join Cluster Screen appears.
Click Create a new Cluster.
Click Create.
Click Add New.
The Add Communication Method text box appears.
Type the communication method and select OK.
The communication method is added.
Editing a Communication Method from the Web UI
This section describes the steps to edit a communication method from the Web UI.
In the Web UI, you can edit a communication method only before you create a cluster. Perform the following steps to edit a communication method from the Web UI.
In the Web UI, navigate to System > Trusted Appliances Cluster.
The Join Cluster Screen appears.
Click Create a new Cluster.
The Create New Cluster screen appears.
Click Create.
Click the Edit
 icon corresponding to the communication method to be edited.
The Edit Communication Method text box appears.
Type the communication method and select OK.
The communication method is edited.
Deleting a Communication Method from the Web UI
This section describes the steps to delete a communication method from the Web UI.
To delete a communication method from the Web UI:
In the Web UI, navigate to System > Trusted Appliances Cluster.
The Join Cluster Screen appears.
In the Web UI, you can delete a communication method before you create a cluster.
Click Create New Cluster.
The Create New Cluster screen appears.
Click Create.
Click the Delete
 icon corresponding to the communication method to be deleted.
A message confirming the delete operation appears.
Select OK.
The communication method is deleted.
4.6.12 - Viewing Cluster Information
This section describes the how to view cluster information using the Web UI.
To execute commands using Web UI:
In the Web UI, navigate to System > Trusted Appliances Cluster .
The screen with the appliances connected to the cluster appears.
Select All in the drop-down list.
The following options appear:
- Node Summary
- Cluster Tasks
- DiskFree
- MemoryFree
- Network
- System Info
- Top 10 CPU
- Top 10 Memory
- All
Select the required option.
The selected information for the appliances appears in the right pane.
4.6.13 - Removing a Node from the Cluster using the Web UI
This section describes the steps to remove a node from a cluster using the Web UI.
Before you begin
If a node is associated with a cluster task that is based on the hostname or IP address, then the Leave Cluster operation will not remove node from the cluster. Ensure that you delete all such tasks before removing any node from the cluster.
Removing the node
On the Web UI of the node that you want to remove from the cluster, navigate to System > Trusted Appliances Cluster.
The screen displaying the cluster nodes appears.
Navigate to Management > Leave Cluster.
The following screen appears.

A confirmation message appears.
Select Ok.
The node is removed from the cluster.
Scheduled tasks and removed nodes
If the scheduled tasks are created between the nodes in a cluster, then ensure that after you remove a node from the cluster, all the scheduled tasks related to the node are disabled or deleted.
4.7 - Appliance Virtualization
The default installation of Protegrity appliances use hardware virtualization mode (HVM). An appliance can be reconfigured to use parallel virtualization mode (PVM) to optimize the performance of virtual guest machines. Protegrity supports the following virtual servers:
- Xen
- Microsoft Hyper-VP
- Linux KVM Hypervisor
The information in this section will provide details on appliance virtualization. Understanding some of the instructions and details will require some Xen knowledge and technical skills. The virtual server configuration is done with its own tools. The examples shown later in this section are for using paravirtualization with Xen. Xen hypervisor is a thin software layer that is inserted between the server hardware and the operating system. This provides an abstraction layer that allows each physical server to run one or more virtual servers, effectively decoupling the operating system and its applications from the underlying physical server. Xen hypervisor changes are facilitated by the Xen Paravirtualization Tool.
For more information about Xen, and Xen hypervisor, refer http://www.xen.org/.
About switching from HVM to PVM
This section will also show how to switch from HVM to PVM. The following two main tasks are involved:
- Configuration changes on the guest machine, the appliance.
- Configuration changes on the virtual server.
The appliance configuration changes are facilitated by the Xen Paravirtualization tool, which is available in the appliance Tools menu, in the CLI Manager.
4.7.1 - Xen Paravirtualization Setup
This section describes the paravirtualization process, from preparation to running the tools and rebooting into PVM mode.
The paravirtualization tool provides an easy way to convert HVM to PVM and back again. It automates changes to configuration files and XenServer parameter.
This section describes the actual configuration changes on both the Appliance and XenServer in case you need or want to understand the low-level mechanisms involved.
Before you begin
It is recommended that you consult Protegrity Support before using the information in this Technical Reference section to manually change your configurations.
4.7.1.1 - Pre-Conversion Tasks
Before switching from HVM to PVM you should perform a system check, interface check, and system backup.
System Check
The Protegrity software appliance is installed with HVM. This means the appliance operating system does not know that it is running on a hypervisor.
To check the system:
Use the following Linux command to check whether the Linux kernel supports paravirtualization and examine the hypervisor.
# dmesg | grep –i bootIf the following message does not appear, then the kernel does not support paravirtualization:
Booting paravirtualized kernelThe rest of the output shows the hypervisor name, for example, Xen. If you are running on a physical hardware, or the hypervisor was not configured to use PVM, then the following output appears:
bare hardware
Interface Check
The conversion tools and tasks assume that the Protegrity Appliance virtual hard disk is using the IDE interface, which is the default interface. Check that the device name used by the Linux Operating System is hda, and not sda or other devices.
System Backup
Switching from HVM to PVM requires changes in many configuration files, so it is very important to back up the system before applying the changes. Use the XenServer snapshot functionality to back up the system.
For more information about the snapshot functionality, refer to the XenServer documentation.
It is also recommended that you back up the appliance data and configuration files using the standard appliance backup mechanisms.
For more information about backing up from CLI Manager, refer here.
Managing local OS user option provides you the ability to create users that need direct OS shell access. These users are allowed to perform non-standard functions, such as schedule remote operations, backup agents, run health monitoring, etc. This option also lets you manage passwords and permissions for the dpsdbuser, which is available by default when ESA is installed.
Managing Local OS Users
This section describes the steps to manage the local OS users.
To manage local OS users:
Navigate to Administration > Accounts and Passwords > Manage Passwords and Local-Accounts > Manage local OS users.
In the dialog displayed, enter the root password and confirm selection.
Add a new user or select an existing user as explained in following steps.
Select Add to create a new local OS user.
In the dialog box displayed, enter a User name and Password for the new user. The & character is not supported in the Username field.
Confirm the password in the required text boxes.
Select OK and press Enter to save the user.
Select an existing user from the list displayed.
- You can select one of the following options from the displayed menu.
Options Description Procedure Check password Validate entered password. In the dialog box displayed, enter the password for the local OS user. AValidation succeededmessage appears.Update password Change password for the user. - In the dialog box displayed, enter the Old password for the local OS user.This step is optional.
- Enter the New Password and confirm it in the required text boxes.
Update shell Define shell access for the user. In the dialog box displayed, select one of the following options: - No login access
- Linux Shell -
/bin/sh - Custom
Note: The default shell is set as No login access (/bin/false).Toggle SSH access Set SSH access for the user. Select the Toggle SSH access option and press Enter to set SSH access to Yes. Note: The default is set as No when a user is created.Delete user Delete the local OS user and related home directory. Select the Delete user option and confirm the selection.
Select Close to exit the option.
Backup and Restore
If you backed up the OS in HVM/PVM mode, then you will be able to restore only in the mode in which you backed it up. For more information about backing up from the Web UI, refer to section Working with Backup and Restore.
4.7.1.2 - Paravirtualization Process
There are several tasks you must perform to switch from HVM to PVM.
The following figure shows the overall task flow.

The installed Appliance comes with the Appliance Paravirtualization Support Tool, which is equipped with the following:
- Displays the current paravirtualization status of the appliance.
- Displays Next Boot paravirtualization status of the appliance.
- Converts from HVM to PVM and back again.
- Connects to the XenServer and configures the Xen hypervisor for HVM or PVM.
Starting the Appliance Paravirtualization Support Tool
You can use Appliance Paravirtualization Support Tool to configure the local appliance for PVM.
To start the Appliance Paravirtualization Support Tool:
Access the ESA CLI Manager.
Navigate to Tools > Xen ParaVirtualization screen.
The root permission is required for entering the tool menu.
When you launch the tool, the main screen shows the current system status and provides options for managing virtualization.

Enabling Paravirtualization
When you convert your appliance to PVM mode, the internal configuration is modified and the Next Boot status changes to support paravirtualization. Both virtual block device and virtual console support is enabled as well.
To enable Paravirtualization:
To enable PVM on the appliance, you need to configure both XenServer and the appliance.
You can configure XenServer in two ways:
- Copy the tool to the XenServer and execute it locally, not using the appliance.
- Execute the commands manually using the
xecommand of Xen console.
To configure the local appliance for PVM from the Appliance Paravirtualization Support Tool main screen, select Enable paravirtualization settings.
The status indicators in the Next boot configuration section of the main screen change from Disabled to Enabled.
Configuring Host for PVM
To configure the Host for PVM, you need to have access to the XenServer machine.
Once the local Appliance is configured to use PVM, you connect to the XenServer to run the Xen ParaVirtualization Support Tool. This configures changes on the Xen hypervisor so that it runs in Host PVM mode. You will be asked for a root password upon launching the tool.
The following figure shows the main screen of the Xen Paravirtualization Support Tool.

To configure the Host for PVM:
From the Appliance ParaVirtualization Support Tool main screen, select Connect to XenServer hypervisor and execute tool.
Select OK.
The XenServer hypervisor interface appears.
At the prompt, type the IP or host name of the XenServer.
Press ENTER.
At the prompt, type the user name for SCP/SSH connection.
Press ENTER.
At the prompt, type the password to upload the file.
Press ENTER.
The tool is uploaded to the
/tmpdirectory.At the prompt, type the password to remotely run the tool.
Press ENTER.
An introduction message appears.
At the prompt, type the name of the target virtual machine.
Alternatively, press ENTER to list available virtual machines.
The Xen ParaVirtualization Support Tool Main Screen appears and shows the current virtual machine information and status.
Type 4 to enable paravirtualization settings.
Press ENTER.
The following screen appears.

At the prompt, type Y to save the configuration.
Press ENTER.
You can use option 3 to back up the entries that will be modified.
The backup is stored in the /tmp directory on the XenServer machine as a rollback script that can be executed later on to revert the configuration back from PVM to HVM.Type q to exit the Appliance Paravirtualization Support Tool.
Rebooting the Appliance for PVM
After configuring the appliance and the Host for PVM, the appliance must be restarted. When it restarts, it will come up and run in PVM mode.
Before you begin
Before rebooting the appliance:
Exit both local and remote Paravirtualization tools before rebooting the appliance.
In the PVM, the system might not boot if there are two bootable devices. Be sure to eject any bootable CD/DVD on the guest machine.
If you encounter console issues after reboot, then close the XenCenter and restart a new session.
Booting into System Restore mode
You cannot boot in the System Restore mode when in the Xen Server PVM mode, because it does not show up during appliance launching and appears only if you have previously backed up the OS. However, you can boot in the System Restore mode when in the Xen Server HVM mode.
How to reboot the appliance for PVM
To reboot appliance for PVM:
To reboot the appliance for PVM, navigate to Administration > Reboot and Shutdown > Reboot.
Restart the Appliance Paravirtualization Support Tool and check the main screen to verify the current mode.
Disabling Paravirtualization
To disable Paravirtualization:
To revert the appliance back to HVM, you need to disable paravirtualization on the guest appliance OS and on the XenServer.
To return the appliance to HVM, use the Disable Paravirtualization Settings option, available in the Appliance Paravirtualization Support Tool.
The status indicators in the Next boot configuration section on the main screen change from Enabled to Disabled.
To return the XenServer to HVM, perform one of the following tasks to revert the XenServer configuration to HVM:
If… Then… You backed up the XenServer configuration by creating a rollback script while switching from HVM to PVM, using option 3 on the Xen Paravirtualization Support Tool Execute the rollback script. You want to use the Xen Paravirtualization Support Tool Use the Xen Paravirtualization Support Tool to connect to the XenServer, and then type 5 to select Disable paravirtualization Setting (enable HVM). For more information about connecting to the XenServer, refer to section Configure Host for PVM. You want to perform a manual conversion Manually convert from PVM to HVM. For more information about converting from PVM to HVM, refer to section Manual Configuration of Xen Server.
4.7.2 - Xen Server Configuration
This section describes about configuring the Xen Server.
Appliance Configuration Files for PVM
The following table describes the appliance configuration files that are affected by the appliance Xen Paravirtualization tool.
| File Name | Description | HVM | PVM |
|---|---|---|---|
| /boot/grub/menu.lst | Boot Manager. The root partition is affected and the console parameters. | root=/dev/hda1 | root=/dev/xvda1 console=hvc0 xencons=hvc0 |
| /etc/fstab | Mounting table | Using the hda device name (/dev/hda1,/dev/hda2,…) | Using the xvda device-name (/dev/xvda1,…) |
| /etc/inittab | Console | tty1 | hvc0 |
Xen Server Parameters for PVM
This section lists the Xen Server Parameters for PVM.
The following settings are affected by the Appliance Paravirtualization Support Tool.
| Parameter Name | Description | HVM | PVM |
|---|---|---|---|
| HVM-boot-policy | VM parameter: boot-loader | BIOS Order | “” (empty) |
| PV-bootloader | VM Parameter: paravirtualization loader | “” (empty) | Pygrub |
| Bootable | Virtual Block Device parameter | false | “true” |
Manual Configuration of Xen Server
This section describes about configuring the Xen Server manually.
It is recommended that you use the Xen Paravirtualization Support Tool to switch between HVM and PVM. However, you sometimes might need to manually configure the XenServer. This section describes the commands you use to switch between the two modes.
It is recommended that you consult Protegrity Support before manually applying the commands. Back up your data prior to configuration changes. Read the XenServer documentation to avoid errors.
Converting HVM to PVM
This section describes the steps to convert HVM to PVM.
To convert HVM to PVM use the following commands to convert from HVM to PVM, where NAME_OF_VM_MACHINE is the name of the virtual machine.
```
TARGET_VM_NAME="NAME_OF_VM_MACHINE"
TARGET_VM_UUID=$(xe vm-list name-label="$TARGET_VM_NAME" params=uuid --minimal)
TARGET_VM_VBD=$(xe vm-disk-list uuid=$TARGET_VM_UUID | grep -A1 VBD | tail -n 1 | cut -f2 - | sed "s/ *//g")
xe vm-param-set uuid=$TARGET_VM_UUID HVM-boot-policy=""
xe vm-param-set uuid=$TARGET_VM_UUID PV-bootloader="pygrub"
xe vbd-param-set uuid=$TARGET_VM_VBD bootable="true"
```
Converting PVM to HVM
This section describes the steps to convert PVM to HVM.
To convert PVM to HVM use the following commands to convert from PVM to HVM, where NAME_OF_VM_MACHINE is the name of the virtual machine.
```
TARGET_VM_NAME="NAME_OF_VM_MACHINE"
TARGET_VM_UUID=$(xe vm-list name-label="$TARGET_VM_NAME" params=uuid --minimal)
TARGET_VM_VBD=$(xe vm-disk-list uuid=$TARGET_VM_UUID | grep -A1 VBD | tail -n 1 | cut -f2 - | sed "s/ *//g")
xe vm-param-set uuid=$TARGET_VM_UUID HVM-boot-policy="BIOS order"
xe vm-param-set uuid=$TARGET_VM_UUID PV-bootloader=""
xe vbd-param-set uuid=$TARGET_VM_VBD bootable="false"
```
4.7.3 - Installing Xen Tools
Protegrity uses Xen tools to enhance and improve the virtualization environment with better management and performance monitoring. The appliance is a hardened machine, so you must send the Xen tools (.deb) package to Protegrity. In turn, Protegrity provides you with an installable package for your Xen Server environment. You must upload the package to the appliance and install it from within the OS Console.
To install Xen tools:
Mount the Xen tools CDROM to the guest machine:
Using the XenCenter, mount the XenTools (xs-tools.iso file) as a CD to the VM.
Log in to the appliance, and then switch to OS Console.
To manually mount the device, run the following command:
# Mount /dev/xvdd /cdrom
Copy the XEN tools .deb package to your desktop machine. You can do that:
Using scp to copy the file to a Linux machine, for example:
# scp –F /dev/null /cdrom/Linux/*_i386.de YOUR_TARGET_MACHINE:/tmpUsing Web UI, download the following package:
# ln –s /cdrom/Linux /var/www/xentoolsDownloading the file from https://YOUR_IP/xentools.
When you are done, delete the soft link (/var/www/xentools).
Send the xe-guest-utilities_XXXXXX_i386.deb file to Protegrity.
Protegrity will provide you with this package in a .tgz file.
Upload the package to the appliance using the Web UI.
Extract the package and execute the installation:
# cd /products/uploads
# tar xvfz xe-guest-utilities_XXXXX_i386.tgz
# cd xe-guest-utilities_XXXXX_i386
# ./install.sh
Unmount the /cdrom on the appliance.
Eject the mounted ISO.
Reboot the Appliance to clean up references to temporary files and processes.
4.7.4 - Xen Source – Xen Community Version
Unlike XenServer, which provides an integrated UI to configure the virtual machines, Xen Source® does not provide one. Therefore, the third step of switching from HVM to PVM must be done manually by changing configuration files.
This section provides examples of basic Xen configuration files that you can use to initialize Protegrity Appliance on Xen Source hypervisor.
For more information about Xen Source, refer to Protegrity Support, Xen Source documentation, and forums.
HVM Configuration
The following commands are used to manually configure the appliance for full virtualization.
import os, re
arch_libdir = 'lib'
arch = os.uname()[4]
if os.uname()[0] == 'Linux' and re.search('64', arch):
arch_libdir = 'lib64'
kernel = "/usr/lib/xen/boot/hvmloader"
builder='hvm'
boot="cda"
memory = 1024
name = "ESA"
vif = [ 'type=ioemu, bridge=xenbr0' ]
disk = [ 'file:/etc/xen/ESA.img,hda,w', 'file:/media/ESA.iso,hdc:cdrom,r' ]
device_model = '/usr/' + arch_libdir + '/xen/bin/qemu-dm'
sdl=0
opengl=0
vnc=1
vncunused=0
vncpasswd=''
stdvga=0
serial='pty'
PVM Configuration
The following commands are used to manually configure the appliance for paravirtualization.
kernel = "/usr/lib/xen/boot/pv-grub-x86_64.tgz"
extra = "(hd0,0)/boot/grub/menu.lst"
memory = 1024
name = "ESA"
vif = [ 'bridge=xenbr0' ]
disk = [ 'file:/etc/xen/ESA.img,xvda,w']
#vfb = [ 'vnc=1' ]# Enable this for graphical GRUB splash-screen
Modify the configuration file names, locations, and resources to suit your own environment and requirements.
Virtual Appliance
Create a new (minimum) virtual appliance on XEN Source after creating the configuration files as /etc/xen/ESA.hvm.cfg and /etc/xen/ESA.pv.cfg.
# xm info
# dd if=/dev/zero of=/etc/xen/ESA.img bs=1 count=1 seek=15G
# xm create –c /etc/xen/ESA.hvm.cfg
… Install machine… configure PVM …
# xm shutdown ESA
# xm create –c /etc/xen/ESA.pv.cfg
Paravirtualization FAQ and Troubleshooting
This section lists some Paravirtualization Frequently Asked Questions and Answers.
| Frequently Asked Questions | Answers |
| Why are XenTools not provided with the appliance? | In addition to the distribution issues, the XenTools depends on the exact version of your XenServer. |
| I cannot boot the virtual machine in PVM mode. | Ensure that no CD/DVD (ISO image) is inserted to the
machine. Eject all CD/DVDs, and then reboot. Make sure that PVM
is enabled on the hypervisor itself. For more information
about PVM, refer to section Manual Configuration of Xen Server. The
last resort would be to use a Live-CD, for example, Knoppix, in
order modify the appliance files. |
| I cannot initialize High-Availability. | Probably you have installed the XenTools but you have not rebooted the system after the XenTools installation. Reboot the system and retry. |
| I need to set up a cloned virtual machine as soon as possible. | Currently cloning a virtual appliance is a risk which is
not recommended. Perform the following steps. 1. 2.
|
| After switching to PVM mode, I cannot use the XenCenter. | Close the XenCenter and open a new instance. |
4.8 - Appliance Hardening
The Protegrity Appliance provides the framework for its appliance-based products. The base Operating System (OS) used for Protegrity Appliances is Linux, which provides the platform for Protegrity products. This platform includes the required OS low-level components as well as higher-level components for enhanced security management. Linux is widely accepted as the preferred base OS for many customized solutions, such as in firewalls and embedded systems, among others.
Linux was selected for the following reasons:
- Open Source: Linux is an Open Source solution.
- Stable: The OS is a stable platform due to its R&D and QA cycles.
- Customizable: The OS can be customized up to a high level.
- Proven system: The OS has already been proven in many production environments and systems.
For a list of installed components, refer to the Contractual.htm document available in the Web UI under Settings > System > Files pane.
Protegrity takes several measures to harden this Linux-based system and make it more secure. For example, many non-essential packages and components are removed. If you want to install external packages on the appliances, the packages must be certified by Protegrity.
For more information about installing external packages, contact Protegrity Support.
The following additional hardening measures are described in this section:
- Linux Kernel
- Restricted Logins
- Enhances Logging
- Open Listening TCP Ports
- Packages and Services
Several major components, services, or packages are disabled or removed for appliance hardening. The following table lists the removed packages.
| Removed Object | Examples |
|---|---|
| Network Services (except SSH/Apache) | telnet client/server client/server |
| Package Managers | apt |
| Additional Packages | Man Pages Documents |
Appliance Hardening
The appliance kernels are optimized for hardening. The Protegrity appliances are currently equipped with a modular patched Linux Kernel version 4.9.38. These kernel are patched to enhance some capabilities as well as optimize it for server-side usage. Standard server-side features such as scheduler and TCP settings are available.
Logging in
Restricted Log in
Every Protegrity Appliance is equipped with an internal LDAP directory service, OpenLDAP. Appliances may use this internal LDAP for authentication, or an external one.
The ESA Server provides directory services to all the other appliances. However, to avoid single point of failure you can use multiple directory services.
Four users are predefined and available after the appliance is installed. Unlike in standard Linux, the root user is blocked and cannot access the system without permission from the admin user. The admin user cannot access the Linux Shell Console without permission from the root user. This design provides extra security to ensure that in order to perform any OS-related or security-related operations, both root and admin users must cooperate. The operations include upgrade, and patches. The same design applies to SSH connectivity.
The main characteristics of the four users are described here.
root user
- Local OS user.
- By default, can only access machine’s console.
- All other access requires additional admin user login to ensure isolation of duties.
- If required, then login using SSH can be allowed, which is blocked by default.
- No Web UI access.
admin user
- LDAP directory management user.
- Usually this user is the Chief Security Officer.
- Can access and manage Web UI or CLI menu using machine’s console or SSH.
- Can create additional users.
- If required, then root user login for OS related activities can be allowed.
viewer user
- LDAP directory user.
- By default, has read-only access to Appliance features.
- Can access Web UI and CLI menu using machine’s console or SSH but cannot modify settings/server.
local_admin user
- Local OS user.
- Emergency or maintenance user with limited admin user permission.
- Handles cases where the directory server is not accessible.
- By default, the Web UI is blocked and only the machine’s console is accessible.
- By default, the SSH permission is enabled.
The appliance login design facilitates appliance hardening. The following two OS users are defined:
- root: The standard system administrator user.
- local_admin: Administrative OS user for maintenance, in case the LDAP is not accessible.
By default, the Web UI is blocked, and only machine’s console is accessible.
These are the basic login rules:
- The root user will never be able to login directly.
- The admin user can connect to the CLI Manager, locally or through SSH.
- A root shell can be accessed from within the admin CLI Manager.
Enhanced Log in
The logging capabilities are enhanced for appliance hardening. In addition to the standard OS logs or syslogs that are available by default, many other operations are logged as well.
Logs that are considered important are sent to the Protegrity ESA logging facility, which can be local or remote. This means that in addition to the standard syslog repository, Protegrity provides a secured repository for important system logs.
You can find these events from within the logs that are escalated to the ESA logging facility:
- System startup logs
- Protegrity product or service is started or stopped
- System backup and restore operations
- High Availability events
- User logins
- Configuration changes
Configuring user limits
In Linux, a user utilizes the system resources to perform different operations. When a user with minimal privileges runs operations that use most system resources, it can result in the unavailability of resources for other users. This introduces a Denial-of-Service (DoS) attack on the system. To mitigate this attack, you can restrict users or groups utilizing the system resources. For Protegrity appliances, using the ulimit functionality, you can limit the number of processes that a user can create.
The ulimit functionality cannot be applied on usernames that contain the space character.
While using protectors below version 10.x, if the number of protectors are more than 300, then the ulimit must be increased.
Warning: Increasing the ulimit might have negative consequences on the environment. In such cases, it must be handled with the load balancers.
Increasing the ulimit
Perform the following steps to increase the ulimit:
Log in to the ESA CLI Manager.
Navigate to Administration > OS Console.
Enter root password.
Navigate to /etc/security/limits.conf file.The following content appears.
#*               soft    core            0
#root            hard    core            100000
#*               hard    rss             10000
#@student        hard    nproc           20
#@faculty        soft    nproc           20
#@faculty        hard    nproc           50
#ftp             hard    nproc           0
#ftp             -       chroot          /ftp
#@student        -       maxlogins       4

# End of file
*       hard    core    0
#PTY-39608 - ulimit open files needs to be increased for apache process in appliances
*         -       nofile          16384
root soft nofile 65536
root hard nofile 65536
Navigate to the following line to change the ulimit for all users.
* - nofile 16384Change the ulimit value from 16384 to 65536.
Save the file and exit.
To verify the updated ulimit ensure to disconnect the current session and perform the steps to verify the ulimit using a new session.
Verifying the ulimit
Perform the following steps to verify the ulimit:
- Log in to the ESA CLI Manager.
- Navigate to Administration > OS Console.
- Enter root password.
- Verify the ulimit using the following command.
ulimit -a - Verify the value of the following parameter.The updated ulimit appears.
open files (-n) 65536
4.8.1 - Open listening ports
Network ports serve as communication channels that allow information to flow from one system to another. This section provides a list of ports that must be configured in your environment to access the features and services on Protegrity appliances.
For more information about Protegrity products and various components, refer Glossary.
Ports for accessing ESA
The following is the list of ports that must configured for the system users to access ESA.
| Port Number | Protocol | Source | Destination | NIC | Description |
|---|---|---|---|---|---|
| 22 | TCP | System User | ESA | Management NIC (ethMNG) | Access to CLI Manager |
| 443 | TCP | System User | ESA | Management NIC (ethMNG) | Access to Web UI for Security Officer or ESA administrator |
| 443 | TCP | DevOps User | ESA | Management NIC (ethMNG) | Initiating Protegrity REST API requests.For example,
|
Ports for accessing Protectors
The following is the list of ports that must be configured between the ESA and the non-appliance based protectors such as, Big Data Protector (BDP), Application Protector (AP), and so on.
Port Number | Protocol | Source | Destination | NIC | Description |
8443 | TCP | All Protectors | Service Dispatcher in ESA | Management NIC (ethMNG) |
|
25400 | TCP | Version 10.0.x dynamic protectors | Resilient Package Proxy (RPP) in the ESA | Management NIC (ethMNG) | Downloading certificates and packages from the ESA via the RPP service in the ESA. |
| 9200 | TCP | Log Forwarder service on the machine | Insight Nginx in ESA | Management NIC (ethMNG) of ESA | To send audit logs received from the Log Server and forward it to Insight in the ESA. |
Ports for ESA on TAC
The following is the list of ports that must be configured for the ESA appliances in a Trusted Appliances Cluster (TAC).
Port Number | Protocol | Source | Destination | NIC | Description | Notes (If any) |
22 | TCP | Primary ESA | Secondary ESA | Management NIC (ethMNG) | Communication in TAC | |
22 | TCP | Secondary ESA | Primary ESA | Management NIC (ethMNG) | Communication in TAC | |
443 | TCP | Primary ESA | Secondary ESA | Management NIC (ethMNG) | Communication in TAC | |
443 | TCP | Secondary ESA | Primary ESA | Management NIC (ethMNG) | Communication in TAC | |
10100 | UDP | Primary ESA | Secondary ESA | Management NIC (ethMNG) | Communication in TAC | This port is optional. If the appliance heartbeat services are stopped, this port can be disabled. |
10100 | UDP | Secondary ESA | Primary ESA | Management NIC (ethMNG) | Communication in TAC | This port is optional. If the appliance heartbeat services are stopped, this port can be disabled. |
8300 | TCP | Primary ESA | Secondary ESA | Management NIC (ethMNG) | Used by servers to handle incoming request. | This port allows internal communication between Consul server nodes. |
8300 | TCP | Secondary ESA | Primary ESA | Management NIC (ethMNG) | Handle incoming requests | This is used by servers to handle incoming requests from other consul agents. |
8301 | TCP and UDP | Primary ESA | Secondary ESA | Management NIC (ethMNG) | Gossip on LAN. | This is used to handle gossip in the LAN. Required by all consul agents. |
8301 | TCP and UDP | Secondary ESA | Primary ESA | Management NIC (ethMNG) | Gossip on LAN. | This is used to handle gossip in the LAN. Required by all consul agents. |
8302 | TCP and UDP | Primary ESA | Secondary ESA | Management NIC (ethMNG) | Gossip on WAN. | This is used by consul servers to gossip over the WAN, to other servers. As of Consul 0.8 the WAN join flooding feature requires the Serf WAN port (TCP/UDP) to be listening on both WAN and LAN interfaces. |
8302 | TCP and UDP | Secondary ESA | Primary ESA | Management NIC (ethMNG) | Gossip on WAN. | This is used by consul servers to gossip over the WAN, to other servers. As of Consul 0.8 the WAN join flooding feature requires the Serf WAN port (TCP/UDP) to be listening on both WAN and LAN interfaces. |
8600 | TCP and UDP | ESA | DSG | Management NIC (ethMNG) | Listens to the DNS server port. | Used to resolve DNS queries. |
8600 | TCP and UDP | DSG | ESA | Management NIC (ethMNG) | Listens to the DNS server port. | Used to resolve DNS queries. |
Additional Ports
Based on the firewall rules and network infrastructure of your organization, you must open ports for the services listed in the following table.
| Port Number | Protocol | Source | Destination | NIC | Description | Notes (If any) |
| 25 | TCP | ESA | SMTP Server | Management NIC (ethMNG) of ESA | To configure the email server. | Default port for SMTP server. |
| 123 | UDP | ESA | Time servers | Management NIC (ethMNG) of ESA | NTP Time Sync Port | This port can be configured based on the enterprise network policies or according to your use case. |
| 389 | TCP | ESA | Active Directory server | Management NIC (ethMNG) of ESA |
| This port can be configured based on the enterprise network policies or according to your use case. |
| 636 | TCP | ESA | Active Directory server | Management NIC (ethMNG) of ESA |
| This port is for LDAPS. It can be configured based on the enterprise network policies or according to your use case. |
| 1812 | TCP | ESA | RADIUS server | Management NIC (ethMNG) of ESA | Authentication with RADIUS server. | This port can be configured based on the enterprise
network policies or according to your use case. |
| 514 | UDP | ESA | Syslog servers | Management NIC (ethMNG) of ESA | Storing logs | This port can be configured based on the enterprise network policies or according to your use case. |
| 15780 | TCP | AIX Protector | Machine where Log Forwarder is installed. | ManagementNIC (ethMNG) | Forwarding logs from the AIX Protector to the Log Forwarder. | |
| FutureX (9111) | TCP | ESA | HSM server | Management NIC (ethMNG) of ESA | HSM communication | This port can be configured based on the enterprise network policies or according to your use case. |
| Safenet (1792) | TCP | ESA | HSM server | Management NIC (ethMNG) of ESA | HSM communication | This port must be opened and configured based on the enterprise network policies or according to your use case. |
| nCipher non-privileged port (8000) | TCP | ESA | HSM sever | Management NIC (ethMNG) of ESA | HSM communication | This port must be opened and configured based on the enterprise network policies or according to your use case. |
| nCipher privileged port (8001) | TCP | ESA | HSM server | Management NIC (ethMNG) of ESA | HSM communication | This port must be opened and configured based on the enterprise network policies or according to your use case. |
| Utimaco (288) | TCP | ESA | HSM server | Management NIC (ethMNG) of ESA | HSM communication | This port must be opened and configured based on the enterprise network policies or according to your use case. |
| 443 | TCP | ESA |
| Management NIC (ethMNG) of ESA | Key Management Service (KMS) Integration | This port must be opened and configured based on the enterprise network policies or according to your use case. |
Ports for DSG
If you are utilizing the DSG appliance, the following ports must be configured in your environment.
Port Number | Protocol | Source | Destination | NIC | Description |
22 | TCP | System User | DSG | Management NIC (ethMNG) | Access to CLI Manager. |
443 | TCP | System User | DSG | Management NIC (ethMNG) | Access to Web UI. |
Ports for communication between DSG and ESA
The following is the list of ports that must be configured for communication between DSG and ESA.
Port Number | Protocol | Source | Destination | NIC | Description | Notes (If any) | |
22 | TCP | ESA | DSG | Management NIC (ethMNG) |
| ||
443 | TCP | ESA | DSG | Management NIC (ethMNG) | Communication in TAC | ||
443 | TCP | ESA | DSG | Management NIC (ethMNG) | Synchronize SSL certificates with ESA's certificates during ESA communication | ||
8443 | TCP | DSG | ESA | Management NIC (ethMNG) |
| ||
9200 | TCP | DSG | ESA | Management NIC (ethMNG) | To send audit logs received from the Log Server and forward
it to Insight in the ESA. | ||
389 | TCP | DSG | ESA | Management NIC (ethMNG) | Authentication and authorization by ESA | ||
| 5671 | TCP | DSG | ESA | Management NIC (ethMNG) | Notifications sent from DSG to ESA | Notifications related to OS backup. Notifications from cron jobs are sent to the ESA dashboard. | |
| 10100 | UDP | DSG | ESA | Management NIC (ethMNG) |
| This port is optional. If the appliance heartbeat services are stopped, this port can be disabled. |
DSG Ports for Communication in TAC
The following is the list of ports that must also be configured when DSG is configured in a TAC.
Port Number | Protocol | Source | Destination | NIC | Description | Notes (If any) |
22 | TCP | DSG | ESA | Management NIC (ethMNG) | Communication in TAC | |
8585 | TCP | ESA | DSG | Management NIC (ethMNG) | Retrieving Cloud Gateway cluster information | |
443 | TCP | ESA | DSG | Management NIC (ethMNG) | Communication in TAC | |
10100 | UDP | ESA | DSG | Management NIC (ethMNG) | Communication in TAC | This port is optional. If the Appliance Heartbeat services are stopped, this port can be disabled. |
10100 | UDP | DSG | ESA | Management NIC (ethMNG) |
| This port is optional. If the Appliance Heartbeat services are stopped, this port can be disabled. |
10100 | UDP | DSG | DSG | Management NIC (ethMNG) | Communication in TAC | This port is optional. |
Additional Ports for DSG
In DSG, service NICs are not assigned a specific port number. You can configure a port number as per your requirements.
Based on the firewall rules and network infrastructure of your organization, you must open ports for the services listed in the following table.
| Port Number | Protocol | Source | Destination | NIC | Description | Notes (If any) |
| 123 | UDP | DSG | Time servers | Management NIC (ethMNG) of ESA | NTP Time Sync Port | This port can be configured based on the enterprise network policies or according to your use case. |
| 514 | UDP | DSG | Syslog servers | Management NIC (ethMNG) of ESA | Forwarding logs | This port can be configured based on the enterprise network policies or according to your use case. |
| 514 | TCP | DSG | Syslog servers | Management NIC (ethMNG) of ESA | Forwarding logs | This port can be configured based on the enterprise network policies or according to your use case. |
| Application Ports | TCP | DSG | Applications | Service NIC (ethSRV) of DSG | Enabling communication for DSG with different
applications in the organization. | This port can be configured based on the enterprise network policies or according to your use case. |
| Tunnel Ports | TCP | Applications | DSG | Service NIC (ethSRV) of DSG | Enabling communication for DSG with different
applications in the organization. | This port can be configured based on the enterprise network policies or according to your use case. |
Ports for the Internet
The following ports must be configured on ESA for communication with the Internet.
If the FIPS mode is enabled, then the Antivirus is disabled on the appliance. If the FIPS mode is enabled, this port can be disabled. For more information about Antivirus, refer Working with Antivirus.
| Port Number | Protocol | Source | Destination | NIC | Description |
| 80 | TCP | ESA | ClamAV Database | Management NIC (ethMNG) of ESA | Updating the Antivirus database on ESA. |
Additional Ports for Strengthening Firewall Rules
The following ports are recommended for strengthening the firewall configurations.
| Port Number | Protocol | Source | Destination | NIC | Description |
| 67 | UDP | Appliance/System | DHCP server | Management NIC (ethMNG) | Allows to broadcast a DHCP request from client to DHCP server. |
| 68 | UDP | DHCP server | Appliance/System | Management NIC (ethMNG) | Allows to listen for DHCP responses from the server. |
| 161 | UDP | ESA/DSG | SNMP | Management NIC (ethMNG) | Allows SNMP requests. |
| 162 | UDP | ESA/DSG | SNMPTrap | Management NIC (ethMNG) | Allows SNMPTrap requests. |
| 10161 | TCP and UDP | ESA/DSG | SNMP | Management NIC (ethMNG) | Allows SNMP requests over DTLS. |
Insight in ESA Ports
The following ports must be configured for communication for Insight in ESA.
| Port Number | Protocol | Source | Destination | NIC | Description | Notes (If any) |
| 9200 | TCP | ESA node in Audit Store cluster | ESA node in the same Audit Store cluster | Management NIC (ethMNG) of Insight in ESA | Insight Nginx REST communication. | This port can be configured based on the enterprise network policies or according to your use case. |
| 9300 | TCP | ESA node in Audit Store cluster | ESA node in the same Audit Store cluster | Management NIC (ethMNG) of Insight in ESA | Internode communication between the Audit Store nodes. | This port can be configured based on the enterprise network policies or according to your use case. |
| 24284 | TCP | Protector | ESA | Management NIC (ethMNG) of Insight in ESA | Communication between protector and td-agent. | This port can be configured according to your use case when forwarding logs to an external Security information and event management (SIEM) over TLS. |
4.9 - VMware tools in appliances
The VMware tools are used to access the utilities that enable you to monitor and improve management of the virtual machines that are part of your environment. When you install or upgrade your appliance, the VMware tools are automatically installed.
4.10 - Increasing the Appliance Disk Size
If you need to increase the total disk size of the Appliance, then you can add additional hard disks to the Appliance. The Appliance refers to the added hard disks as logical volumes, or partitions, which offer additional disk capacity.
As required, partitions can be added, removed, or moved from one hard disk to another. It is possible to create smaller partitions on a hard disk and combine multiple hard disks to form a single large partition.
Configuration of Appliance for Adding More Disks
Hard disks or volumes can be added to the appliance at two different times:
Add the hard disk during installation of the Appliance.
For more information about adding and configuring the hard disk, refer to the Protegrity Installation Guide.
Add the hard disks later when required.
Steps have been separately provided for a single hard disk installation and more than one hard disk installation later in this section.
Installation of Additional Hard Disks
Ensure that the Appliance is installed and working and the hard disks to be added are readily available.
To install one or more hard disks:
If the Appliance is working, then log out of the Appliance and turn it off.
Add the required hard disk.
Turn on the appliance.
Login to the CLI console with admin credentials.
Navigate to Tools > Disk Management.
Search for the new device name, for example, :/dev/sda, and note down the capacity and the partitions in the device.
Select Refresh.
The system recognizes any added hard disks.
Select Extend to add more hard disks to the existing disk size.
Select the newly added hard disk.
Click Extend again to confirm that the newly added hard disk has been added to the Appliance disk size.
A dialog appears asking for confirmation with the following message.
Warning! All data on the /dev/sda will be removed! Press YES to continue…
Select Continue.
The newly added hard disk is added to the existing disk size of the Appliance.
Navigate to Tools > Disk Management.
The following screen appears confirming addition of the hard disk to the Appliance disk size.

Rolling Back Addition of New Hard Disks
If the Appliance has been upgraded, then roll back to the setup of the previous version is possible. Roll back option is unavailable if you have upgraded your system to Appliance v8.0.0 and have not finalized the upgrade. When you finalize the upgrade, you confirm that the system is functional. Only then does the roll back feature become available.
For more information about upgrade, refer to the Protegrity Upgrade Guide.
4.11 - Mandatory Access Control
Mandatory Access Control (MAC) is a security approach that allows or denies an individual access to resources in a system. With MAC, you can set polices that can be enforced on the resources. The policies are defined by the administrator and cannot be overridden by other users.
Among many implementations of MAC, Application Armor (AppArmor) is a CIS recommended Linux security module that protects the operating system and its applications from threats. It implements MAC for constraining the ability of a process or user on operating system resources.
AppArmor allows you to define policies for protecting the executable files and directories present in the system. It applies these policies to the profiles. Profiles are groups, where restriction on specific actions for the files or directories are defined. The following are the two modes of applying policies on profiles:
Enforce: The profiles are monitored to either permit or deny a specific action.
Complain: The profiles are monitored, but actions are not restricted. Instead, actions are logged in the audit events.
For more information about AppArmor, refer to http://wiki.apparmor.net
AppArmor in Protegrity appliances
AppArmor increases security by restricting actions on the executable files in the system. It is added as another layer of security to protect custom scripts and prevent information leaks in case of any security breach. On Protegrity appliances, such as, ESA and DSG, AppArmor is enabled to protect the different OS features, such as, antivirus, firewall, scheduled tasks, trusted appliances cluster, proxy authentication, and so on. Separate profiles are created for appliance-specific features. For more information about the list of profiles, refer to Viewing profiles. In an unprecedented case of a security breach on the appliances, any attempt to modify the protected profiles are foiled by AppArmor. The logs for the denials are generated and appear under system logs where they can be analyzed.
After AppArmor is enabled, all profiles that are defined in it are protected. Although it is enabled, if a new executable script is introduced in the appliance, AppArmor does not automatically protect this script. For every new script or file to be protected, a separate AppArmor profile must be created and permissions must be assigned to it.
The following sections describe the various tasks that you can perform on the Protegrity appliances using AppArmor.
4.11.1 - Working with profiles
Creating a Profile
In addition to the existing profiles in the appliances, AppArmor allows creating profiles for other executable files present in the system. Using the aa-genprof command, you can create a profile to protect a file. When this command is run, AppArmor loads that file in complain mode and provides an option to analyze all the activities that might arise. It learns about all the activities that are present in the file and suggests the permissions that can be applied on them. After the permissions are assigned to the file, the profile is created and set in the enforce mode.
As an example, consider an executable file apparmor_example.sh in your system for which you want to create a profile. The script is copied in the /etc/opt/ directory and contains the following actions:
- Creating a file sample1.txt in the /etc/opt/ directory
- Changing permissions for the sample1.txt file
- Removing sample1.txt file
Ensure that apparmor_example.sh file has a 755 permission set to it.
Generating a profile for a file
The following steps describe how to generate a profile for the apparmor_example.sh file.
Perform the following steps to create a profile.
Login to the CLI Manager.
Navigate to Administration > OS Console.
Navigate to the /etc/opt directory.
Run the following command to view the commands in the apparmor_example.sh file.
cat apparmor_example.shThe following commands appear.
#!/bin/bash

touch /etc/opt/sample1.txt

chmod 400 /etc/opt/sample1.txt

rm /etc/opt/sample1.txt
Replicate the SSH session. Navigate to the OS Console and run the following command
aa-genprof /etc/opt/apparmor_example.shThe following screen appears.

Switch to the first SSH session and run the following script.
./apparmor_example.shThe commands are run successfully.
Switch to the second SSH session. Type S to scan and create a profile for the apparmor_example.sh file.
AppArmor reads the first command. It provides different permissions based on what the command does, and assigns a severity to it.
Profile:  /etc/opt/apparmor_example.sh
Execute:  /bin/touch
Severity: unknown

(I)nherit / (C)hild / (N)amed / (X) ix On / (D)eny / Abo(r)t / (F)inish
Type I to assign the inherit permissions.
After selecting the option for the first command, AppArmor reads each action and provides a list of permissions for each action. Type the required character that needs to be assigned for the permissions.
Type F to finish the scanning and S to save the change to the profile.
The following message appears.
Setting /etc/opt/apparmor_example.sh to enforce mode.

Reloaded AppArmor profiles in enforce mode.

Please consider contributing your new profile!
See the following wiki page for more information:
http://wiki.apparmor.net/index.php/Profiles

Finished generating profile for /etc/opt/apparmor_example.sh.
Restart the AppArmor service using the following command.
/etc/init.d/apparmor restartNavigate to the /etc/apparmor.d directory to view the profile.
The profile appears as follows.
etc.opt.apparmor_example.sh
Setting a Profile on Complain Mode
For easing the restrictions applied to the a profile, you can apply the complain mode on it. AppArmor allows actions to be performed, but logs all the activities that occur for that profile. AppArmor provides the aa-complain command to perform this task. The following task describes the steps to set the apparmor_example.sh file in the complain mode.
Perform the following steps to set a profile in complain mode.
Login to the CLI Manager.
Navigate to Administration > OS Console.
Run the enforce command as follows:
aa-complain /etc/apparmor.d/etc.opt.apparmor_example.shRun the
./apparmor_example.shscript.Navigate to the /var/log/syslog directory to view the logs.
Even though an event has a certain restriction, the logs display that AppArmor allowed it to occur and has logged it for the apparmor_example.sh script.

Setting a Profile on Enforce Mode
When the appliance is installed in your system, the enforce mode is applied on the profiles by default. If you want to add a profile in enforce mode, AppArmor provides the aa-enforce command to perform this task.The following task describes the steps to set the apparmor_example.sh file in enforce mode.
Perform the following steps to set a profile in enforce mode.
Login to the CLI Manager.
Navigate to Administration > OS Console.
Run the enforce command as follows:
aa-enforce /etc/apparmor.d/etc.opt.apparmor_example.shRun the
./apparmor_example.shscript.Based on the permissions that are assigned while creating the profile for the script, the following message is displayed on the screen.

The Deny permission is assigned to all the commands in this script.
Modifying an Existing Profile
Important: After upgrading the ESA to v10.2.0, AppArmor profiles must be updated due to changes in binary paths introduced in Bookworm. If the profiles are not updated, existing custom scripts created by user may fail due to change in the binary location.
For supporting binaries at
/binor/liblocation, add/{usr/,}before the binaries.When updating AppArmor profiles using the new binary paths, it is essential to use the
allowkeyword to explicitly define permitted operations and resource access.
For example, the profile having the entry /bin/bash ix, must be updated as shown below:
allow /{usr/,}bin/bash ix,.
In an appliance, Protegrity provides a default set of profiles for appliance-specific features. These include profiles for Two-factor authentication, Antivirus, TAC, Networking, and so on. The profiles contain appropriate permissions that require the feature to run smoothly without compromising its security. However, access-denial logs for some permissions may appear when these features are run. This calls for modifying the profile of a feature by appending the permissions to it.
Consider the usr.sbin.apache2 profile that is related to the networking services. When this feature is executed, based on the permissions that are defined, AppArmor allows the required operations to run. If it encounters a new action on this profile, it generates a Denied error and halts the task from proceeding.
For example, the following log appears for the usr.sbin.apache2 profile after the host name of the system is changed from the Networking screen on the CLI Manager.
type=AVC msg=audit(1593004864.290:2492): apparmor="DENIED" operation="exec" profile="/usr/sbin/apache2" name="/sbin/ethtool" pid=32518 comm="sh" requested_mask="x" denied_mask="x" fsuid=0 ouid=0FSUID="root" OUID="root"
As described in the log, AppArmor denied an execute permission for this profile. Every time you change the host name from the CLI manager, AppArmor will not permit that operation to be performed. This can be mitigated by modifying the profile from the /etc/apparmor.d/custom directory. Thus, the additional permission must be added to the usr.sbin.apache2 profile that is present in the /etc/apparmor.d/custom directory. This ensures that the new permissions to the profile are considered and existing permissions are not overwritten when the feature is executed. If you get a permission error log on the Appliance Logs screen, then perform the following steps to update the usr.sbin.apache2 profile with a new permission.
Updating profile permissions
Perform the steps in the instructions below to update profile permissions.
Those steps are also applicable for permission denial logs that appear for other default profiles provided by Protegrity. Based on the permissions that are denied, update the respective profiles with the new operations.
To update profile permissions:
On the CLI Manager, navigate to Administration > OS Console.
Navigate to the /etc/apparmor.d/custom directory.
Open the required profile on the editor.
For example, open the usr.sbin.apache2 profile in the editor.
Add the following permission.
<Value in the name parameter of the denial log> rix,For example, the command for usr.sbin.apache2 denial log is as follows.
/sbin/ethtool rix,Save the changes and exit the editor.
Run the following command to update the changes to the AppArmor profile.
apparmor_parser -r /etc/apparmor.d/<Profile>For example,
apparmor_parser -r /etc/apparmor.d/usr.sbin.apache2Now, change the host name of the system from the CLI Manager. The denial logs are not observed.
Viewing Status of Profiles
Using the aa-status command, AppArmor loads and displays all the profiles that are configured in the system. It displays all the profiles that are in enforce and complain modes.
Perform the following steps to view the status for the profiles.
Login to the CLI Manager.
Navigate to Administration > OS Console.
Run the status command as follows:
aa-statusThe screen with the list of all profiles appears.

4.11.2 - Analyzing events
AppArmor provides an interactive tool to analyze the events occurring in the system. The aa-logprof is one such utility that scans the logs for the events in your system. The aa-logprof command scans the logs and provides a set actions for modifying a profile.
Consider the apparmor_example.sh script that is in the enforce mode. After a certain period of time, you modify the script and insert a command to list all the files in the directory. When you run the apparmor_example.sh script, a Permission denied error appears on the screen. As a new command is added to this script and permissions are not assigned to the updated entry, AppArmor does not allow the script to run. The permissions must be assigned before the script is executed. To evaluate the permissions that can be applied to the new entries, you can view the logs for details. On the ESA CLI Manager, the logs are available in the audit.log file in the /var/log/ directory. The following figure displays the logs that appear for the apparmor_example.sh script.

In the figure, the logs describe the profile for apparmor_example.sh. The logs contain the following information:
- AppArmor has denied an open operation for the profile that contains a new command.
- The script does not have access to a /dev/tty directory with the requested_mask=“r” permission as it is not defined for the new command.
Thus, the logs provide an insight on the different operations that occur when the script is executed. After analyzing the logs and evaluating the permissions, you can run the aa-logprof command to update the permissions for the script.
The changes that are applied on the profiles are audited and logs are generated for it. For more information about the audit logs, refer to System Auditing.
Important: It is not recommended to use the
aa-logprofcommand for profiles defined by Protegrity. If you want to modify an existing profile, refer to Modifying an existing Profile.
Updating profile permissions
Perform the following steps to update profile permissions.
Login to the CLI Manager.
Navigate to Administration > OS Console.
Run the
aa-logprofcommand.Reading log entries from /var/log/syslog. Updating AppArmor profiles in /etc/apparmor.d. Complain-mode changes: Profile: /etc/opt/apparmor_examples.sh Path: /bin/rm Old Mode: r New Mode: mr Severity: unknown [1 - /bin/rm mr,] (A)llow / [(D)eny] / (I)gnore / (G)lob / Glob with (E)xtension / (N)ew / Audi(t) / Abo(r)t / (F)inishType the required permissions. Type F to finish scanning.
After the permissions are granted, the following screen appears.
= Changed Local Profiles =
The following local profiles were changed. Would you like to save them?

 [1 - /etc/opt/apparmor_examples.sh]
(S)ave Changes / Save Selec(t)ed Profile / [(V)iew Changes] / View Changes b/w (C)lean profiles / Abo(r)t
Type S to save the changes.
Writing updated profile for /etc/opt/apparmor_examples.sh.Navigate to the /etc/apparmor.d directory to view the profile.
4.11.3 - AppArmor permissions
The following table describes the different permissions that AppArmor lists when creating a profile or analyzing events.
| Permission | Description |
|---|---|
| (I)nherit | Inherit the permissions from the parent profile. |
| (A)llow | Allow access to a path. |
| (I)gnore | Ignore the prompt. |
| (D)eny | Deny access to a path. |
| (N)ew | Create a new profile. |
| (G)lob | Select a specific path or create a general rule using wild cards that match a broader set of paths. |
| Glob with (E)xtension | Modify the original directory path while retaining the filename extension. |
| (C)hild | Creates a rule in a profile, requires a sub-profile to be created in the parent profile, and rules must be separately generated for this child. |
| Abo(r)t | Exit AppArmor without saving the changes. |
| (F)inish | Finish scanning for the profile. |
| (S)ave | Save the changes for the profile. |
4.11.4 - Troubleshooting for AppArmor
The following table describes solutions to issues that you might encounter while using AppArmor .
| Issue | Reason | Solution |
After you run the File Export or File Import operation in the ESA, the following message appears in the logs:type=AVC msg=audit(1594813145.658:7306): apparmor="DENIED" operation="exec" profile="/usr/sbin/apache2" name="/usr/lib/sftp-server" pid=58379 comm="bash" requested_mask="x"* denied_mask="x" *fsuid=0 ouid=0FSUID="root" OUID="root" | Perform the following steps:
| |
If a scheduler task containing a customized script is run,
then the scheduled task is not executed and a denial message
appears in the log. For example, if a task scheduler contains the
/demo.sh script in the command line, the
following message appears in the logs.type=AVC msg=audit(1598429205.615:35253): apparmor="DENIED" operation="exec" profile="/usr/sbin/apache2" name="/demo.sh" pid=32684 comm=".taskV5FLVl.tmp" requested_mask="x" denied_mask="x" fsuid=0 ouid=0FSUID="root" OUID="root" | AppArmor restricts running any custom scripts from the scheduled task | Perform the following steps.
|
| If you run the Put Files operation
between two machines in a TAC, the following messages appear as
logs in the source and target appliances. Source appliance type=AVC msg=audit(1598288495.530:5168): apparmor="DENIED" operation="mknod" profile="/etc/opt/Cluster/cluster_helper" name="/dummyfilefortest.sh" pid=62621 comm="mv" requested_mask="c" denied_mask="c" fsuid=0 ouid=0FSUID="root" OUID="root" Target appliance type=AVC msg=audit(1598288495.950:2116): apparmor="DENIED" operation="chown" profile="/etc/opt/Cluster/cluster_helper" name="/dummyfilefortest.sh" pid=17413 comm="chown" requested_mask="w" denied_mask="w" fsuid=0 ouid=0FSUID="root" OUID="root" | Perform the following steps.
|
4.12 - Accessing Appliances using Single Sign-On (SSO)
What is SSO?
Single Sign-on (SSO) is a feature that enables users to authenticate multiple applications by logging to a system only once. It provides federated access, where a ticket or token is trusted across multiple applications in a system. Users log in using their credentials. They are authenticated through authentication servers such as Active Directory (AD) or LDAP that validate the credentials. After successful authentication, a ticket is generated for accessing different services.
Consider an enterprise user having access to multiple applications that offer a variety of services. The applications might require user authentication, where one provides usernames and passwords to access them. Each time the user accesses any of the applications, the ask to provide the credentials increases. It is required that a user remember multiple user credentials for the applications. Thus, to avoid the confusion for the users, the Single Sign-On (SSO) mechanism can be used to facilitate access to multiple applications by logging in to the system only once.
4.12.1 - What is Kerberos
One of the protocols that SSO uses for authentication is Kerberos. Kerberos is an authentication protocol that uses secret key cryptography for secure communication over untrusted networks. Kerberos is a protocol used in a client-server architecture, where the client and server verify each other’s identities. The messages sent between the client and server are encrypted, thus preventing attackers from snooping.
For more information about Kerberos, refer to https://web.mit.edu/kerberos/
Key Entities in Kerberos
There are few key entities that are involved in a Kerberos communication.
- Key Distribution Center (KDC): Third-party system or service that distributes tickets.
- Authentication Server (AS): Server that validates the user logging into a system.
- Ticket Granting Server (TGS): Server that grants clients a ticket to access the services.
- Encrypted Keys: Symmetric keys that are shared between the entities such as, authentication server, TGS, and the main server.
- Simple and Protected GSS-API Negotiation (SPNEGO): The Kerberos SPNEGO mechanism is used in a client-server architecture for negotiating an authentication protocol in an HTTP communication. This mechanism is utilized when the client and the server want to authenticate each other, but are not sure about the authentication protocols that are supported by each of them.
- Service Principal Name (SPN): SPN represents a service on a network. Every service must be defined in the Kerberos database.
- Keytab File: It is an entity that contains an Active Directory account and the keys for decrypting Kerberos tickets. Using the keytab file, you can authenticate remote systems without entering a password.
For implementing Kerberos SSO, ensure that the following prerequisites are considered:
- The appliances, such as, the ESA, or DSG are up and running.
- The AD is configured and running.
- The IP addresses of the appliances are resolved to a Fully Qualified Domain Name (FQDN).
4.12.1.1 - Implementing Kerberos SSO for Protegrity Appliances
In Protegrity appliances, such as, the ESA or DSG you can utilize the Kerberos SSO mechanism to login to the appliance. The user logs into the system with his domain credentials for accessing the appliances. The appliance validates the user and on successful validation, allows the user access to the appliance. For utilizing the SSO mechanism, you must configure certain settings on different entities, such as, AD, Web browser, and the ESA appliance. The following sections describe a step-by-step approach for setting up SSO.
Protegrity supported directory services
For Protegrity appliances, only Microsoft AD is supported.
4.12.1.1.1 - Prerequisites
For implementing Kerberos SSO, ensure that the following prerequisites are considered:
- The appliances, such as, the ESA or DSG are up and running.
- The AD is configured and running.
- The IP addresses of the appliances are resolved to a Fully Qualified Domain Name (FQDN).
4.12.1.1.2 - Setting up Kerberos SSO
This section describes the different tasks that an administrative user must perform for enabling the Kerberos SSO feature on the Protegrity appliances, ESA or DSG.
| Order | Platform | Step | Reference |
|---|---|---|---|
| 1 | Appliance Web UI | On the appliance Web UI, import the domain users from the AD to the internal LDAP of the appliance. Assign SSO Login permissions to the required user role. | Importing Users and assigning role |
| 2 | Active Directory | On the AD, map the Kerberos SPN to a user account. | Configuring SPN |
| 3 | Active Directory | On the AD, generate a keytab file. | Generating keytab file |
| 4 | Appliance Web UI | On the appliance Web UI, upload the generated keytab file. | Uploading keytab file |
| 5 | Web Browser | On the user’s machine, configure the Web browsers to handle SPNEGO negotiation. | Configuring browsers |
Importing Users and Assigning Role
In the initial steps for setting up Kerberos SSO, a user with administrative privileges must import users from an AD to the appliance, ESA or DSG. After importing, assign the required permissions to the users for logging with SSO.
To import users and assign roles:
On the appliance Web UI, navigate to Settings > Users > Proxy Authentication.
Enter the required parameters for connecting to the AD.
For more information about setting AD parameters, refer here.
Navigate to the Roles tab.
Create a role or modify an existing role.
Select the SSO Login permission check box for the role and click Save.
If you are configuring SSO on the DSG, then ensure the user is also granted the required cloud gateway permissions.
Navigate to the User Management tab.
Click Import Users to import the required users to the internal LDAP.
For more information about importing users, refer here.
Assign the role with the SSO Login permissions to the required users.
Creating Service Principal Name (SPN)
A Service Principal Name (SPN) is an entity that represents a service mapped to an instance on a network. For a Kerberos-based authentication, the SPN must be configured in Active Directory (AD). For Protegrity appliances, ESA or DSG, only Microsoft AD is supported. The SPN is registered with the AD. In this configuration, a service associates itself with the AD for the purpose of authentication requests.
For Protegrity, the instance is represented by appliances, such as, the ESA or DSG. It uses the SPNEGO authentication for authenticating users for SSO. The SPNEGO uses the HTTP service for authenticating users. The SPN is configured for the appliances in the following format.
service/instance@domain
Ensure an SPN is created for every appliance involved in the Kerberos SSO implementation.
Example SPN creation
Consider an appliance with host name esa1.protegrity.com on the domain protegrity.com. The SPN must be set in the AD as HTTP/esa1.protegrity.com@protegrity.com.
The SPN of the appliance can be configured in the AD using the setspn command. Thus, to create the SPN for esa1.protegrity.com, run the following command.
setspn -A HTTP/esa1.protegrity.com@protegrity.com
Creating the Keytab File
The keytab is an encrypted file that contains the Kerberos principals and keys. It allows an entity to use a Kerberos service without being prompted for a password on every access. The keytab file decrypts every Kerberos service request and authenticates it based on the password.
For Protegrity appliances, such as, ESA or DSG, an SSO authentication request of a user from an appliance to the AD passes through the keytab file. In this file, you map the appliance user’s credentials to the SPN of the appliance. The keytab file is created using the ktpass command. The following is the syntax for this command:
ktpass -out <Location where to generate the keytab file> -princ HTTP/<SPN of the appliance> -mapUser <username> -mapOp set -pass <Password> -crypto All -pType KRB5_NT_PRINCIPAL
The following sample snippet describes the ktpass for mapping a user in the keytab file. Consider an ESA appliance with host name esa1.protegrity.com on the domain protegrity.com. The SPN for the appliance is set as HTTP/esa1.protegrity.com@protegrity.com. Thus, to create a keytab file and map a user Tom, run the following command.
ktpass -out C:\esa1.keytab -princ HTTP/esa1.protegrity.com@protegrity.com -mapUser Tom@protegrity.com -mapOp set -pass Test@1234 -crypto All -pType KRB5_NT_PRINCIPAL
Uploading Keytab File
After creating the keytab file from the AD, you must upload it on the appliance, such as, ESA or DSG. You must upload the keytab file before enabling Kerberos SSO
To upload the keytab file:
On the Appliance Web UI, navigate to Settings > Users > Single Sign-On.
The Single Sign On screen appears.
From the Keytab File field, upload the keytab file generated.

Click the Upload Keytab icon.
A confirmation message appears.
Select Ok.
Click the Delete icon to delete the keytab file. You can delete the keytab file only when the Kerberos for single sign-on (Spnego) option is disabled.
Under the Kerberos for single sign-on (Spnego) tab, click the Enable toggle switch to enable Kerberos SSO.
A confirmation message appears.
Select Ok.
A message Kerberos SSO was enabled successfully appears.
Configuring SPNEGO Authentication on the Web Browser
Before implementing Kerberos SSO for Protegrity appliances, such as, ESA or DSG, you must ensure that the Web browsers are configured to perform SPNEGO authentication. The tasks in this section describe the configurations that must be performed on the Web Browsers. The recommended Web browsers and their versions are as follows:
- Google Chrome version 129.0.6668.58/59 (64-bit)
- Mozilla Firefox version 130.0.1 (64-bit) or higher
- Microsoft Edge version 128.0.2739.90 (64-bit)
The following sections describe the configurations on the Web browsers.
Configuring SPNEGO Authentication on Firefox
The following steps describe the configurations on Mozilla Firefox.
To configure on the Firefox Web browser:
Open Firefox on the system.
Enter about:config in the URL.
Type negotiate in the Search bar.
Double click on network.negotiate-auth.trusted-uris parameter.
Enter the FQDN of the appliance and exit the browser.
Configuring SPNEGO Authentication on Chrome
With Google Chrome, you must set the white list servers that Chrome will negotiate with. If you are using a Windows machine to log in to the appliances, such as, ESA or DSG, then the configurations entered in other browsers are shared with Chrome. You need not add a separate configuration.
4.12.1.1.3 - Logging to the Appliance
After configuring the required SSO settings, you can login to the appliance, ESA or DSG, using Kerberos SSO.
To login to the appliance using SSO:
Open the Web browser and enter the FQDN of the ESA or DSG in the URL.
Click Sign in with Kerberos SSO.
The Dashboard of the ESA/DSG appliance appears.
4.12.1.1.4 - Scenarios for Implementing Kerberos SSO
This section describes the different scenarios for implementing Kerberos SSO.
Implementing Kerberos SSO on an Appliance Connected to an AD
This section describes the process of implementing Kerberos SSO when an appliance, ESA or DSG, utilizes authentication services of the local LDAP.
You can also login to the appliance without SSO by providing valid user credentials.
Steps to configure Kerberos SSO with a Local LDAP
Consider an appliance, ESA or DSG, for which you are configuring SSO. Ensure that you perform the following steps to implement it.
- Import users from an external directory and assign SSO permissions.
- Configure SPN for the appliance.
- Create and upload the keytab file on the appliance.
- Configure the browser to support SSO.
Logging in with Kerberos SSO
After configuring the required settings, user enters the appliance domain name on the Web browser and clicks Sign in with SSO to access appliance. On successful authentication, the Dashboard of the appliance appears.
Example process
The following figure illustrates the SSO process for appliances that utilize the local LDAP.

The user logs in to the domain with their credentials.
For example, a user, Tom, logs in to the domain abc.com as tom@abc.com and password *********.
Tom is authenticated on the AD. On successful authentication, he is logged in to the system.
For accessing the appliance, the user enters the FQDN of the appliance on the Web browser.
For example, esa1.protegrity.com.
If Tom wants to access the appliance using SSO, then he clicks Sign in with SSO on the Web browser.
A message is sent to the AD requesting a token for Tom to access the appliance.
The AD generates a SPNEGO token and provides it to Tom.
This SPNEGO token is then provided to the appliance to authenticate Tom.
The appliance performs the following checks.
- It receives the token and decrypts it. If the decryption is successful, then the token is valid.
- Retrieves the username from the token.
- Validates Tom with the internal LDAP.
- Retrieves the role for Tom and verifies that the role has the SSO Login permissions. After successfully validating the token and the role permissions, Tom can access the appliance.
Implementing Kerberos SSO on other Appliances Communicating with ESA
This section describes the process of implementing Kerberos SSO when an appliance utilizes authentication services of another appliance. Typically, the DSG depends on ESA for user management and LDAP connectivity. This section explains the steps that must be performed to implement SSO on the DSG.
Implementing Kerberos SSO on DSG
This section explains the process of SSO authentication between the ESA and the DSG. It also includes information about the order of set up to enable SSO authentication on the DSG.
The DSG depends on the ESA for user and access management. The DSG can leverage the users and user permissions that are defined in the ESA only if the DSG is set to communicate with the ESA.
The following figure illustrates the SSO process for appliances that utilize the LDAP of another appliance.

Example process
The user logs in to the system with their credentials.
For example, John logs in to the domain abc.com as john@abc.com and password *********. The user is authenticated on the AD. On successful authentication the user is logged in to the system.
For accessing the DSG Web UI John enters the FQDN of the DSG on the Web browser.
For example, dsg.protegrity.com.
If John wants to access the DSG Web UI using SSO, he clicks Sign in with SSO on the Web browser.
The username of John and the URL of the DSG is forwarded to the ESA.
The ESA sends the request to the AD for generating a SPNEGO token.
The AD generates a SPNEGO token to authenticate John and sends it to the ESA.
The ESA performs the following steps to validate John.
Receives the token and decrypts it. If the decryption is successful, then the token is valid.
Retrieves the username from the token.
Validates John with the internal LDAP.
Retrieves the role for John and verifies that the role has SSO Login .
If ESA encounters any error related to the role, username, or token, an error is displayed on the Web UI. For more information about the errors, refer Troubleshooting.
On successful authentication, the ESA generates a service JWT.
The ESA sends this service JWT and the URL of to the Web browser.
The Web browser presents this JWT to the DSG for validation.
The DSG validates the JWT based on the secret key shared with ESA. On successful validation, John can login to the DSG Web UI.
Before You Begin:
Ensure that you complete the following steps to implement SSO on the DSG.
Ensure that the Set ESA Communication process is performed on the DSG for establishing communication with the ESA.
For more information about setting ESA communication, refer Setting up ESA Communication.
Import users from an external directory on the ESA and assign SSO and cloud gateway permissions.
Configure SPN for the ESA.
Enable Single Sign-on on the ESA.
Export the JWT settings to all the DSG nodes in the cluster.
Next Steps:
After ensuring that the prerequisites for SSO in the DSG implementation are completed, you must complete the configuration on the DSG Web UI.
For more information about completing the configuration, refer LDAP and SSO Configurations.
Exporting the JWT Settings to the DSG Nodes in the Cluster
As part of SSO implementation for the DSG, the JWT settings must be exported to all the DSG nodes that will be configured to use SSO authentication.
Ensure that the ESA, where SSO is enabled, and the DSG nodes are in a cluster.
To export the JWT settings:
Log in to the ESA Web UI.
Navigate to System > Backup & Restore.
On the Export, select the Cluster Export option, and click Start Wizard.
On the Data to import tab, select only Appliance JWT Configuration. Ensure that Appliance JWT Configuration is the only check box selected, and then click Next.
On the Source Cluster Nodes tab, select Create and Run a task now, and click Next.
On the Target Cluster Nodes tab, select all the DSG nodes where you want to export the JWT settings, and click Execute.
Implementing Kerberos SSO with a Load Balancer Setup
This section describes the process of implementing SSO with a Load Balancer that is setup between the appliances.
Steps to configure SSO in a load balancer setup
Consider two appliances, L1 and L2, that are configured behind a load balancer. Ensure that you perform the following steps to implement it.
- Import users from an external directory on the L1 and L2 and assign SSO login permissions.
- Ensure that the FQDN is resolved to the IP address of the load balancer.
- Configure SPN for the load balancer.
- Create and upload the keytab file on L1 and L2.
- Configure the browser to support SSO.
Logging in with SSO
After configuring the required settings, the user enters the FQDN of load balancer on the Web browser and clicks Sign in with Kerberos SSO to access it. On successful authentication, the Dashboard of the appliance appears.
4.12.1.1.5 - Viewing Logs
You can view the logs that are generated for when the Kerberos SSO mechanism is utilized. The logs are are generated for the following events:
- Uploading keytab file on the appliance
- Deleting the keytab file on the appliance
- User logging to the appliance through SSO
- Enabling or disabling SSO
Navigate to Logs > Appliance Logs to view the logs.
You can also navigate on the Discover screen to view the logs.
4.12.1.1.6 - Feature Limitations
This section covers some known limitations of the Kerberos SSO feature.
Trusted Appliances Cluster
The keytab file is specific for an SPN. A keytab file assigned for one appliance is not applicable for another appliance. Thus, if your appliance is in a TAC, it is recommended not to replicate the keytab file between different appliances.
4.12.1.1.7 - Troubleshooting
This section describes the issues and their solutions while utilizing the Kerberos SSO mechanism.
Table: Kerberos SSO Troubleshooting
| Issue | Reason | Solution |
The following message appears while logging in with
SSO.Login Failure: SPNEGO authentication is not supported on this client. | The browser is not configure to handle SPNEGO authentication | Configure the browser to perform SPNEGO
authentication. For more information about configuring the
browser settings, refer Configuring
browsers. |
The following message appears while logging in with
SSO.Login Failure: Unauthorized to SSO Login. |
| Ensure that the following points are considered:
For more information about configuring user role, refer Importing
Users and assigning role. |
The following error appears while logging in with
SSO.Login Failure: Please contact System Administrator | The JWT secret key is not the same between the appliances. | If an appliance is using an LDAP of another appliance for user authentication, then ensure that the JWT secret is shared between them. |
The following error appears while logging in with
SSO.Login Failure: SSO authentication disabled | This error might occur when you are using LDAP of another appliance for authentication. If SSO in the appliance that contains the LDAP information is disabled, this error message appears. | On the ESA Web UI, navigate to System > Settings > Users > Advanced and check Enable SSO check box. |
| When you are using an LDAP of another appliance for authentication and logging in using SSO, a Service not available message appears on the Web browser. |
| Ensure the following:
|
4.12.2 - What is SAML
About SAML
Security Assertion Markup Language (SAML) is an open standard for communication between an identity provider (IdP) and an application. It is a way to authenticate users in an IdP to access the service provider (SP)..
SAML SSO leverages SAML for seamless user authentication. It uses XML format to transfer authentication data between the IdP and the application. Once users log in to the IdP, they can access multiple applications without providing their user credentials every time. For SAML SSO to be functioning, the IdP and the application must support the SAML standard.
Key Entities in SAML
There are few key entities involved in a Kerberos communication:
- Identity Provider (IdP): A service that manages user identities.
- Service Provider (SP): An entity connecting to the IdP for authenticating users.
- Metadata: A file containing information for connecting an SP to an IdP.
- Unique User Identifier (Name ID): Unique identifier used for user authentication to login to the appliance.
Implementing SAML SSO for Protegrity Appliances
In Protegrity appliances, such as, ESA or DSG, you can utilize the SAML SSO mechanism to login to the appliance. To use this feature, you log in to an IdP, such as, AWS, Azure, or GCP. After you are logged in to the IdP, you can access appliances such as, the ESA or the DSG. The appliance validates the user and on successful validation, allows the user access to the appliance. The following sections describe a step-by-step approach for setting up SAML SSO.
4.12.2.1 - Setting up SAML SSO
Prerequisites
For implementing SAML SSO, ensure that the following prerequisites are met:
- The Service Providers (SPs), such as, the ESA or the DSG are up and running.
- The users are available in the Identity Providers (IdPs), such as, AWS, Azure, or GCP.
- The IdP contains a SAML application for your appliance, such as, ESA or DSG.
- The users that will leverage the SAML SSO feature are added from the User Management screen.
- The IP addresses of the appliances are resolved to a Fully Qualified Domain Name (FQDN).
Setting up SAML SSO
This section describes different tasks that an administrative user must perform for enabling the SAML SSO feature on the Protegrity appliances.
As part of this process, changes may be required to be performed on a user’s roles and settings for LDAP. For more information, refer to section Adding Users to Internal LDAP and Managing Roles.
Table 1. Setting up SSO
| Order | Platform | Step | Reference |
| 1 | Appliance Web UI | Add the users that require SAML SSO. Assign SSO Login permissions to the required user role. Ensure that the password for the users are changed after the first login to the appliance. | |
| 2 | Appliance Web UI | Provide the FQDN and entity ID. This is retrieved from the IdP in which a SAML enterprise application is created for the appliance. | Configuring Service Provider (SP) Settings |
| 3 | Appliance Web UI |
| Configuring IdP Settings |
Configuring Service Provider (SP) Settings
Before enabling SAML SSO on the appliance, such as, ESA or DSG, you must provide the following values that are required to connect the appliance with the IdP.
Fully Qualified Domain Name (FQDN)
The Web UI must have a FQDN so it can be accessed from the web browser of the appliance, such as, ESA or ESA. While configuring SSO on the IdP, you are required to provide a URL that maps your application on the IdP. Ensure that the URL specified in the IdP matches the FQDN specified on the appliance Web UI. Also, ensure that the IP address of your appliance is resolved to a reachable domain name.
Entity ID
The entity ID is a unique value that identifies your SAML application on the IdP. This value is assigned/generated on the IdP after registering your SAML enterprise application on it.
The nomenclature of the entity ID might vary between IdPs.
To enter the SP settings:
On the Web UI, navigate to Settings > Users > Single Sign-On > SAML SSO.
Under the SP Settings section, enter the FQDN that is resolved to the IP address of the appliance in the FQDN text box.
Enter the unique value that is assigned to the SAML enterprise application on the IdP in the Entity ID text box.
If you want to allow access to User Management screen, enable the Access User Management screen option.
- User Management screens require users to provide local user password while performing any operation on it.
- Enabling this option will require users to remember and provide the password created for the user on the appliance.
Click Save.
The SP settings are configured.
Configuring IdP Settings
After configuring the the Service Provider (SP) settings, provide the Metadata and select the Unique User Identifier (Name ID).
The metadata acts as an important parameter in SAML SSO. The metadata is the chain that links the appliance to the IdP. It is an XML structure that contains information, such as, keys, certificates, and entity ID URL. This information is required for communication between the appliance and IdP.
The metadata can be provided in either of the following ways:
- Metadata URL: Provide the URL of the metadata that is retrieved from the IdP.
- Metadata File: Provide the metadata file that is downloaded from the IdP and stored on your system. If you edit the metadata file, then ensure that the information in the metadata is correct before uploading it on the appliance.
The Unique User Identifier (Name ID) provides two options.
- Firstname.Lastname: Authentication using the firstname.lastname.
- UserPrincipleName: Authentication using the email as username@domain.
To enter the metadata settings:
On the Web UI, navigate to Settings > Users > Single Sign-On > SAML SSO.
Click Enable to enable SAML SSO.
If the metadata URL is available, then under the IdP Settings section, select Metadata URL from the Metadata Settings drop-down list. Enter the URL of the metadata.
If the metadata file is downloaded, then under the IdP Settings section, select Metadata File from the Metadata Settings drop-down list. Upload the metadata file.
From the Unique User Identifier (Name ID) drop-down, select Firstname.Lastname or UserPrincipleName as the unique identifier.
If you want to allow access to the User Management screen, enable the Access User Management screen option.
- User Management screens require users to provide local user password while performing any operation on it.
- Enabling this option will require users to remember and provide the password created for the user on the appliance.
Click Save.
The metadata settings are configured.
- If you upload a new metadata file over the existing file, the changes are overridden by the new file.
- If you edit the metadata file, then ensure that the information in the metadata is correct before uploading it on the appliance.
4.12.2.1.1 - Workflow of SAML SSO on an Appliance
After entering all the required data, you are ready to log in with SAML SSO. Before explaining the procedure to log in, the general flow of information is illustrated in the following figure.

Follow the below process to login to the appliance. Additionally, you can login to the appliance without SSO by providing valid user credentials.
Process
Follow these steps to login with SSO:
The user provides the FQDN of the appliance on the Web browser.
For example, the user enters esa.protegrity.com and clicks SAML Single Sign-On.
- Ensure that the user session on the IdP is active.
- If the session is idle or inactive, then a screen to enter the IdP credentials will appear.
The browser generates an authorization request and sends it to the IdP for verification.
If the user is authorized, then the IdP generates a SAML token and returns it to the Web browser.
This SAML token is then provided to the appliance to authenticate the user.
The appliance receives the token. If the token is valid, then the permissions of the user are checked.
Once these are validated, the Web UI of the appliance appears.
4.12.2.1.2 - Logging on to the Appliance
After configuring the required SSO settings, you can login to the appliance using SSO. Ensure that the user session on the IdP is active. If the session is idle or inactive, then a screen to enter the IdP credentials will appear.
To login to the appliance using SSO:
Open the Web browser and enter the FQDN of the ESA or the DSG in the URL.
The following screen appears.

Click Sign in with SAML SSO.
The Dashboard of the ESA/DSG appliance appears.
4.12.2.1.3 - Implementing SAML SSO on Azure IdP - An Example
This section provides a step-by-step sample scenario for implementing SAML SSO on the ESA with the Azure IdP.
Prerequisites
An ESA is up and running.
Ensure that the IP address of ESA is resolved to a reachable FQDN.For example, resolve the IP address of ESA to esa.protegrity.com.
On the Azure IdP, perform the following steps to retrieve the entity ID and metadata.
- Log in to the Azure Portal.
- Navigate to Azure Active Directory.
- Select the tenant for your organization.
- Add the enterprise application in the Azure IdP.Note the value of Application Id for your enterprise application.For more information about creating an enterprise application, refer to https://docs.microsoft.com/.
- Select Single sign-on > SAML.
- Edit the Basic SAML configuration and enter Reply URL (Assertion Consumer Service URL). The format for this text box is https://</FQDN of the appliance>/Management/Login/SSO/SAML/ACS.For example, the value in the Reply URL (Assertion Consumer Service URL) is, https://esa.protegrity.com/Management/Login/SSO/SAML/ACS
- Under the SAML Signing Certificate section, copy the Metadata URL or download the Metadata XML file.
Users leveraging the SAML SSO feature are available in the Azure IdP tenant.
Steps
Log in to ESA as an administrative user. Add all the users for which you want to enable SAML SSO. Assign the roles to the users with the SSO Login permission.
For example, import the user Sam from the User Management screen on the ESA Web UI. Assign a Security Administrator role with SSO Login permission to Sam.
Ensure that the user Sam is present in the Azure AD.
Navigate to Settings > Users > Single Sign-On > SAML Single Sign-On. In the Service Provider (SP) settings section, enter esa.protegrity.com and the Appliance ID in the FQDN and Entity ID text boxes respectively. Click Save.
If the metadata URL is available, then under the IdP Settings section, select Metadata URL from the Metadata Settings drop-down list. Enter the URL of the metadata.
If the metadata file is downloaded, then under the IdP Settings section, select Metadata File from the Metadata Settings drop-down list. Upload the metadata file.
From the Unique Name Identifier (Name ID) drop-down, select one of the following two options as the unique identifier for user authentication.
- Firstname.Lastname: A local user should be manually created having first name and last name.
- UserPrincipleName: This user can be created locally or imported from Azure AD, if user exists on Azure AD.
Click Save.
Select the Enable option to enable SAML SSO.
If you want to allow access to User Management screen, enable the Access User Management screen option.
Log out from the ESA.
Open another session on the Web browser and enter the FQDN of ESA. For example, esa.protegrity.com.
Ensure that the user session on the IdP is active. If the session is idle or inactive, then a screen to enter the IdP credentials will appear.
Click Sign in with SAML SSO.
The screen is redirected to Azure portal for authentication.
If the Azure user is not logged in, the login dialog appears. Provide the Azure user credentials for login.
If the multi-factor authentication is enabled, then provide the required authentication using the Authenticator application to proceed further.
After logging in successfully, the screen is automatically redirected to the ESA Dashboard.
4.12.2.1.4 - Implementing SSO with a Load Balancer Setup
This section describes the process of implementing SSO with a Load Balancer that is setup between the appliances.
Steps to configure SSO in a Load Balancer setup
Consider two ESA, ESA1 and ESA2, that are configured behind a load balancer. Ensure that you perform the following steps to implement it.
- Add the users to the internal LDAP and assign SSO login permissions.
- Ensure that the FQDN is resolved to the IP address of the load balancer.
Logging in with SSO
After configuring the required settings, the user enters the FQDN of load balancer on the Web browser and clicks Sign in with SAML SSO to access it. On successful authentication, the appliance Dashboard appears.
4.12.2.1.5 - Viewing Logs
You can view the logs that are generated for when the SAML SSO mechanism is utilized. The logs are generated for the following events:
- Uploading the metadata
- User logging to the ESA or DSG through SAML SSO
- Enabling or disabling SAML SSO
- Configuring the Service Provider and IdP settings
Navigate to Logs > Appliance Logs to view the logs.
You can also navigate on the Discover screen to view the logs.
4.12.2.1.6 - Feature Limitations
There are some known limitations of the SAML SSO feature.
- The Configuration export to Cluster Tasks and Export data configuration to remote appliance of the SAML SSO settings are not supported. The SAML SSO settings include the hostname, so importing the SAML settings on another machine will replace the hostname.
- After logging in to the appliance, such as, ESA or DSG, through SAML SSO, if you have the Directory Manager permissions, you can access the User Management screen. A prompt to enter the user password appears after a user management operation is performed on it. In this case, you must enter the password that you have set on the appliance. The password that is set on the IdP is not applicable here.
4.12.2.1.7 - Troubleshooting
This section describes the issues and their solutions while utilizing the SAML SSO mechanism.
| Issue | Reason | Solution |
The following message appears while logging in with SSO.Login Failure: Unauthorized to SSO Login. |
| Ensure that the following points are considered:
For more information about configuring user role, refer Importing Users and Assigning Role. |
4.13 - Sample External Directory Configurations
In appliances, the external directory servers such as, Active Directory (AD) or Oracle Directory Server Enterprise Edition (ODSEE) use the OpenLDAP protocol to authenticate users. The following sections describe the parameters that you must configure to connect with an external directory.
Sample AD configuration
The following example describes the parameters for setting up an AD connection.
LDAP Uri: ldap://192.257.50.10:389
Base DN: dc=sherwood,dc=com
Bind DN: administrator@sherwood.com
Bind Password: <Password for the Bind User>
StartTLS Method: Yes
Verify Peer: Yes
LDAP Filter: sAMAccountName
Same usernames across multiple ADs
In case of same usernames across multiple ADs, it is recommended to use LDAP Filter such as UserPrincipalName to authenticate users.
Sample ODSEE configuration
The following example describes the parameters for setting up an ODSEE connection.
Protegrity appliances support ODSEE v11.1.1.7.0
LDAP Uri: ldap://192.257.50.10:389
Base DN: dc=sherwood,dc=com
Bind DN: cn=Directory Manager or cn=admin,cn=Administrators,cn=config
Bind Password: <Password for the Bind User>
StartTLS Method: Yes
Verify Peer: Yes
LDAP Filter: User attributes such as,uid, cn, sn, and so on.
Sample SAML Configuration
The following example describes the parameters for setting up a SAML connection.
SAML Single Sign-On:
Enable: Yes
Access User Management Screen: No
Service Provider (SP) Settings:
FQDN: appliancefqdn.com
Entity ID: e595ce43-c50a-4fd2-a3ef-5a4d93a602ae
Identity Provider (IdP) Settings:
Metadata Settings: Metadata URL
Sample SAML File: FQDN_EntityID_Metadata_user_credentials 1.csv
Unique User Identifier (Name ID)
FirstName.LastName: Authentication using the format firstname.lastname.
UserPrincipleName: Authentication using the format username@domain.
Sample Kerberos Configuration
The following example describes the parameters for setting up a Kerberos connection. The Kerberos for Single Sign-On uses Simple and Protected GSSAPI Negotiation Mechanism (SPNEGO).
Kerberos for Single Sign-On using (Spnego):
Enable: Yes
Service Principal Name: *HTTP/<username>.esatestad.com@ESATESTAD.*COM
Sample Keytab File: <username> 1.keytab
Sample Azure AD Configuration
The following example describes the parameters for setting up an Azure AD connection.
Azure AD Settings: Enabled
Tenant ID: 3d45143b-6c92-446a-814b-ead9ab5c5e0b
Client ID: a1204385-00eb-44d4-b352-e4db25a55c52
Auth Type: Secret
Client Secret: xxxx
4.14 - Partitioning of Disk on an Appliance
Firmware is low-level software that is responsible for initializing the hardware components of a system during the boot process. It is required to initialize the boot process. It provides runtime services for the operating system and the programs on the system. There are two types of boot modes in the system setup, Basic Input/Output System (BIOS) and Unified Extensible Firmware Interface (UEFI).
BIOS is amongst the oldest systems used as a boot loader to perform the initialization of the hardware. UEFI is a comparatively newer system that defines a software interface between the operating system and the platform firmware. The UEFI is more advanced than the BIOS and most of the systems are built with support for UEFI and BIOS.
Disk Partitioning is a method of dividing the hard drive into logical partitions. When a new hard drive is installed on a system, the disk is segregated into partitions. These partitions are utilized to store data, which the operating system reads in a logical format. The information about these partitions is stored in the partition table.
There are two types of partition tables, the Master Boot Record (MBR) and the GUID Partition Table (GPT). These form a special boot section in the drive that provides information about the various disk partitions. They help in reading the partition in a logical manner.
Depending on the requirements, you can extend the size of the partitions in a physical volume to accommodate all the logs and other ESA related data. You can utilize the Logical Volume Manager (LVM) to increase the partitions in the physical volume. Using LVM, you can manage hard disk storage to allocate, mirror, or resize volumes.
In an ESA, the physical volume is divided into the following three logical volume groups:
| Partition | Description |
|---|---|
| Boot | Contains the boot information. |
| PTYVG | Contains the files and information about OS and logs. |
| Data Volume Group | Contains the data that is in the /opt directory. |
4.14.1 - Partitioning the OS in the UEFI Boot Option
The PTYVG volume partition is divided into three logical volumes. These are the PTYVG-OS, the PTYVG-OS_bak, and the PTYVG-LOGS volume. The PTYVG volume partition contains the OS information.
The following table illustrates the partitioning of the volumes in the PTYVG directory.
| Logical Volume | Description | Default Size |
|---|---|---|
| PTYVG-OS | The root partition | 16 GB |
| PTYVG-OS_bak | The backup for the root partition | 16 GB |
| PTYVG-LOGS | The logs that are in the /var/log directory | 12 GB |
In the UEFI mode, the sda1 is the EFI partition which stores the UEFI executables required to perform the booting process for the system. This .efi file points to the sda3 partition where the GRUB configurations are stored. The grub.cfg file initiates the boot process.
The following table illustrates the partitioning of all the logical volume groups in a single hard disk system.
Table: Partition of Logical Volume Groups
| Partition | Partition Name | Physical Volume | Volume Group | Directory | Directory Path | Size |
| /dev/sda | sda1 | EFI Partition | 400M | |||
| sda2 | 100M | |||||
| sda3 | BOOT | 900M | ||||
| sda4 | Physical Volume 1 | PTYVG | OS | / | 16G | |
| OS_bak | 16G | |||||
| logs | /var/log | 12G | ||||
| sda5 | Physical Volume 2 | PTYVG_DATA | opt | 50% of rest | ||
| opt_bak | 50% of rest |
As shown in the table, the sda1 is the EFI Partition and contains information up to 400 MB. The sda2 is the Unallocated Partition which is required for supporting the GPT and occupies 100 MB. The sda3 is the Boot Partition volume group. It can contain information up to 900 MB. The sda4 is the PTYVG partition and uses 44 GB of hard disk space to store information about the OS and the logs. The remaining partition size is allotted for the data volume group.
For Cloud-based platforms, the opt_bak and the OS_bak directories are not available in the data volume group. The data in the PTYVG_DATA partition is available in the opt directory only.
If you want to use the EFI Boot Option for the ESA, then select the required option while creating the machine.
4.14.2 - Partitioning the OS with the BIOS Boot Option
Depending on the requirements, you can extend the size of the partitions in a physical volume to accommodate all the logs and other ESA related data. You can utilize the Logical Volume Manager (LVM) to increase the partitions in the physical volume. Using LVM, you can manage hard disk storage to allocate, mirror, or resize volumes.
In an ESA, the physical volume is divided into the following three logical volume groups:
| Partition | Description |
|---|---|
| Boot | Contains the boot information |
| PTYVG | Contains the files and information about OS and logs |
| Data Volume Group | Contains the data that in the /opt directory |
The PTYVG volume partition contains the OS information. You must increase the PTYVG volume group to extend the root partition. The following table describes the different logical volumes in the PTYVG volume group.
| Logical Volume | Description | Default Size |
|---|---|---|
| OS | The root partition |
|
| OS-bak | The backup for the root partition |
|
| LOGS | The logs that are in the /var/log directory |
|
| SWAP | The swap partition |
The swap partition for ESA is 8 GB. |
The following table illustrates the partitioning of all the logical volume groups in a single hard disk system.
Table: Partition of Logical Volume Groups
| Partition | Partition Name | Physical Volume | Volume Group | Directory | Directory Path | Upgraded Appliances Size | ISO and Cloud Installation Size |
| /dev/sda | sda1 | /boot | 400M | ||||
| sda2 | 100M | ||||||
| sda3 | Physical Volume 1 | PTYVG | OS | / | 8G | 16G | |
| OS_bak | 8G | 16G | |||||
| logs | /var/log | 6G | 12 | ||||
| swap | [SWAP] | By default, 2G for appliances
products. The swap partition for ESA is 8G. | |||||
| sda4 | Physical Volume 2 | PTYVG_DATA | opt | /opt/docker/lib | 50% of rest | ||
| opt_bak | 50% of rest | ||||||
- For Cloud-based platforms, the OS_bak directory is not available in the data volume group. The data in the PTYVG partition is available in the OS directory only.
- For Cloud-based platforms, the opt_bak directory is not available in the data volume group. The data in the PTYVG_DATA partition is available in the opt directory only.
If multiple hard disks installed on an ESA, then you can select the required hard disks for configuring the OS volume and the data volume. You can also extend the OS partition or the disk partition across the hard disks that are installed on the appliance.
The following table illustrates an example of partitioning in multiple hard disks.
Table: Partitioning in Multiple Hard Drives
| Partition | Partition Name | Physical Volume | Volume Group | Directory | Directory Path | Upgraded Appliances Size | ISO and Cloud Installation Size |
| /dev/sda | sda1 | /boot | 400M | ||||
| sda2 | 100M | ||||||
| sda3 | Physical Volume 1 | PTYVG | OS | / | 8G | 16G | |
| OS_bak | 8G | 16G | |||||
| logs | /var/log | 6G | 12G | ||||
| swap | [SWAP] | By default, 2G for appliances
products. The swap partition for ESA is 8G. | |||||
| sda4 | Physical Volume 2 | PTYVG_DATA | opt | /opt/docker/lib | 50% of rest | ||
| opt_bak | 50% of rest | ||||||
| Partition | Physical Volume | Volume Group | Directory | Directory Path | Size |
| /dev/sdb | Physical Volume 1 | PTYVG_DATA | opt | /opt/docker/lib | 50% |
| opt_bak | 50% |
- For Cloud-based platforms, the OS_bak directory is not available in the data volume group. The data in the PTYVG partition is available in the OS directory only.
- For Cloud-based platforms, the opt_bak directory is not available in the data volume group. The data in the PTYVG_DATA partition is available in the opt directory only.
The hard disk, sda, contains the partitions for the root and the PTYVG volumes. The hard disk, sdb contains the partition for the data volume group.
Extending the OS partition
The following sections describe the procedures to extend the OS partition.
Before you begin
Before extending the OS partition, it is recommended to back up your ESA. It ensures that you can roll back your changes in case of an error.
When you add a new hard disk to the partition, you should restart the system. This ensures that all the hard disks appear.
- For the Cloud-based platforms, the names of the hard disks may get updated after restarting the system.
- Ensure that the you verify the names of the hard disks before proceeding further.
Starting in Single User Mode
You must load in the Single User Mode to change the kernel command line.
For Cloud-based platforms, the Single User Mode is unavailable. It is recommended to perform the following operations from the OS Console. While performing these operations, ensure that the system is accessible by only a single user.
To boot into Single User Mode:
Install a new hard disk on the ESA.
For more information about installing a new hard disk, refer here.
Boot the ESA in Single User Mode.
If the GRUB Credentials are enabled, the screen to enter the GRUB credentials appears. Enter the credentials and press ENTER.
The following screen appears.
Select Normal and press E.
The following screen appears.
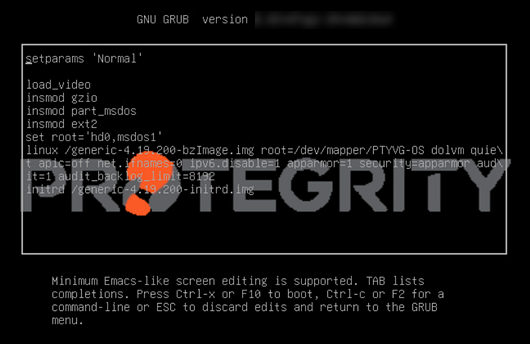
Select the linux/generic line and append <SPACE>S to the end of the line as shown in the following figure.
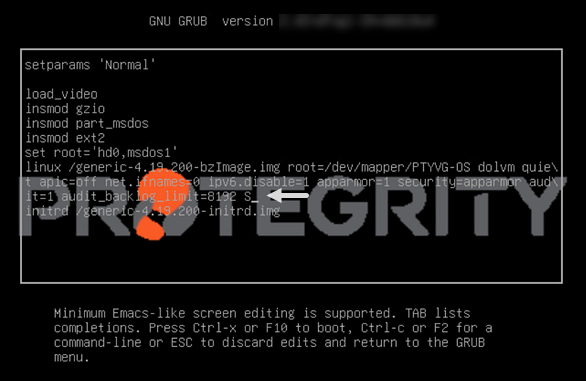
Press F10 to restart the ESA.
After the ESA is restarted, a prompt to enter the root password appears.
Enter the root password and press ENTER.
Creating a Partition
After editing the kernel command line, you must create the required partitions.
The following procedure describes how to create a partition on a new hard disk, sdb. You can add multiple hard disks to the ESA.
If you add multiple hard disks to the ESA, then the devices are created as /dev/sdb, /dev/sdc, /dev/sdd, and so on. You can select the required hard disk based on the storage space available.
For Cloud-based platforms, the names of the hard disk might differ. Based on the cloud platform, the hard disk names may appear as nvme1n1, xvdb, or so on.
To create a partition:
Run the following command to list the hard disks that are available.
lsblkRun the following command to format the partition.
fdisk /dev/sdbType o to create a partition table and press ENTER.
Type n to create a new partition and press ENTER.
Type p to create a primary partition and press ENTER.
In the following prompt, assign a partition number to the new partition.
If you want to enter the default number for the partition, then press ENTER.
Type the required starting partition sector for the partition.
If you want to enter the default sector for the partition, then press ENTER.
Type the last sector for the partition and press ENTER.
If you want to enter the default sector for the partition, then press ENTER.
Type t to change the type of the new partition and press ENTER.
Type 8e to convert the disk partition to Linux LVM and press ENTER.
Type w to save the changes and press ENTER.
A message The partition table has been altered! appears.
Run the following command to initialize the disk partition that is used with LVM.
pvcreate /dev/sdb1For Cloud-based platforms, you should use the name of the disk partition only. For instance, if the name of the hard disk on the Cloud-based platform is nvme0n1, then run the following command to initialize the disk partition that is used with LVM.
pvcreate /dev/nvme0n1If the following confirmation message appears, then press y.
WARNING: dos signature detected on /dev/sdb1 at offset 510. Wipe it? [y/n]: yA message Physical volume “/dev/sdb1” is successfully created appears.
Run the following command to extend the PTYVG volume.
vgextend PTYVG /dev/sdb1A message
Volume group “PTYVG” successfully extendedappears.
Extending the OS and the Backup Volume
After extending the PTYVG volume you can resize the OS and the OS_bak volumes using the lvextend and resize commands.
Ensure that you consider the following points before extending the partitions in the PTYVG volume group:
- Back up the OS partition before extending the partition.
- Back up the policy, LDAP, and other required data to the /opt directory before extending the volume.
The following procedure describes how to extend the OS and the OS_bak volumes by 4 GB.
Ensure that there is enough free space available while extending the size of the OS, the OS_bak, and the log volumes. For instance, if you extend the hard disk by 1 GB and if the space is less than the required level, then the following error appears.
Insufficient free space: 1024 extents needed, but only 1023 available
To resolve this error, you must increase the partition size by 0.9 GB.
To create a partition:
Run the following commands to extend the OS-bak and OS volume.
# lvextend -L +4G /dev/PTYVG/OS_bakA message Logical Volume OS_bak successfully resized appears.
Ensure that the you extend the size of the OS and the OS_bak volumes to the same value.
Run the following command to resize the file system in the OS_bak volume.
# resize2fs /dev/mapper/PTYVG-OS_bakA message resize2fs: On-Line resizing finished successfully appears.
Run the following commands to extend the OS volume.
# lvextend -L +4G /dev/PTYVG/OSA message Logical Volume OS successfully resized appears.
Run the following command to resize the file system in the OS volume.
# resize2fs /dev/mapper/PTYVG-OSA message resize2fs: On-Line resizing finished successfully appears.
Restart the ESA.
Extending the Logs Volume
You can resize the logs volume using the lvextend and resize commands. This ensures that you provision the required space for the logs that are generated. You must back up the current logs to the /opt directory before extending the logs volume.
Before extending the logs volume, ensure that you start the ESA in Single User Mode and create a partition.
For more information about Single User Mode, refer here.
For more information about creating a partition, refer here.
The following procedure describes how to extend the logs volume by 4 GB.
To extend the logs volume:
Run the following commands to create a temporary folder in the /opt directory.
# mkdir /opt/tmp/logsRun the following command to copy the files from the logs volume to the /opt directory.
# /usr/bin/rsync -axzHS --delete-before /var/log/ /opt/tmp/logs/While copying the logs from the /var/log/ directory to the /opt directory, ensure that the space available in the /opt directory is more than the size of the logs.
Run the following commands to extend the logs volume.
# lvextend -L +4G /dev/PTYVG/logsA message Logical Volume logs successfully resized appears.
Run the following command to resize the file system in the logs volume.
# resize2fs /dev/mapper/PTYVG-logsA message resize2fs: On-Line resizing finished successfully appears.
Run the following command to copy the files from /opt directory to the logs volume.
# /usr/bin/rsync -axzHS --delete-before /opt/tmp/logs/ /var/log/Run the following command to remove the temporary folder created in the /opt directory.
# rm -r /opt/tmp/logsRestart the ESA.
4.15 - Working with Keys
The Protegrity Data Security platform uses many keys to protect your sensitive data. The Protegrity Key Management solution manages these keys and this system is embedded into the fabric of the Protegrity Data Security Platform. For example, creating a cryptographic or data protection key is a part of the process of defining the way sensitive data is to be protected. There is not a specific user visible function to create a data protection key.
With key management as a part of the platform’s core infrastructure, the security team can focus on protecting data and not the low-level mechanics of key management. This platform infrastructure-based key management technique eliminates the need for any human to be a custodian of keys. This holds true for any of the functions included in key management.
The keys that are part of the Protegrity Key Management solution are:
Key Encryption Key (KEK): The cryptographic key used to protect other keys. The KEKs are categorized as follows:
- Master Key - It protects the Data Store Keys and Repository Key. In the ESA, only one active Master Key is present at a time.
- Repository Key - It protects policy information in the ESA. In the ESA, only one active Repository Key is present at a time.
- Data Store Key - It encrypts the audit logs on the protection endpoint. In the ESA, multiple active Data Store Keys can be present at a time. This key applies only to v8.0.0.0 and earlier protector versions.
Signing Key: The protector utilizes the Signing Key to sign the audit logs for each data protection operation. The signed audit log records are then sent to the ESA, which authenticates and displays the signature details received for the log records.
For more information about the signature details for the log records, refer to the Protegrity Log Forwarding Guide 9.2.0.0.
Data Encryption Key (DEK): The cryptographic key used to encrypt the sensitive data for the customers.
Codebooks: The lookup tables used to tokenize the sensitive data.
For more information about managing keys, refer to the Protegrity Key Management Guide 9.2.0.0.
4.16 - Working with Certificates
Digital certificates are used to encrypt online communication and authentication between two entities. For two entities exchanging sensitive information, the one that initiates the request for exchange can be called the client and the one that receives the request and constitutes the other entity can be called the server.
The authentication of both the client and the server involves the use of digital certificates issued by the trusted Certificate Authorities (CAs). The client authenticates itself to a server using its client certificate. Similarly, the server also authenticates itself to the client using the server certificate. Thus, certificate-based communication and authentication involves a client certificate, server certificate, and a certifying authority that authenticates the client and server certificates.
Protegrity client and server certificates are self-signed by Protegrity. However, you can replace them by certificates signed by a trusted and commercial CA. These certificates are used for communication between various components in ESA.
The certificate support in Protegrity involves the following:
ESA supports the upload of certificates with strength equal to 4096 bits. You can upload a certificate with strength less than 4096 bits but the system will show you a warning message. Custom certificates for Insight must be generated using a 4096 bit key.
The ability to replace the self-signed Protegrity certificates with the CA based certificates.
The retrieval of username from client certificates for authentication of user information during policy enforcement.
The ability to download the server’s CA certificate and upload it to a certificate trust store to trust the server certificate for communication with ESA.
The various components within the Protegrity Data Security Platform that communicate with and authenticate each other through digital certificates are:
- ESA Web UI and ESA
- ESA and Protectors
- Protegrity Appliances and external REST clients

As illustrated in the figure, the use of certificates within the Protegrity systems involves the following:
Communication between ESA Web UI and ESA
In case of a communication between the ESA Web UI and ESA, ESA provides its server certificate to the browser. In this case, it is only server authentication that takes place in which the browser ensures that ESA is the trusted server.
Communication between ESA and Protectors
In case of a communication between ESA and Protectors, certificates are used to mutually authenticate both the entities. The server and the client i.e. ESA and the Protector respectively ensure that both are trusted entities. The Protectors could be hosted on customer business systems or it could be a Protegrity Appliance.
Communication between Protegrity Appliances and external REST clients
Certificates ensure the secure communication between the customer client and Protegrity REST server or between the customer client and the customer REST server.
4.17 - Managing policies
The policy each organization creates within ESA is based on requirements with relevant regulations. A policy helps to determine, specify and enforce certain data security rules. These data security rules are as shown in the following figure.
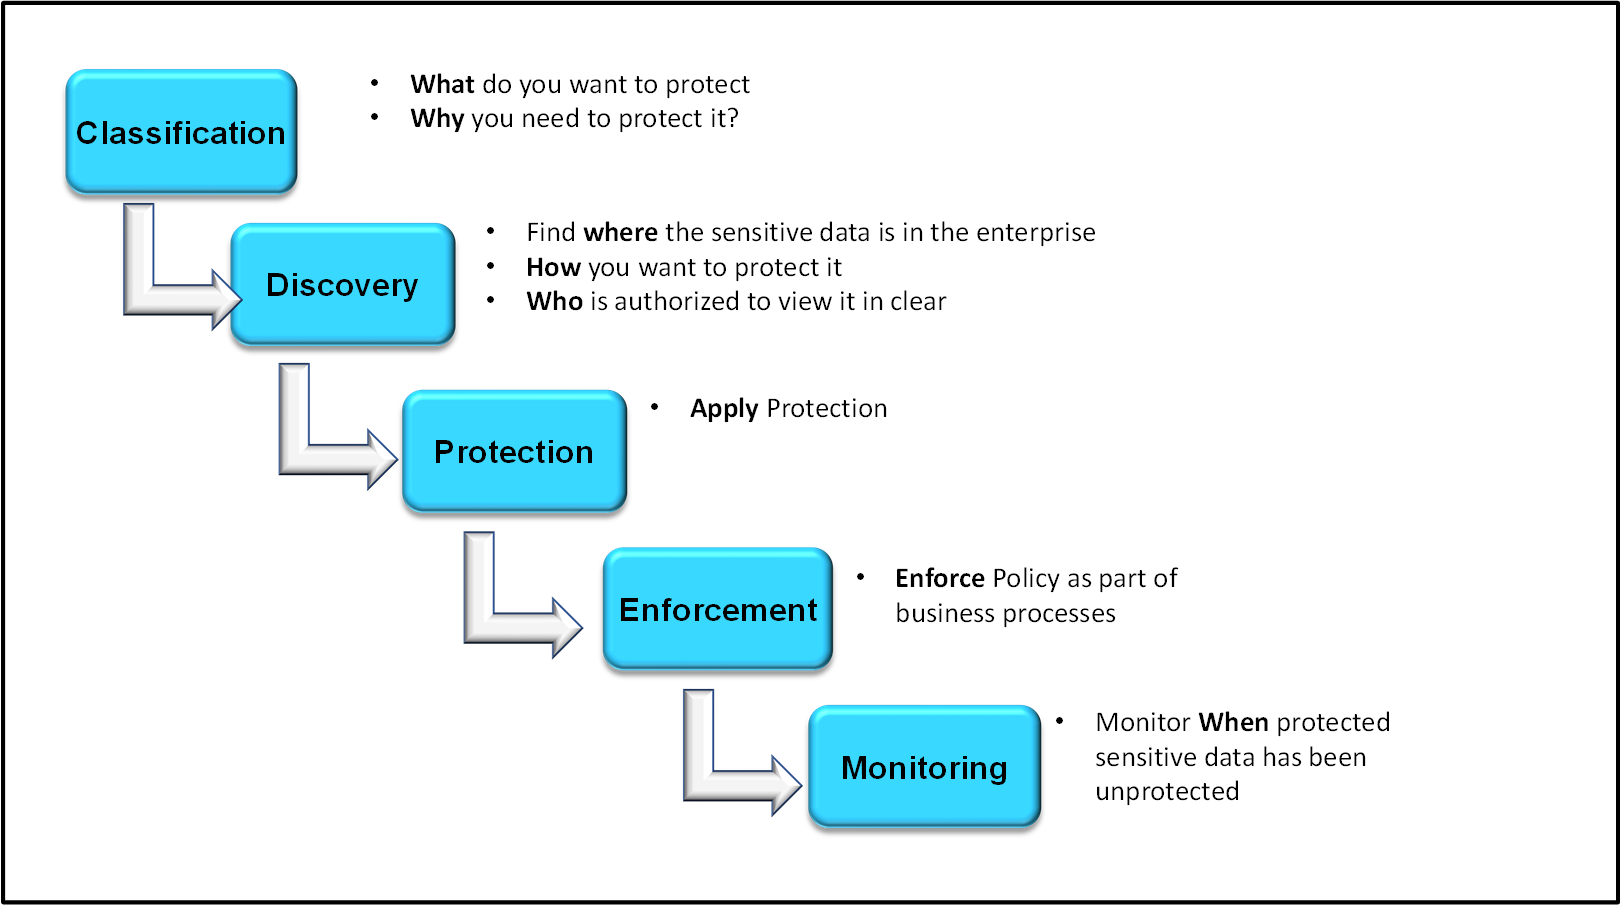
Classification
This section discusses about the classification of Policy Management in ESA.
What do you want to protect?
The data that is to be protected needs to be classified. This step determines the type of data that the organization considers sensitive. The compliance or security team will choose to meet certain standard compliance requirements with specific law or regulation, such as the Payment Card Industry Data Security Standard (PCI DSS) or the Health Information Portability and Accessibility Act (HIPAA).
In ESA, you classify the sensitive data fields by creating ‘Data Elements’ for each field or type of data.
Why do you need to protect?
The fundamental goal of all IT security measures is the protection of sensitive data. The improper disclosure of sensitive data can cause serious harm to the reputation and business of the organization. Hence, the protection of sensitive data by avoiding identity theft and protecting privacy is for everyone’s advantage.
Discovery
This section discusses about the discovery of Policy Management in ESA.
Find where the data is located in the enterprise
The data protection systems are the locations in the enterprise to focus on as the data security solution is designed. Any data security solution identifies the systems that contains the sensitive data.
How you want to protect it?
Data protection has different scenarios which require different forms of protection. For example, tokenization is preferred over encryption for credit card protection. The technology used must be understood to identify a protection method. For example, if a database is involved, Protegrity identifies a Protector to match up with the technology used to achieve protection of sensitive data.
Who is authorized to view it in the clear?
In any organization, the access to unprotected sensitive data must be given only to the authorized stakeholders to accomplish their jobs. A policy defines the authorization criteria for each user. The users are defined in the form of members of roles. A level of authorization is associated with each role which assigns data access privileges to all members in the role.
Protection
The Protegrity Data Security Platform delivers the protection through a set of Data Protectors. The Protegrity Protectors meet the governance requirements to protect sensitive data in any kind of environment. ESA delivers the centrally managed policy set and the Protectors locally enforce them. It also collects audit logs of all activity in their systems and sends back to ESA for reporting.
Enforcement
The value of any company or its business is in its data. The company or business suffers serious issues if an unauthorized user gets access to the data. Therefore, it becomes necessary for any company or business to protect its data. The policy is created to enforce the data protection rules that fulfils the requirements of the security team. It is deployed to all Protegrity Protectors that are protecting sensitive data at protection points.
Monitoring
As a policy is enforced, the Protegrity Protectors collects audit logs in their systems and reports back to ESA. Audit logs helps to capture authorized and unauthorized attempts to access sensitive data at all protection points. It also captures logs on all changes made to policies. You can specify what types of audit records are captured and sent back to ESA for analysis and reporting.
4.18 - Working with Insight
4.18.1 - Understanding the Audit Store node status
Viewing cluster status
The Overview screen shows information about the Audit Store cluster. Use this information to understand the health of the Audit Store cluster. Access the Overview screen by navigating to Audit Store > Cluster Management > Overview. The Overview screen is shown in the following figure.
The following information is shown on the Overview screen:
- Join Custer: Click to add a node to the Audit Store cluster. The node can be added to only one Audit Store cluster. On a multi-node cluster, this button is disabled after the node is added to the Audit Store cluster.
- Leave Cluster: Click to remove a node from the Audit Store cluster. This button is disabled after the node is removed from an Audit Store cluster.
- Cluster Name: The name displays the Audit Store cluster name.
- Cluster Status: The cluster status displays the index status of the worst shard in the Audit Store cluster. Accordingly, the following status information appears:
- Red status indicates that the specific shard is not allocated in the Audit Store cluster.
- Yellow status indicates that the primary shard is allocated but replicas are not allocated.
- Green status indicates that all shards are allocated.
- Number of Nodes: The count of active nodes in the Audit Store cluster.
- Number of Data Nodes: The count of nodes that have a data role.
- Active Primary Shards: The count of active primary shards in the Audit Store cluster.
- Active Shards: The total of active primary and replica shards.
- Relocating Shards: The count of shards that are being relocated.
- Initializing Shards: The count of shards that are under initialization.
- Unassigned Shards: The count of shards that are not allocated. The Audit Store will process and dynamically allocate these shards.
- OS Version: The version number of the OpenSearch used for the Audit Store.
- Current Master: The IP address of the current Audit Store node that is elected as master.
- Indices Count: The count of indices in the Audit Store cluster.
- Total Docs: The document count of all indices in the Audit Store cluster, excluding security index docs.
- Number of Master Nodes: The count of nodes that have the master-eligible role.
- Number of Ingest Nodes: The count of nodes that have the ingest role.
For more information about clusters, shards, docs, and other terms, refer to the OpenSearch documentation.
Viewing the node status
The Nodes tab on the Overview screen shows the status of the nodes in the Audit Store cluster. This tab displays important information about the node. The Nodes tab is shown in the following figure.
The following information is shown on the Nodes tab:
- Node IP: The IP address of the node.
- Role: The roles assigned to the node. By default, nodes are assigned all the roles. The following roles are available:
- Master: This is the master-eligible role. The nodes having this role can be elected as the cluster master to control the Audit Store cluster.
- Data: The nodes having the data role hold data and perform data-related operations.
- Ingest: The nodes having the ingest role process the logs received before the logs are stored in the Audit Store.
- Action: The button to edit the roles for the current node. For more information about roles, refer to Working with Audit Store roles.
- Name: The name for the node.
- Up Time: The uptime for the node.
- Disk Total (Bytes): The total disk space in bytes.
- Disk Used (Bytes): The disk space used in bytes.
- Disk Avail (Bytes): The available disk space in bytes.
- RAM Max (Bytes): The total RAM available in bytes.
- RAM Current (Bytes): The current RAM used in bytes.
Viewing the index status
The Indices tab on the Overview screen shows the status of the indexes on the Audit Store cluster. This tab displays important information about the indexes. The Indices tab is shown in following figure.

The following information is shown on the Indices tab:
- Index: The index name.
- Doc Count: The number of documents in the index.
- Health Status: The index health per index. The index level health status is controlled by the worst shard status. Accordingly, the following status information appears:
- Red status indicates that the specific shard is not allocated in the Audit Store cluster.
- Yellow status indicates that the primary shard is allocated but replicas are not allocated.
- Green status indicates that all shards are allocated.
- Pri Store Size (Bytes): The primary store size in bytes for all shards, including shard replicas of the index.
- Store Size (Bytes): The total store size in bytes for all shards, including shard replicas of the index.
4.18.2 - Working with Audit Store nodes

Registering a node
When a node that was a part of the Audit Store cluster was down or unregistered is started again, then it would already have the Audit Store configurations. Similarly, due to issues during an upgrade, a node might not complete the Audit Store cluster registration process. In this case, the node appears with an orange icon (![]() ). Register the node using the Register button to add the node to the Audit Store cluster.
). Register the node using the Register button to add the node to the Audit Store cluster.
Perform the following steps to register a node:
Navigate to Audit Store > Cluster Management > Overview > Nodes.
Click Register (
 ).
).The node will be a part of the cluster and a black node icon (
 ) will appear.
Unregistering a node
When a node goes down, such as due to a crash or for maintenance, then the node is greyed out (![]() ). Additionally, if a node gets corrupted, then it is not possible to log in to the node to remove it from the Audit Store cluster. In these case, disconnect the node from the cluster using the Unregister button. A disconnected node can be added back to the cluster later, if required.
). Additionally, if a node gets corrupted, then it is not possible to log in to the node to remove it from the Audit Store cluster. In these case, disconnect the node from the cluster using the Unregister button. A disconnected node can be added back to the cluster later, if required.
Perform the following steps to remove the disconnected node:
Navigate to Audit Store > Cluster Management > Overview > Nodes.
Click Unregister (
 ).
).The node will still be a part of the cluster, however, it will not be visible in the list.
4.18.3 - Working with Audit Store roles
A node can have one role or multiple roles. A cluster needs at least one node with each role. Hence, roles of the node in a single-node cluster cannot be removed. Similarly, if the node is the last node in the cluster with a particular role, then the role cannot be removed. By default, all the nodes must have the master-eligible, data, and ingest roles:
- Master-eligible: This is the master-eligible node. It is eligible to be elected as the master node that controls the Audit Store cluster. A minimum of 3 nodes with the master-eligible role are required in the cluster to make the Audit Store cluster stable and resilient. For mor iformation about the architecture, refer to the Logging architecture.
- Data: This node holds data and can perform data-related operations. A minimum of 2 nodes with the data role are required in the Audit Store cluster to provide redundancy of data. Redundancy reduces data loss when a node goes down.
- Ingest: This node processes logs received before the log is indexed for further storage and processing. A minimum of 2 nodes with the ingest role are required in the Audit Store cluster.
The Audit Store uses the following formula to determine the minimum number of nodes with the Master-eligible role that should be running in the cluster:
Minimum number of running nodes with the Master-eligible role in a cluster:
(Total number of nodes with the Master-eligible role in a cluster / 2) + 1
For example, if the cluster has 5 nodes that have the Master-eligible role, then the minimum number of nodes with the Master-eligible role that needs to be running for the cluster to remain functional is 3. If there are fewer than 3 nodes available, the cluster might not be able to promote any nodes to Master if multiple Master nodes fail.
An Audit Store cluster must have a minimum of 3 nodes with the Master-eligible role due to following scenarios:
- 1 master-eligible node: If the only node is present with the Master-eligible role, then it is elected the Master, by default, because it is the only node with the required Master-eligible role. In this case, if the node becomes unavailable due to some failure, then the cluster becomes unstable as there is no additional node with the Master-eligible role.
- 2 master-eligible nodes: A cluster where only 2 nodes have the Master-eligible role will both have the Master-eligible role at the minimum to be up and running for the cluster to remain functional. If any one of those nodes becomes unavailable due to some failure, then the minimum condition for the nodes with the Master-eligible role is not met.
- 3 master-eligible nodes and above: In this case, if any one node goes down, then the cluster can still remain functional because this cluster requires two nodes with the Master-eligible role to be running at the minimum, as per the minimum Master-eligible role formula.
For more information about node and roles, refer to https://opensearch.org/docs/2.18/tuning-your-cluster/.
Based on the requirements, modify the roles of a node using the following steps.
Log in to the Web UI of the system to change the role.
Click Audit Store > Cluster Management > Overview to open the Audit Store clustering page.

Click Edit Roles.
Select the check box to add a role. Alternatively, clear the check box to remove a role.

Click Update Roles.
Click Dismiss in the message box that appears after the role update.
4.18.4 - Working with Discover
For more information about Discover, refer to https://opensearch.org/docs/2.18/dashboards/.
Viewing logs
The logs aggregated and collected are sent to Insight. Insight stores the logs in the Audit Store. The logs from the Audit Store are displayed on the Audit Store Dashboards. Here, the different fields and the data logged is visible. In addition to viewing the data, these logs serve as input for Analytics to analyze the health of the system and to monitor the system for providing security.
View the logs by logging into the ESA and navigating to Audit Store > Dashboard > Open in new tab, from the menu, select Discover, and select a time period such as Last 30 days.
Use the default index pty_insight_*audit* to view the log data. This default index pattern uses wildcard charaters for referencing all indexes. Alternatively, select an index pattern or alias for the entries to view the data from a different index. For more information about the indexes available, refer to Understanding the Insight indexes.
You can create and delete indexes. Before deleting an index, it is highly recommended to back it up first. After an index is deleted, the data associated with it is permanently removed, and without a backup, there is no way to recover it. For more information about indexes, refer to https://opensearch.org/docs/2.18/im-plugin/ and https://opensearch.org/docs/2.18/dashboards/. For more information about managing indexes in ESA, refer to Index lifecycle management (ILM).

Saved queries
Run a query and customize the log details displayed. Save the query and the settings for running a query, such as, the columns, row count, tail, and indexes for the query. The saved queries created are user-specific.
From Discover, click Open to use the following saved queries to view information:
- Policy: This query is available to view policy logs. A policy log is a created during the the policy creation, policy deployment, policy enforcement, and during the collection, storage, forwarding, and analysis of logs.
- Security: This query is available to view security operation logs. A security log is created during various security operations performed by protectors, such as, performing protect, unprotect, and reprotect operations.
- Unsuccessful Security Operations: This query is available to view unsuccessful security operation-related logs. Unsuccessful Security Operations logs are created when security operations fail due to errors, warnings, or exceptions.

In ESA, navigate to Audit Store > Dashboard > Open in new tab, select Discover from the menu, and optionally select a time period such as Last 30 days..
The viewer role user or a user with the viewer role can only view and run saved queries. Admin rights are required to create or modify query filters.

Select the index for running the query.
Enter the query in the Search field.
Optionally, select the required fields.
Click the See saved queries (
 ) icon to save the query.
The Saved Queries list appears.

Click Save current query.
The Save query dialog box appears.

Specify a name for the query.
Click Save to save the query information, including the configurations specified, such as, the columns, row count, tail, indexes, and query.
The query is saved.
Click the See saved queries (
 ) icon to view the saved queries.
4.18.5 - Overview of the dashboards
Viewing the graphs provides an easier and faster method for reading the log information. This helps understand the working of the system and also take decisions faster, such as, understanding the processing load on the ESAs and accordingly expanding the cluster by adding nodes, if required.
For more information about the dashboards, navigate to https://opensearch.org/docs/2.18/dashboards/.
Accessing the Insight Dashboards
The Insight Dashboards appears on a separate tab from the ESA Web UI. However, it uses the same session as the ESA Web UI. Signing out from the ESA Web UI also signs out from the Insight Dashboards. Complete the steps provided here to view the Insight Dashboards.
Log in to the ESA Web UI.
Click Audit Store > Dashboard. If pop-ups are blocked in the browser, click Open in a new tab to view the Audit Store Dashboards, also known as Insight Dashboards.
The Audit Store Dashboards is displayed in a new tab of the browser.

Overview of the Insight Dashboards Interface
An overview of the various parts of the Insight Dashboards, also known as the Audit Store Dashboards, is provided here.
For more information about the dashboard elements, refer to https://opensearch.org/docs/2.18/dashboards/dashboard/index/.
The Audit Store Dashboard appears as shown in the following figure.

The following components are displayed on the screen.
| Callout | Element | Description |
|---|---|---|
| 1 | Navigation panel | The menu displays the different Insight applications, such as, dashboards, reports, and alerts. |
| 2 | Search bar | The search bar helps find elements and run queries. Use filters to narrow the search results. For more information about building queries, refer to https://opensearch.org/docs/2.18/dashboards/dql/. |
| 3 | Bread crumb | The menu is used to quickly navigate across screens. |
| 4 | Panel | The stage is the area to create and view visualizations and log information. |
| 5 | Toolbar | The toolbar lists the commands and shortcuts for performing tasks. |
| 6 | Time filter | The time filter specifies the time window for viewing logs. Update the filter if logs are not visible. Use the Quick Select menu to select predefined time periods. |
| 7 | Refresh button | The Refresh button refreshes the information on the page. Use this button to refresh the query results after updating the query parameters, such as, applying time filters. |
| 8 | Help | The help menu provides access to the online documentation that is provided by OpenSearch and to view the OpenSearch community forums. The Open an issue in GitHub link allows you to submit issue requests to OpenSearch. |
Accessing the help
The Insight Dashboard helps visualize log data and information. Use the help documentation provided by Insight to configure and create visualizations.
To access the help:
Open the Audit Store Dashboards.
Click the Help icon from the upper-right corner of the screen.
Click Documentation.
Alternatively, navigate to https://opensearch.org/docs/2.18/dashboards/.
4.18.6 - Viewing the dashboards
The configuration of dashboards created in the earlier versions of Insight Dashboards are retained after the ESA is upgraded. Protegrity provides default dashboards with version 10.1.0. If the title of an existing dashboard matches the new dashboard provided by Protegrity, then a duplicate entry is visible. Use the date and time stamp to identify and rename the earlier dashboards. The Protector status interval is used for presenting the data on some dashboards. The information presented on the dashboard might not have the correct values if the interval is updated.
The dashboards are build using visualization. Use the information from Viewing visualizations and Viewing visualization templates to customize and build dashboards.
Do not clone, delete, or modify the configuration or details of the dashboards that are provided by Protegrity. To create a customized dashboard, first clone and customize the required visualizations, then create a dashboard, and place the customized visualizations on the dashboard.
To view a dashboard:
Log in to the ESA.
Navigate to Audit Store > Dashboard.
From the navigation panel, click Dashboards.
Click the dashboard.
Viewing the Security Operation Dashboard
The security operation dashboard displays the counts of individual and total number of security operations for successful and unsuccessful operations. The Security Operation Dashboard has a table and pie charts that summarizes the security operations performed by a specific data store, protector family, and protector vendor. This dashboard shows different visualizations for the Successful Security Operations, Security Operations, Reprotect Counts, Successful Security Operation Counts, Security Operation Counts, Security Operation Table, and Unsuccessful Security Operations.
This dashboard cannot be deleted. The dashboard is shown in the following figure.

The dashboard has the following panels:
- Total Security Operations: Displays pie charts for for the successful and unsuccessful security operations:
- Successful: Total number of security operations that succeeded.
- Unsuccessful: Total number of security operations that was unsuccessful.
- Successful Security Operations: Displays pie chart for the following security operation:
- Protect: Total number of protect operations.
- Unprotect: Total number of unprotect operations.
- Reprotect: Total number of reprotect operations.
- Unsuccessful Security Operations: Displays pie chart for the following security operation:
- Error: Total number of operations that were unsuccessful due to an error.
- Warning: Total number of operations that were unsuccessful due to a warning.
- Exception: Total number of operations that were unsuccessful due to an exception.
- Total Security Operation Values: Displays the following information
- Successful - Count: Total number of security operations that succeeded.
- Unsuccessful - Count: Total number of security operations that were unsuccessful.
- Successful Security Operation Values: Displays the following information:
- Protect - Count: Total number of protect operations.
- Unprotect - Count: Total number of unprotect operations.
- Reprotect - Count: Total number of reprotect operations.
- Unsuccessful Security Operation Values: Displays the following information:
- ERROR - Count: Total number of error logs.
- WARNING - Count: Total number of warning logs.
- EXCEPTION - Count: Total number of exception logs.
- Security Operation Table: Displays the number of security operations done for a data store, protector family, protector vendor, and protector version.
- Unsuccessful Security Operations: Displays a list of unsuccessful security operations with details, such as, time, data store, protector family, protector vendor, protector version, IP, hostname, level, count, description, and source.
Viewing the Protector Inventory Dashboard
The protector inventory dashboard displays protector details connected to the ESA through bar graphs and tables. This dashboard has the Protector Family, Protector Version, Protector Count, and Protector List visualizations. It is useful for understanding information about the installed Protectors.
Only protectors that perform security operations show up on the dashboard. Updating the IP address or the hostname of the Protector shows the old and new entry for the protector.
This dashboard cannot be deleted. The dashboard is shown in the following figure.

The dashboard has the following panels:
- Protector Family: Displays bar charts with information for the protector family based on the installation count of the protector.
- Protector Version: Displays bar charts with information of the protector version based on the installation count of the protector.
- Protector Count: Displays the count of the deployed protectors for the corresponding Protector Family, Protector Vendor, and Protector Version.
- Protector List: Displays the list of protectors installed with information, such as, Protector Vendor, Protector Family, Protector Version, Protector IP, Hostname, Core Version, PCC Version, and URP count. The URP shows the security operations performed, that is, the unprotect, reprotect, and protect operations.
Viewing the Protector Status Dashboard
The protector status dashboard displays the protector connectivity status through a pie chart and a table visualization. This information is available only for v10.0.0 and later protectors. Logs from earlier protector versions are not available for the dashboards due to differences between the log formats. It is useful for understanding information about the installed v10.0.0 protectors. This dashboard uses status logs sent by the protector, so the protector which performed at least one security operation shows up on this dashboard. A protector is shown in one of the following states on the dashboard:
- OK: The latest logs are sent from the protector to the ESA within the last 15 minutes.
- Warning: The latest logs sent from the protector to the ESA are within the last 15 and 60 minutes.
- Error: The latest logs sent from the protector to the ESA are more than 60 minutes.
Updating the IP address or the hostname of the protector shows the old and new entry for the protector.
This dashboard shows the v10.0.0 protectors that are connected to the ESA. The status of earlier protectors is available by logging into the ESA and navigating to Policy Management > Nodes.
This dashboard cannot be deleted. The dashboard is shown in the following figure.

The dashboard has the following panels:
- Connectivity status pie chart: Displays a pie chart of the different states with the number of protectors that are in each state.
- Protector Status: Displays the list of protectors connectivity status with information, such as, Datastore, Node IP, Hostname, Protector Platform, Core Version, Protector Vendor, Protector Family, Protector Version, Status, and Last Seen.
Viewing the Policy Status Dashboard
The policy status dashboard displays the Policy and Trusted Application connectivity status with respective to a DataStore. The status information, on this dashboard, is updated every 10 minutes. It is useful to understand deployment of the DataStore on all protector nodes. This dashboard displays the Policy deploy Status, Trusted Application deploy status, Policy Deploy details, and Trusted Application details visualizations. This information is available only for v10.0.0 and later protectors. Logs from earlier protector versions are not available for the dashboards due to compatibility issues between the log formats.
The policy status logs are sent to Insight. These logs are stored in the policy status index that is pty_insight_analytics_policy. The policy status index is analyzed using the correlation ID to identify the unique policies received by the ESA. The time duration and the correlation ID are then analyzed for determining the policy status.
The dashboard uses status logs sent by the protectors about the deployed policy, so the Policy or Trusted Application used for at least one security operation shows up on this dashboard. A Policy and Trusted Application can be shown in one of the following states on the dashboard:
- OK: The latest correlation value of the logs sent for the Policy or Trusted Application to the ESA are within the last 15 minutes.
- Warning: The latest correlation value of the logs sent for the Policy or Trusted Application to the ESA are more than 15 minutes.
This dashboard cannot be deleted. The dashboard is shown in the following figure.

The dashboard has the following panels:
- Policy Deploy Status: Displays a pie chart of the different states with the number of policies that are in each state.
- Trusted Application Status: Displays a pie chart of the different states with the number of trusted applications that are in each state.
- Policy Deploy Details: Displays the list of policies and details, such as, Datastore Name, Node IP, Hostname, Last Seen, Policy Status, Process Name, Process Id, Platform, Core Version, PCC Version, Vendor, Family, Version, Deployment Time, and Policy Count.
- Trusted Application Details: Displays the list of policies for Trusted Applications and details, such as, Datastore Name, Node IP, Hostname, Last Seen, Policy Status, Process Name, Process Id, Platform, Core Version, PCC Version, Vendor, Family, Version, Authorize Time, and Policy Count.
Data Element Usage Dashboard
The dashboard shows the security operation performed by users according to data elements. It displays the top 10 data elements used for the top five users.
The following visualizations are displayed on the dashboard:
- Data Element Usage Intensity Of Users per Protect operation
- Data Element Usage Intensity Of Users per Unprotect operation
- Data Element Usage Intensity Of Users per Reprotect operation
The dashboard is displayed in the following figure.

Sensitive Activity Dashboard
The dashboard shows the daily count of security events by data elements for specific time period.
The following visualization is displayed on the dashboard:
- Sensitive Activity By Date
The dashboard is displayed in the following figure.

Server Activity Dashboard
The dashboard shows the daily count of all events by servers for specific time period. The older Audit index entries are not displayed on a new installation.
The following visualizations are displayed on the dashboard:
- Server Activity of Troubleshooting Index By Date
- Server Activity of Policy Index By Date
- Server Activity of Audit Index By Date
- Server Activity of Older Audit Index By Date
The dashboard is displayed in the following figure.

High & Critical Events Dashboard
The dashboard shows the daily count of system events of high and critical severity for selected time period. The older Audit index entries are not displayed on a new installation.
The following visualizations are displayed on the dashboard:
- System Report - High & Critical Events of Troubleshooting Index
- System Report - High & Critical Events of Policy Index
- System Report - High & Critical Events of Older Audit Index
The dashboard is displayed in the following figure.

Unauthorized Access Dashboard
The dashboard shows the cumulative counts of unauthorized access and activity by users into Protegrity appliances and protectors.
The following visualization is displayed on the dashboard:
- Unauthorized Access By Username
The dashboard is displayed in the following figure.

User Activity Dashboard
The dashboard shows the cumulative transactions performed by users over a date range.
The following visualization is displayed on the dashboard:
- User activity across Date range
The dashboard is displayed in the following figure.

4.18.7 - Viewing visualizations
The configuration of visualizations created in the earlier versions of the Audit Store Dashboards are retained after the ESA is upgraded. Protegrity provides default visualizations with version 10.1.0. If the title of an existing visualization matches the new visualization provided by Protegrity, then a duplicate entry is visible. Use the date and time stamp to identify and rename the existing visualizations.
Do not delete or modify the configuration or details of the visualizations provided by Protegrity. To customize the visualization, create a copy of the visualization and perform the customization on the copy of the visualization.
To view visualizations:
Log in to the ESA.
Navigate to Audit Store > Dashboard.
The Audit Store Dashboards appear in a new window. Click Open in a new tab if the dashboard is not displayed.
From the navigation panel, click Visualize.
Create and view visualizations from here.
Click a visualization to view it.
User Activity Across Date Range
Description: The user activity during the date range specified.
- Type: Heat Map
- Filter: Audit Index Logtypes
- Configuration:
- Index: pty_insight_*audit*
- Metrics:
- Value: Sum
- Field: cnt
- Buckets:
- X-axis
- Aggregation: Date Histogram
- Field: origin.time_utc
- Minimum interval: Day
- Y-axis
- Sub aggregation: Terms
- Field: protection.policy_user.keyword
- Order by: Metric:Sum of cnt
- Order: Descending
- Size: 1
- Custom label: Policy Users
- X-axis

Sensitive Activity by Date
Description: The data element usage on a daily basis.
- Type: Line
- Filter: Audit Index Logtypes
- Configuration:
- Index: pty_insight_*audit*
- Metrics: Y-axis: Count
- Buckets:
- X-axis
- Aggregation: Date Histogram
- Field: origin.time_utc
- Minimum interval: Day
- Custom label: Date
- Split series
- Sub aggregation: Terms
- Field: protection.dataelement.keyword
- Order by: Metric:Count
- Order: Descending
- Size: 10
- Custom label: Operation Count
- X-axis

Unauthorized Access By Username
Description: Top 10 Unauthorized Protect and Unprotect operation counts per user.
- Type: Vertical Bar
- Filter 1: Audit Index Logtypes
- Filter 2: protection.audit_code: 3
- Configuration:
- Index: pty_insight_*audit*
- Metrics: Y-axis: Count
- Buckets:
- X-axis
- Aggregation: Terms
- Field: protection.policy_user.keyword
- Order by: Metric:Count
- Order: Descending
- Size: 10
- Custom label: Top 10 Policy Users
- Split series
- Sub aggregation: Filters
- Filter 1-Protect: level=‘Error’
- Filter 2-Unprotect: level=‘WARNING’
- X-axis

System Report - High & Critical Events of Audit Indices
Description: The chart reporting high and critical events from the Audit index.
- Type: Vertical Bar
- Filter: Severity Level : (High & Critical)
- Configuration:
- Index: pty_insight_analytics*audits_*
- Metrics: Y-axis: Count
- Buckets:
- X-axis
- Aggregation: Date Histogram
- Field: origin.time_utc
- Minimum Interval: Auto
- Custom label: Date
- Split series
- Sub aggregation: Terms
- Field: level.keyword
- Order by: Metric:Count
- Order: Descending
- Size: 20
- Split series
- Sub aggregation: Terms
- Field: origin.hostname.keyword
- Order by: Metric:Count
- Order: Descending
- Size: 50
- Custom label: Server
- X-axis

System Report - High & Critical Events of Policy Logs Index
Description: The chart reporting high and critical events from the Policy index.
- Type: Vertical Bar
- Filter: Severity Level : (High & Critical)
- Configuration:
- Index: pty_insight_analytics*policy_log_*
- Metrics: Y-axis: Count
- Buckets:
- X-axis
- Aggregation: Date Histogram
- Field: origin.time_utc
- Minimum Interval: Auto
- Custom label: Date
- Split series
- Sub aggregation: Terms
- Field: level.keyword
- Order by: Metric:Count
- Order: Descending
- Size: 20
- Split series
- Sub aggregation: Terms
- Field: origin.hostname.keyword
- Order by: Metric:Count
- Order: Descending
- Size: 50
- Custom label: Server
- X-axis

System Report - High & Critical Events of Troubleshooting Logs Index
Description: The chart reporting high and critical events from the Troubleshooting index.
- Type: Vertical Bar
- Filter: Severity Level : (High & Critical)
- Configuration:
- Index: pty_insight_analytics*troubleshooting_*
- Metrics: Y-axis: Count
- Buckets:
- X-axis
- Aggregation: Date Histogram
- Field: origin.time_utc
- Minimum Interval: Auto
- Custom label: Date
- Split series
- Sub aggregation: Terms
- Field: level.keyword
- Order by: Metric:Count
- Order: Descending
- Size: 20
- Split series
- Sub aggregation: Terms
- Field: origin.hostname.keyword
- Order by: Metric:Count
- Order: Descending
- Size: 50
- Custom label: Server
- X-axis

Data Element Usage Intensity Of Users per Protect operation
Description: The chart shows the data element usage intensity of users per protect operation. It displays the top 10 data elements used by the top five users.
- Type: Heat Map
- Filter 1: protection.operation.keyword: Protect
- Filter 2: Audit Index Logtypes
- Configuration:
- Index: pty_insight_*audit*
- Metrics: Y-axis: Count
- Buckets:
- X-axis
- Aggregation: Terms
- Field: protection.policy_user.keyword
- Order by: Metric: Count
- Order: Descending
- Size: 5
- Y-axis
- Sub aggregation: Terms
- Field: protection.dataelement.keyword
- Order by: Metric:Count
- Order: Descending
- Size: 10
- X-axis

Data Element Usage Intensity Of Users per Reprotect operation
Description: The chart shows the data element usage intensity of users per reprotect operation. It displays the top 10 data elements used by the top five users.
- Type: Heat Map
- Filter 1: protection.operation.keyword: Reprotect
- Filter 2: Audit Index Logtypes
- Configuration:
- Index: pty_insight_*audit*
- Metrics: Y-axis: Count
- Buckets:
- X-axis
- Aggregation: Terms
- Field: protection.policy_user.keyword
- Order by: Metric: Count
- Order: Descending
- Size: 5
- Y-axis
- Sub aggregation: Terms
- Field: protection.dataelement.keyword
- Order by: Metric:Count
- Order: Descending
- Size: 10
- X-axis

Data Element Usage Intensity Of Users per Unprotect operation
Description: The chart shows the data element usage intensity of users per unprotect operation. It displays the top 10 data elements used by the top five users.
- Type: Heat Map
- Filter 1: protection.operation.keyword: Unprotect
- Filter 2: Audit Index Logtypes
- Configuration:
- Index: pty_insight_*audit*
- Metrics: Y-axis: Count
- Buckets:
- X-axis
- Aggregation: Terms
- Field: protection.policy_user.keyword
- Order by: Metric: Count
- Order: Descending
- Size: 5
- Y-axis
- Sub aggregation: Terms
- Field: protection.dataelement.keyword
- Order by: Metric:Count
- Order: Descending
- Size: 10
- X-axis

Server Activity of Older Audit Indices By Date
Description: The chart shows the daily count of all events by servers for specific time period from the old audit index.
- Type: Line
- Configuration:
- Index: pty_insight_*audit_*
- Metrics: Y-axis: Count
- Buckets:
- X-axis
- Aggregation: Date Histogram
- Field: origin.time_utc
- Minimum interval: Day
- Split series
- Sub aggregation: Terms
- Field: origin.hostname.keyword
- Order by: Metric:Count
- Order: Descending
- Size: 50
- X-axis

Server Activity of Audit Index By Date
Description: The chart shows the daily count of all events by servers for specific time period from the audit index.
- Type: Line
- Configuration:
- Index: pty_insight_analytics*audits_*
- Metrics: Y-axis: Count
- Buckets:
- X-axis
- Aggregation: Date Histogram
- Field: origin.time_utc
- Minimum interval: Day
- Split series
- Sub aggregation: Terms
- Field: origin.hostname.keyword
- Order by: Metric:Count
- Order: Descending
- Size: 50
- X-axis

Server Activity of Policy Index By Date
Description: The chart shows the daily count of all events by servers for specific time period from the policy index.
- Type: Line
- Configuration:
- Index: pty_insight_analytics*policy_log_*
- Metrics: Y-axis: Count
- Buckets:
- X-axis
- Aggregation: Date Histogram
- Field: origin.time_utc
- Minimum interval: Day
- Split series
- Sub aggregation: Terms
- Field: origin.hostname.keyword
- Order by: Metric:Count
- Order: Descending
- Size: 50
- X-axis

Server Activity of Troubleshooting Index By Date
Description: The chart shows the daily count of all events by servers for specific time period from the troubleshooting index.
- Type: Line
- Configuration:
- Index: pty_insight_analytics*troubleshooting_*
- Metrics: Y-axis: Count
- Buckets:
- X-axis
- Aggregation: Date Histogram
- Field: origin.time_utc
- Minimum interval: Day
- Split series
- Sub aggregation: Terms
- Field: origin.hostname.keyword
- Order by: Metric:Count
- Order: Descending
- Size: 50
- X-axis

Connectivity status
Description: This pie chart display connectivity status for the protectors.
- Type: Pie
- Configuration:
- Index: pty_insight_analytics*protector_status_dashboard_*
- Metrics:
- Slice size
- Aggregation: Unique Count
- Field: origin.ip
- Custom label: Number
- Slice size
- Buckets:
- Split slices
- Aggregation: Terms
- Field: protector_status.keyword
- Order by: Metric:Number
- Order: Descending
- Size: 10000
- Split slices

Policy_Deploy_Status_Chart
Description: This pie chart displays the deployment status of the policy.
- Type: Pie
- Filter: policystatus.type.keyword: POLICY
- Configuration:
- Index: pty_insight_analytics*policy_status_dashboard_*
- Metrics:
- Slice size
- Aggregation: Unique Count
- Field: _id
- Slice size
- Buckets:
- Split slices
- Aggregation: Terms
- Field: policystatus.status.keyword
- Order by: Metric:Unique Count of _id
- Order: Descending
- Size: 50
- Custom label: Policy Status
- Split slices

Policy_Deploy_Status_Table
Description: This table displays the policy deployment status and uniquely identified information for the data store, protector, process, platform, node, and so on.
- Type: Data Table
- Filter: policystatus.type.keyword: POLICY
- Configuration:
- Index: pty_insight_analytics*policy_status_dashboard_*
- Metrics:
- Aggregation: Count
- Custom label: Metrics Count
- Buckets:
- Split rows
- Aggregation: Terms
- Field: protector.datastore.keyword
- Order by: Metric: Metrics Count
- Order: Descending
- Size: 50
- Custom label: Data Store Name
- Split rows
- Aggregation: Terms
- Field: origin.ip
- Order by: Metric: Metrics Count
- Order: Descending
- Size: 50
- Custom label: Node IP
- Split rows
- Aggregation: Terms
- Field: origin.hostname.keyword
- Order by: Metric: Metrics Count
- Order: Descending
- Size: 50
- Custom label: Host Name
- Split rows
- Aggregation: Terms
- Field: policystatus.status.keyword
- Order by: Metric: Metrics Count
- Order: Descending
- Size: 50
- Custom label: Status
- Split rows
- Aggregation: Terms
- Field: origin.time_utc
- Order by: Metric: Metrics Count
- Order: Descending
- Size: 50
- Custom label: Last Seen
- Split rows
- Aggregation: Terms
- Field: process.name.keyword
- Order by: Metric: Metrics Count
- Order: Descending
- Size: 50
- Custom label: Process Name
- Split rows
- Aggregation: Terms
- Field: process.id.keyword
- Order by: Metric: Metrics Count
- Order: Descending
- Size: 50
- Custom label: Process Id
- Split rows
- Aggregation: Terms
- Field: process.platform.keyword
- Order by: Metric: Metrics Count
- Order: Descending
- Size: 50
- Custom label: Platform
- Split rows
- Aggregation: Terms
- Field: process.core_version.keyword
- Order by: Metric: Metrics Count
- Order: Descending
- Size: 50
- Custom label: Core Version
- Split rows
- Aggregation: Terms
- Field: process.pcc_version.keyword
- Order by: Metric: Metrics Count
- Order: Descending
- Size: 50
- Custom label: PCC Version
- Split rows
- Aggregation: Terms
- Field: protector.version.keyword
- Order by: Metric: Metrics Count
- Order: Descending
- Size: 50
- Custom label: Protector Version
- Split rows
- Aggregation: Terms
- Field: protector.vendor.keyword
- Order by: Metric: Metrics Count
- Order: Descending
- Size: 50
- Custom label: Vendor
- Split rows
- Aggregation: Terms
- Field: protector.family.keyword
- Order by: Metric: Metrics Count
- Order: Descending
- Size: 50
- Custom label: Family
- Split rows
- Aggregation: Terms
- Field: policystatus.deployment_or_auth_time
- Order by: Metric: Metrics Count
- Order: Descending
- Size: 50
- Custom label: Deployment Time
- Split rows

Protector Count
Description: This table displays the number of protector for each family, vendor, and version.
- Type: Data Table
- Configuration:
- Index: pty_insight_*audit*
- Metrics:
- Aggregation: Unique Count
- Field: origin.ip
- Custom label: Deployment Count
- Buckets:
- Split rows
- Aggregation: Terms
- Field: protector.family.keyword
- Order by: Metric: Deployment Count
- Order: Descending
- Size: 10000
- Custom label: Protector Family
- Split rows
- Aggregation: Terms
- Field: protector.vendor.keyword
- Order by: Metric: Metrics Count
- Order: Descending
- Size: 10000
- Custom label: Protector Vendor
- Split rows
- Aggregation: Terms
- Field: protector.version.keyword
- Order by: Metric: Deployment Count
- Order: Descending
- Size: 10000
- Custom label: Protector Version
- Split rows

Protector Family
Description: This chart displays the counts of protectors installed for each protector family.
- Type: Vertical Bar
- Configuration:
- Index: pty_insight_*audit*
- Metrics: Y-axis
- Aggregation: Unique Count
- Field: origin.ip
- Custom label: Number
- Buckets:
- X-axis
- Aggregation: Terms
- Field: protector.family.keyword
- Order by: Metric:Number
- Order: Descending
- Size: 10000
- Custom label:Protector Family
- X-axis

Protector List
Description: This table displays details of the protector.
- Type: Data Table
- Filter: NOT protection.audit_code: is one of 27, 28
- Configuration:
- Index: pty_insight_*audit*
- Metrics:
- Aggregation: Sum
- Field: cnt
- Custom label: URP
- Buckets:
- Split rows
- Aggregation: Terms
- Field: protector.vendor.keyword
- Order by: Metric:URP
- Order: Descending
- Size: 10000
- Custom label: Protector Vendor
- Split rows
- Aggregation: Terms
- Field: protector.family.keyword
- Order by: Metric:URP
- Order: Descending
- Size: 10000
- Custom label: Protector Family
- Split rows
- Aggregation: Terms
- Field: protector.version.keyword
- Order by: Metric:URP
- Order: Descending
- Size: 10000
- Custom label: Protector Version
- Split rows
- Aggregation: Terms
- Field: origin.ip
- Order by: Metric:URP
- Order: Descending
- Size: 10000
- Custom label: Protector IP
- Split rows
- Aggregation: Terms
- Field: origin.hostname.keyword
- Order by: Metric:URP
- Order: Descending
- Size: 10000
- Custom label: Hostname
- Split rows
- Aggregation: Terms
- Field: protector.core_version.keyword
- Order by: Metric:URP
- Order: Descending
- Size: 10000
- Custom label: Core Version
- Split rows
- Aggregation: Terms
- Field: protector.pcc_version.keyword
- Order by: Metric:URP
- Order: Descending
- Size: 10000
- Custom label: Pcc Version
- Split rows

Protector Status
Description: This table display protector status information.
- Type: Data Table
- Configuration:
- Index: pty_insight_analytics*protector_status_dashboard_*
- Metrics:
- Aggregation: Top Hit
- Field: origin.time_utc
- Aggregate with: Concatenate
- Size: 100
- Sort on: origin.time_utc
- Order: Descending
- Custom label: last seen
- Buckets:
- Split rows
- Aggregation: Terms
- Field: protector.datastore.keyword
- Order by: Alphabetically
- Order: Descending
- Size: 10000
- Custom label: Datastore
- Split rows
- Aggregation: Terms
- Field: origin.hostname.keyword
- Order by: Alphabetically
- Order: Descending
- Size: 10000
- Custom label: Hostname
- Split rows
- Aggregation: Terms
- Field: process.platform.keyword
- Order by: Alphabetically
- Order: Descending
- Size: 10000
- Custom label: Protector Platform
- Split rows
- Aggregation: Terms
- Field: process.core_version.keyword
- Order by: Alphabetically
- Order: Descending
- Size: 10000
- Custom label: Core Version
- Split rows
- Aggregation: Terms
- Field: protector.vendor.keyword
- Order by: Alphabetically
- Order: Descending
- Size: 10000
- Custom label: Protector Vendor
- Split rows
- Aggregation: Terms
- Field: protector.family.keyword
- Order by: Alphabetically
- Order: Descending
- Size: 10000
- Custom label: Protector Family
- Split rows
- Aggregation: Terms
- Field: protector.version.keyword
- Order by: Alphabetically
- Order: Descending
- Size: 10000
- Custom label: Protector Version
- Split rows
- Aggregation: Terms
- Field: protector_status.keyword
- Order by: Alphabetically
- Order: Descending
- Size: 10000
- Custom label: Protector Status

- Split rows
Protector Version
Description: This chart displays the protector count for each protector version.
- Type: Vertical Bar
- Configuration:
- Index: pty_insight_*audit*
- Metrics: Y-axis
- Aggregation: Unique Count
- Field: origin.ip
- Custom label: Number
- Buckets:
- X-axis
- Aggregation: Terms
- Field: protector.version.keyword
- Order by: Metric:Number
- Order: Descending
- Size: 10000
- Custom label: Protector Version
- Y-axis
- Sub aggregation: Terms
- Field: protection.dataelement.keyword
- Order by: Metric:Count
- Order: Descending
- Size: 50
- X-axis
- Filter: protection.operation.keyword: Unprotect

Security Operation Table
Description: The table displays the number of security operations grouped by data stores, protector vendors, and protector families.
- Type: Data Table
- FIlter: NOT protection.audit_code: is one of 27 , 28
- Configuration:
- Index: pty_insight_*audit_*
- Metrics:
- Aggregation: Sum
- Field: cnt
- Custom label: Security Operations Count
- Buckets:
- Split rows
- Aggregation: Terms
- Field: protection.datastore.keyword
- Order by: Metric:Security Operation Count
- Order: Descending
- Size: 10000
- Custom label: Data Store Name
- Split rows
- Aggregation: Terms
- Field: protector.family.keyword
- Order by: Metric:Security Operation Count
- Order: Descending
- Size: 10000
- Custom label: Protector Family
- Split rows
- Aggregation: Terms
- Field: protector.vendor.keyword
- Order by: Metric:Security Operation Count
- Order: Descending
- Size: 10000
- Custom label: Protector Vendor
- Split rows
- Aggregation: Terms
- Field: protector.version.keyword
- Order by: Metric:Security Operation Count
- Order: Descending
- Size: 10000
- Custom label: Protector Version
- Split rows

Successful Security Operation Values
Description: The visualization displays only successful protect, unprotect, and reprotect operation counts.
- Type: Metric
- Configuration:
- Index: pty_insight_*audit*
- Metrics:
- Aggregation: Sum
- Field: cnt
- Custom label: Count
- Buckets:
- Split group
- Aggregation: Filters
- Filter 1-Protect: protection.operation: protect and level: success
- Filter 2-Unprotect: protection.operation: unprotect and level: success
- Filter 3-Reprotect: protection.operation: reprotect and level: success
- Split group

Successful Security Operations
Description: The pie chart displays only successful protect, unprotect, and reprotect operations.
- Type: Pie
- Configuration:
- Index: pty_insight_*audit*
- Metrics:
- Aggregation: Sum
- Field: cnt
- Custom label: URP
- Buckets:
- Split slices
- Aggregation: Filters
- Filter 1-Protect: protection.operation: protect and level: Success
- Filter 2-Unprotect: protection.operation: unprotect and level: Success
- Filter 3-Reprotect: protection.operation: reprotect and level: Success
- Split slices

Total Security Operation Values
Description: The visualization displays successful and unsuccessful security operation counts.
- Type: Metric
- Configuration:
- Index: pty_insight_*audit*
- Metrics:
- Aggregation: Sum
- Field: cnt
- Custom label: Count
- Buckets:
- Split group
- Aggregation: Filters
- Filter 1-Successful: logtype:protection and level: Success and not protection.audit_code: 27
- Filter 2-Unsuccessful: logtype:protection and not level: Success and not protection.audit_code: 28
- Split group

Total Security Operations
Description: The pie chart displays successful and unsuccessful security operations.
- Type: Pie
- Configuration:
- Index: pty_insight_*audit*
- Metrics:
- Aggregation: Sum
- Field: cnt
- Custom label: URP
- Buckets:
- Split slices
- Aggregation: Filters
- Filter 1-Successful: logtype:protection and level: Success and not protection.audit_code: 27
- Filter 2-Unsuccessful: logtype:protection and not level: Success and not protection.audit_code: 28
- Split slices

Trusted_App_Status_Chart
Description: The pie chart displays the trusted application deployment status.
- Type: Pie
- Filter: policystatus.type.keyword: TRUSTED_APP
- Configuration:
- Index: pty_insight_analytics*policy_status_dashboard_*
- Metrics:
- Slice size:
- Aggregation: Unique Count
- Field: _id
- Custom label: Trusted App
- Slice size:
- Buckets:
- Split slices
- Aggregation: Terms
- Field: policystatus.status.keyword
- Order by: Metric: Trusted App
- Order: Descending
- Size: 100
- Custom label: Trusted App Status
- Split slices

Trusted_App_Status_Table
Description: The trusted application deployment status that is displayed on the dashboard. This table uniquely identifies the data store, protector, process, platform, node, and so on.
- Type: Data Table
- Filter: policystatus.type.keyword: TRUSTED_APP
- Configuration:
- Index: pty_insight_analytics*policy_status_dashboard_*
- Metrics:
- Aggregation: Count
- Custom label: Metrics Count
- Buckets:
- Split rows
- Aggregation: Terms
- Field: policystatus.application_name.keyword
- Order by: Metric: Metric:Count
- Order: Descending
- Size: 5
- Custom label: Application name
- Split rows
- Aggregation: Terms
- Field: protector.datastore.keyword
- Order by: Metric: Metric:Count
- Order: Descending
- Size: 50
- Custom label: Data Store Name
- Split rows
- Aggregation: Terms
- Field: origin.ip
- Order by: Metric: Metric:Count
- Order: Descending
- Size: 50
- Custom label: Node IP
- Split rows
- Aggregation: Terms
- Field: origin.hostname.keyword
- Order by: Metric: Metric:Count
- Order: Descending
- Size: 50
- Custom label: Host Name
- Split rows
- Aggregation: Terms
- Field: policystatus.status.keyword
- Order by: Metric: Metric:Count
- Order: Descending
- Size: 50
- Custom label: Status
- Split rows
- Aggregation: Terms
- Field: origin.time_utc
- Order by: Metric: Metric:Count
- Order: Descending
- Size: 50
- Custom label: Last Seen
- Split rows
- Aggregation: Terms
- Field: process.name.keyword
- Order by: Metric: Metric:Count
- Order: Descending
- Size: 50
- Custom label: Process Name
- Split rows
- Aggregation: Terms
- Field: process.id.keyword
- Order by: Metric: Metric:Count
- Order: Descending
- Size: 50
- Custom label: Process Id
- Split rows
- Aggregation: Terms
- Field: process.platform.keyword
- Order by: Metric: Metric:Count
- Order: Descending
- Size: 50
- Custom label: Platform
- Split rows
- Aggregation: Terms
- Field: process.core_version.keyword
- Order by: Metric: Metric:Count
- Order: Descending
- Size: 50
- Custom label: Core Version
- Split rows
- Aggregation: Terms
- Field: process.pcc_version.keyword
- Order by: Metric: Metric:Count
- Order: Descending
- Size: 50
- Custom label: PCC Version
- Split rows
- Aggregation: Terms
- Field: protector.version.keyword
- Order by: Metric: Metric:Count
- Order: Descending
- Size: 50
- Custom label: Protector Version
- Split rows
- Aggregation: Terms
- Field: protector.vendor.keyword
- Order by: Metric: Metric:Count
- Order: Descending
- Size: 50
- Custom label: Vendor
- Split rows
- Aggregation: Terms
- Field: protector.family.keyword
- Order by: Metric: Metric:Count
- Order: Descending
- Size: 50
- Custom label: Family
- Split rows
- Aggregation: Terms
- Field: policystatus.deployment_or_auth_time
- Order by: Metric: Metric:Count
- Order: Descending
- Size: 50
- Custom label: Authorize Time
- Split rows
- Split rows
- Aggregation: Terms
- Field: protector.datastore.keyword
- Order by: Metric: Metric:Count
- Order: Descending
- Size: 50
- Custom label: Data Store Name

Unsuccessful Security Operation Values
Description: The metric displays unsuccessful security operation counts.
- Type: Metric
- Filter 1: logtype: Protection
- Filter 2: NOT level: success
- Filter 3: NOT protection.audit_code: 28
- Configuration:
- Index: pty_insight_*audit*
- Metrics:
- Aggregation: Sum
- Field: cnt
- Custom label: Count
- Buckets: - Split group - Aggregation: Terms - Field: level.keyword - Order by: Metric:Count - Order: Descending - Size: 10000

Unsuccessful Security Operations
Description: The pie chart displays unsuccessful security operations.
- Type: Pie
- Filter 1: logtype: protection
- Filter 2: NOT level: success
- Configuration:
- Index: pty_insight_*audit*
- Metrics:
- Slice size:
- Aggregation: Sum
- Field: cnt
- Custom label: Counts
- Slice size:
- Buckets:
- Split slices
- Aggregation: Terms
- Field: level.keyword
- Order by: Metric: Counts
- Order: Descending
- Size: 10000
- Split slices

4.18.8 - Viewing visualization templates
The configuration of visualizations created in the earlier versions of the Audit Store Dashboards are retained after the ESA is upgraded. Protegrity provides default visualizations with version 10.1.0. If the title of an existing visualization matches the new visualization provided by Protegrity, then a duplicate entry is visible. Use the date and time stamp to identify and rename the existing visualizations.
Do not delete or modify the configuration or details of the new visualizations provided by Protegrity. To customize the visualization, create a copy of the visualization and perform the customization on the copy of the visualization.
Activity by data element usage count
Description: This graph displays the security operation count for each data element.
- Type: Vertical Bar
- Configuration:
- Index: pty_insight_*audit_*
- Metrics: Y-axis: Count
- Buckets:
- X-axis
- Aggregation: Terms
- Field: protection.dataelement.keyword
- Order by: Metric:Count
- Order: Descending
- Size: 10
- Custom label: Data Elements
- Split series
- Sub aggregation: Terms
- Field: protection.operation.keyword
- Order by: Metric:Count
- Order: Descending
- Size: 10
- X-axis

All activity by date
Description: This chart displays all logs trends as per the date.
- Type: Line
- Configuration:
- Index: pty_insight_*audit_*
- Metrics: Y-axis: Count
- Buckets:
- X-axis
- Aggregation: Date Histogram
- Field: origin.time_utc
- Minimum interval: Auto
- X-axis

Application protector audit report
Description: This report uses AP python for generating the audit logs.
- Type: Data Table
- Configuration:
- Index: pty_insight_*audit_*
- Metrics: Y-axis: Count
- Buckets:
- Split rows
- Aggregation: Terms
- Field: protection.dataelement.keyword
- Order by: Metric:Count
- Order: Descending
- Size: 50
- Split rows
- Sub aggregation: Terms
- Field: protection.policy_user.keyword
- Order by: Metric:Count
- Order: Descending
- Size: 50
- Split rows
- Sub aggregation: Terms
- Field: origin.ip
- Order by: Metric:Count
- Order: Descending
- Size: 50
- Split rows
- Sub aggregation: Terms
- Field: protection.operation.keyword
- Order by: Metric:Count
- Order: Descending
- Size: 50
- Split rows
- Sub aggregation: Terms
- Field: additional_info.description.keyword
- Order by: Metric:Count
- Order: Descending
- Size: 50
- Split rows
- Sub aggregation: Terms
- Field: origin.time_utc
- Order by: Metric:Count
- Order: Descending
- Size: 50
- Split rows

Policy report
Description: The policy report for the last 30 days.
Type: Data Table
Configuration:
- Index: pty_insight_*audit_*
- Metrics: Metric: Count
- Buckets:
- Split rows
- Aggregation: Date Histogram
- Field: origin.time_utc
- Minimum interval: Auto
- Custom label: Date & Time
- Split rows
- Sub aggregation: Terms
- Field: client.ip.keyword
- Order by: Metric:Count
- Order: Descending
- Size: 50
- Custom label: Client IP
- Split rows
- Sub aggregation: Terms
- Field: client.username.keyword
- Order by: Metric:Count
- Order: Descending
- Size: 50
- Custom label: Client Username
- Split rows
- Sub aggregation: Terms
- Field: additional_info.description.keyword
- Order by: Metric:Count
- Order: Descending
- Size: 50
- Custom label: Additional Info
- Split rows
- Sub aggregation: Terms
- Field: level.keyword
- Order by: Metric:Count
- Order: Descending
- Size: 50
- Custom label: Severity Level

- Split rows
Protection activity across datastore
Description: The protection activity across datastore and types of protectors used.
- Type: Pie
- Configuration:
- Index: pty_insight_*audit_*
- Metrics: Slice size: Count
- Buckets:
- Split chart
- Aggregation: Terms
- Field: protection.datastore.keyword
- Order by: Metric:Count
- Order: Descending
- Size: 5
- Split slices
- Sub aggregation: Terms
- Field: protection.operation.keyword
- Order by: Metric:Count
- Order: Descending
- Size: 5
- Split chart

System daily activity
Description: This shows the system activity for the day.
- Type: Line
- Configuration:
- Index: pty_insight_*audit_*
- Metrics: Y-axis: Count
- Buckets:
- X-axis
- Aggregation: Date Histogram
- Field: origin.time_utc
- Minimum interval: Auto
- Split series
- Sub aggregation: Terms
- Field: logtype.keyword
- Order by: Metric:Count
- Order: Descending
- Size: 10
- X-axis

Top 10 unauthorized access by data element
Description: The top 10 unauthorized access by data element for Protect and Unprotect operations for the last 30 days.
- Type: Horizontal Bar
- Configuration:
- Index: pty_insight_*audit_*
- Metrics: Y-axis: Count
- Buckets:
- X-axis
- Aggregation: Terms
- Field: protection.dataelement.keyword
- Order by: Metric:Count
- Order: Descending
- Size: 10
- Custom label: Data elements
- Split series
- Sub aggregation: Filters
- Filter 1 - Protect: level=‘Error’
- Filter 2 - Unprotect: level=‘WARNING’
- X-axis

Total security operations per five minutes
Description: The total security operations generated grouped using five minute intervals.
- Type: Line
- Configuration:
- Index: pty_insight_*audit_*
- Metrics: Y-axis: Count
- Buckets:
- X-axis
- Aggregation: Date Histogram
- Field: origin.time_utc
- Minimum interval: Day
- Split series
- Sub aggregation: Terms
- Field: protection.operation.keyword
- Order by: Metric:Count
- Order: Descending
- Size: 5
- Split chart
- Sub aggregation: Terms
- Field: protection.datastore.keyword
- Order by: Alphabetical
- Order: Descending
- Size: 5
- Custom label: operations
- X-axis

User activity operation count
Description: The count of total operations performed per user.
- Type: Vertical Bar
- Configuration:
- Index: pty_insight_*audit_*
- Metrics: Y-axis: Count
- Buckets:
- X-axis
- Aggregation: Terms
- Field: protection.policy_user.keyword
- Order by: Metric:Count
- Order: Descending
- Size: 50
- Split series
- Sub aggregation: Terms
- Field: protection.operation.keyword
- Order by: Metric:Count
- Order: Descending
- Size: 5
- X-axis

4.19 - Maintaining Insight
Logging follows a fixed routine. The system generates logs, which are collected and then forwarded to Insight. Insight stores the logs in the Audit Store. These log records are used in various areas, such as, alerts, reports, dashboards, and so on. This section explains the logging architecture.
4.19.1 - Working with alerts
Viewing alerts
Generated alerts are displayed on the Audit Store Dashboards. View and acknowledge the alerts from the alerting dashboard by navigating to OpenSearch Plugins > Alerting > Alerts. The alerting dashboard is shown in the following figure.

Destinations for alerts are moved to channels in Notifications. For more information about working with Monitors, Alerts, and Notifications, refer to the section Monitors in https://opensearch.org/docs/2.18/dashboards/.
Creating notifications
Create notification channels to receive alerts as per individual requirements. The alerts are sent to the destination specified in the channel.
Creating a custom webhook notification
A webhook notification sends the alerts generated by a monitor to a destination, such as, a web page.
Perform the following steps to configure the notification channel for generating webhook alerts:
Log in to the ESA Web UI.
Navigate to Audit Store > Dashboard.
The Audit Store Dashboards appears. If a new tab does not automatically open, click Open in a new tab.
From the menu, navigate to Management > Notifications > Channels.
Click Create channel.
Specify the following information under Name and description.
- Name: Http_webhook
- Description: For generating http webhook alerts.
Specify the following information under Configurations.
- Channel type: Custom webhook
- Method: POST
- Define endpoints by: Webhook URL
- Webhook URL: Specify the URL that receives the alert. For example https://webhook.site/9385a259-3b82-4e99-ad1e-1eb875f00734.
- Webhook headers: Specify the key value pairs for the webhook.
Click Send test message to send a message to the email recipients.
Click Create to create the channel.
The webhook is set up successfully.
Proceed to create a monitor and attach the channel created using the steps from Creating the monitor.
Creating email alerts using custom webhook
An email notification sends alerts generated by a monitor to an email address. It is also possible to configure the SMTP channel for sending an email alert. It is recommended to send email alerts using custom webhooks, which offers added security. The email alerts can be encrypted or non-encrypted. Accordingly, the required SMTP settings for email notifications must be configured on the ESA.
Perform the following steps to configure the notification channel for generating email alerts using custom webhooks:
Ensure that the following is configured as per the requirement:
- Configuring SMTP on the ESA, refer here.
Log in to the ESA Web UI.
Navigate to Audit Store > Dashboard.
The Audit Store Dashboards appears. If a new tab does not automatically open, click Open in a new tab.
From the menu, navigate to OpenSearch Plugins > Notifications > Channels.
Click Create channel.
Specify the following information under Name and description.
- Name: send_email_with_certs_alerts
- Description: For secure SMTP alerts.
Specify the following information under Configurations.
- Channel type: Custom webhook
- Define endpoints by: Custom attributes URL
- Type: HTTP
- Host: <ESA_IP>
- Port: 8588
- Path: rest/alerts/alerts/send_smtp_email_alerts
Under Query parameters, click Add parameter and specify the following information. Click Add parameter and add cc and bcc, if required.
- Key: to
- Value: <email_ID>
Under Webhook headers, click Add header and specify the following information.
- Key: Pty-Username
- Value:
%internal_scheduler;
Under Webhook headers, click Add header and specify the following information.
- Key: Pty-Roles
- Value: auditstore_admin
Click Create to save the channel configuration.
CAUTION: Do not click Send test message because the configuration for the channel is not complete.
The success message appears and the channel is created. The webhook for the email alerts is set up successfully.
Proceed to create a monitor and attach the channel created using the steps from Creating the monitor.
Perform the following steps to configure the notification channel for generating secure email alerts using custom webhooks:
Ensure that the following is configured as per the requirement:
- Configuring SMTP on the ESA, refer here.
Configure the certificates, if not already configured.
Download the CA certificate of your SMTP server.
Log in to the ESA Web UI.
Upload the SMTP CA certificate on the ESA.
Navigate to Settings > Network > Certificate Repository.
Upload your CA certificate to the ESA.
Select and activate your certificates in Management & Web Services from Settings > Network > Manage Certificates. For more information about ESA certificates, refer here.
Update the smtp_config.json configuration file.
Navigate to Settings > System > Files > smtp_config.json.
Click the Edit the product file (
 ) icon.
Update the following SMTP settings and the certificate information in the file. Sample values are provided in the following code, ensure that you use values as per individual requirements.
Set enabled to true to enable SMTP settings.
"enabled": true,Specify the host address for the SMTP connection.
"host": "192.168.1.10",Specify the port for the SMTP connection.
"port": "25",Specify the email address of the sender for the SMTP connection.
"sender_email_address": "<Email_ID>",Enable STARTTLS.
"use_start_tls": "true",Enable server certificate validation.
"verify_server_cert": "true",Specify the location for the CA certificate.
"ca_file_path": "/etc/ksa/certificates/mng/CA.pem",
Click Save.
Repeat the steps on the remaining nodes of the Audit Store cluster.
Navigate to Audit Store > Dashboard.
The Audit Store Dashboards appears. If a new tab does not automatically open, click Open in a new tab.
From the menu, navigate to Management > Notifications > Channels.
Click Create channel.
Specify the following information under Name and description.
- Name: send_email_with_certs_alerts
- Description: For generating secured SMTP email alerts.
Specify the following information under Configurations.
- Channel type: Custom webhook
- Method: POST
- Define endpoints by: Webhook URL
- Webhook URL: http://localhost:8588/rest/alerts/alerts/send_email_with_certs_alerts?to=mailuser1%40ip-<ESA_IP».protegrity.com
Under Webhook headers, click Add header and specify the following information.
- Key: Pty-Username
- Value:
%internal_scheduler;
Under Webhook headers, click Add header and specify the following information.
- Key: Pty-Roles
- Value: auditstore_admin
Click Create to save the channel configuration.
CAUTION: Do not click Send test message because the configuration for the channel is not complete.
The success message appears and the channel is created. The webhook for the email alerts is set up successfully.
Proceed to create a monitor and attach the channel created using the steps from Creating the monitor.
Creating an email notification
Perform the following steps to configure the notification channel for generating email alerts:
Log in to the ESA Web UI.
Navigate to Audit Store > Dashboard.
The Audit Store Dashboards appears. If a new tab does not automatically open, click Open in a new tab.
From the menu, navigate to Management > Notifications > Channels.
Click Create channel.
Specify the following information under Name and description.
- Name: Email_alert
- Description: For generating email alerts.
Specify the following information under Configurations.
- Channel type: Email
- Sender type: SMTP sender
- Default recipients: Specify the list of email addresses for receiving the alerts.
Click Create SMTP sender and add the following parameters.
- Sender name: Specify a descriptive name for sender.
- Email address: Specify the email address that must receive the alerts.
- Host: Specify the hostname of the email server.
- Port: 25
- Encryption method: None
Click Create.
Click Send test message to send a message to the email recipients.
Click Create to create the channel.
The email alert is set up successfully.
Proceed to create a monitor and attach the channel created using the steps from Creating the monitor.
Creating the monitor
A monitor tracks the system and sends an alert when a trigger is activated. Triggers cause actions to occur when certain criteria are met. Those criteria are set when a trigger is created. For more information about monitors, actions, and triggers, refer to Alerting.
Perform the following steps to create a monitor. The configuration specified here is just an example. For real use, create whatever configuration is needed, per individual requirements:
Ensure that a notification is created using the steps from Creating notifications.
From the menu, navigate to OpenSearch Plugins > Alerting > Monitors.
Click Create Monitor.
Specify a name for the monitor.
For the Monitor defining method, select Extraction query editor.
For the Schedule, select 30 Minutes.
For the Index, select the required index.
Specify the following query for the monitor. Modify the query as per the requirement.
{
    "size": 0,
    "query": {
        "match_all": {
            "boost": 1
        }
    }
}
Click Add trigger and specify the information provided here.
Specify a trigger name.
Specify a severity level.
Specify the following code for the trigger condition:
ctx.results[0].hits.total.value > 0
Click Add action.
From the Channels list, select the required channel.
Add the following code in the Message field. The default message displayed might not be formatted properly. Update the message by replacing the Line spaces with the n escape code. The message value is a JSON value, use escape characters to structure the email properly using valid JSON syntax.
```
{
"message": "Please investigate the issue.\n  - Trigger: {{ctx.trigger.name}}\n  - Severity: {{ctx.trigger.severity}}\n  - Period start: {{ctx.periodStart}}\n  - Period end: {{ctx.periodEnd}}",
"subject": "Monitor {{ctx.monitor.name}} just entered alert status"
}
```
>   The **message** value is a JSON value. Be sure to use escape characters to structure the email properly using valid JSON syntax. The default message displayed might not be formatted properly. Update the message by replacing the Line spaces with the **\\n** escape code.
- Select the Preview message check box to view the formatted email message.
- Click Send test message and verify the recipient’s inbox for the message.
- Click Save to update the configuration.
4.19.2 - Index lifecycle management (ILM)
In the earlier versions of the ESA, the UI for Index Lifecycle Management was named as Information Lifecycle Management.
The following figure shows the ILM system components and the workflow.

The ILM log repository is divided into the following parts:
- Active logs that may be required for immediate reporting. These logs are accessed regularly for high frequency reporting.
- Logs that are pushed to Short Term Archive (STA). These logs are accessed occasionally for moderate reporting frequency.
- Logs that are pushed to Long Term Archive (LTA). These logs are accessed rarely for low reporting frequency. The logs are stored where they can be backed up by the backup mechanism used by the enterprise.
The ILM feature in Protegrity Analytics is used to archive the log entries from the index. The logs generated for the ILM operations appear on this page. Only logs generated by ILM operation on the ESA v9.2.0.0 and above appear on the page after upgrading to the latest version of the ESA. For ILM logs generated on an earlier version of the ESA, navigate to Audit Store > Dashboard > Open in new tab, select Discover from the menu, select the time period, and search for the ILM logs using keywords for the additional_info.procedure field, such as, export, process_post_export_log, or scroll_index_for_export.
Use the search bar to filter logs. Click the Reset Search (![]() ) icon to clear the search filter and view all the entries. To search for the ILM logs using the origin time, specify the Origin Time(UTC) term within double quotes.
) icon to clear the search filter and view all the entries. To search for the ILM logs using the origin time, specify the Origin Time(UTC) term within double quotes.

Move entries out of the index when not required and import them back into the index when required using the export and import feature. Only one operation can be run at a time for each node for exporting logs or importing logs. The ILM screen is shown in the following figure.

The Viewer role user or a user with the viewer role can only view data on the ILM screen. Admin rights are required to use the import, export, migrate, and delete features of the ILM.
Use the ILM for managing indexes, such as, the audit index, the policy log index, the protector status index, and the troubleshooting index. The Audit Store Dashboards has the ISM feature for managing the other indexes. Using the ISM feature might result in a loss of logs and it is not advised to use the ILM feature where possible.
Exporting logs
As log entries fill the Audit Store, the size of the log index increases. This slows down log operations for searching and retrieving log entries. To speed up these operations, export log entries out of the index and store them in an external file. If required, import the entries again for audit and analysis.
Moving index entries out of the index file, removes the entries from the index file and places them in a backup file. This backup file is the STA and reduces the load and processing time for the main index. The backup file is created in the /opt/protegrity/insight/archive/ directory. To store the file at a different location, mount the destination in the /opt/protegrity/insight/archive/ directory. In this case, specify the directory name, for example, /opt/protegrity/insight/archive/
If the location is on the same drive or volume as the main index, then the size of the index would reduce. However, this would not be an effective solution for saving space on the current volume. To save space, move the backup file to a remote system or into LTA.
Only one export operation can be run at a time. Empty indexes cannot de exported and must be manually deleted.
On the ESA, navigate to Audit Store > Analytics > Index Lifecycle Management.
Click Export.
The Export Data screen appears.

Complete the fields for exporting the log data from the default index.
The available fields are:
- From Index: Select the index to export data from.
- Password: Specify the password for securing the backup file.
- Confirm Password: Specify the password again for reconfirmation.
- Directory (optional): Specify the location to save the backup file. If a value is not specified, then the default directory
/opt/protegrity/insight/archive/is used.
Click Export.
Specify the root password.
Click Submit.
The log entries are extracted, then copied to the backup file, and protected using the password. After a successful export, the exported index will be deleted from Insight.
After the export is complete, move the backup file to a different location till the log entries are required. Import the entries in the index again for analysis or audit.
Importing logs
The exported log entires and secondary indexes are stored in a separate file. If these entries are required for analysis, then import them back into Insight. To be able to import, the archive file should be inside the archive directory or within a directory inside the archive directory.
Keep the passwords handy, in case the log entries were exported and protected using password protection. Do not rename the default index file name for this feature to work. Imported indexes are excluded and are not exported when the auto-export task is run from the scheduler.
On the ESA, navigate to Audit Store > Analytics > Index Lifecycle Management.
Click Import.
The Import Data screen appears.

Complete the fields for importing the log data to the default index or secondary index.
The available fields are:
- File Name: Select the file name of the backup file.
- Password: Specify the password for the backup file.
Click Import.
Data will be imported to an index that is named using the file name or the index name. When importing a file which was exported in version 8.0.0.0 or later, then the new index name will be the date range of the entries in the index file using the format pty_insight_audit_ilm_(from_date)-(to_date). For example, pty_insight_audit_ilm_20191002_113038-20191004_083900.
Deleting indexes
Use the Delete option to delete indexes that are not required. Only delete custom indexes that are created and listed in the Source list. Deleting the index will lead to a permanent loss of data in the index. If the index was not archived earlier, then the logs from the index deleted cannot be recreated or retrieved.
On the ESA, navigate to Audit Store > Analytics > Index Lifecycle Management.
Click Delete.
The Delete Index screen appears.

Select the index to delete from the Source list.
Select the Data in the selected index will be permanently deleted. This operation cannot be undone. check box.
Click Delete.
The Authentication screen appears.

Enter the root password.
Click Submit.
4.19.3 - Viewing policy reports
If a report is present where policies were not modified, then a breach might have occurred. These instances can be further analyzed to find and patch security issues. A new policy report is generated when this reporting agent is first installed on the ESA. This ensures that the initial state of all the policies on all the data stores in the ESA. A user can then use the Protegrity Analytics to list all the reports that were saved over time and select the required reports.
Ensure that the required policies that must be displayed in the report are deployed. Perform the following steps to view the policies deployed.
- Log in to the ESA Web UI.
- Navigate to Policy Management > Policies & Trusted Application > Policies.
- Verify that the policies to track are deployed and have the Deploy Status as OK.
If the reporting tool is installed when a policy is being deployed, then the policy status in the report might show up as Unknown or as a warning. In this case, manually deploy the policy again so that it is displayed in the Policy Report.
Perform the following steps to view the policy report.
In the ESA, navigate to Audit Store > Analytics > Policy Report.
The Policy screen appears.

Select a time period for the reports using the From and To date picker. This is an optional step. The time period narrows the search results for the number of reports displayed for the selected data store.
Select a data store from the Deployed Datastore list.
Click Search.
The reports are filtered and listed based on the selection.

Click the link for the report to view.
For every policy deployed, the following information is displayed:
- Policy details: This section displays the name, type, status, and last modified time for the policy.
- List of Data Elements: This table displays the name, description, type, method, and last modified date and time for a data element in the policy.
- List of Data Stores: This table lists the name, description, and last modified date and time for the data store.
- List of Roles: This table lists the name, description, mode, and last modified date and time for a role.
- List of Permissions: This table lists the various roles and the permissions applicable with the role.

Print the report for comparing and analyzing the different reports that are generated when policies are deployed or undeployed. Alternatively, click the Back button to go back to the search results. Print the report using the landscape mode.
4.19.4 - Verifying signatures
The log entries having checksums are identified. These entries are then processed using the signature key and the checksum received in the log entry from the protector is checked. If both the checksum values match, then the log entry has not been tampered with. If a mismatch is found, then it might be possible that the log entry was tampered or there is an issue receiving logs from a protector. These can be viewed on the Discover screen by using the following search criteria.
logtype:verification
The Signature Verification screen is used to create jobs. These jobs can be run as per a schedule using the scheduler.
For more information about scheduling signature verification jobs, refer here.
To view the list of signature verification jobs created, from the Analytics screen, navigate to Signature Verification > Jobs.

The lifecycle of an Ad-Hoc job is shown in the following figure.

The Ad-Hoc job lifecycle is described here.
A job is created.
If Run Now is selected while creating the job, then the job enters the Queued to Run state.
If Run Now is not selected while creating the job, then the job enters the Ready state. The job will only be processed and enters the Queued to Run state by clicking the Start button.
When the scheduler runs, based on the scheduler configuration, the Queued to Run jobs enter the Running state.
After the job processing completes, the job enters the Completed state. Click Continue Running to move the job to the Queued to Run state for processing any new logs generated.
If Stop is clicked while the job is running, then the job moves to the Queued to Stop state, and then moves to the Stopped state.
Click Continue Running to re-queue the job and move the job to the Queued to Run state.
A System job is created by default for verifying signatures. This job runs as per the signature verification schedule to processes the audit log signatures.
The logs that fail verification are displayed in the following locations for analysis.
- In Discover using the query logtype:verification.
- On the Signature Verification > Logs tab.
When the signature verification for an audit log fails, the failure logs are logged in Insight. Alerts can be generated by using monitors that query the failed logs.
The lifecycle of a System job is shown in the following figure.

The System job lifecycle is described here.
- The System job is created when Analytics is initialized or the ESA is upgraded and enters the Queued to Run state.
- When the scheduler runs, then the job enters the Running state.
- After processing is complete, then the job returns to the Queued to Run state because it is a system job that needs to keep processing records as they arrive.
- While the job is running, clicking Stop moves the job to the Queued to Stop state followed by the Stopped state.
- If the job is in the Stopped state, then clicking Continue Running moves the job to the Queued to Run state.
Working with signatures
The list of signature verification jobs created is available on the Signature Verification tab. From this tab, view, create, edit, and execute the jobs. Jobs can also be stopped or continued from this tab.
To view the list of signature verification jobs, from the Analytics screen, navigate to Signature Verification > Jobs.
The viewer role user or a user with the viewer role can only view the signature verification jobs. The admin rights are required to create or modify signature verification jobs.
After initializing Analytics during a fresh installation, ensure that the priority IP list for the default signature verification jobs is updated. The list is updated by editing the task from Analytics > Scheduler > Signature Verification Job. During the upgrade from an earlier version of the ESA, if Analytics is initialized on an ESA, then the ESA will be used for the priority IP, else update the priority IP for the signature verification job after the upgrade is complete. If multiple ESAs are present in the priority list, then more ESAs are available to process the signature verifications jobs that must be processed.
For example, if the max jobs to run on an ESA is set to 4 and 10 jobs are queued to run on 2 ESAs, then 4 jobs are started on the first ESA, 4 jobs are started on the second ESA, and 2 jobs will be queued to run till an ESA job slot gets free to accept and run the queued job.
Use the search field to filter and find the required verification job. Click the Reset Search icon to clear the filter and view all jobs. Use the following information while using the search function:
- Type the entire word to view results containing the word.
- Use wildcard characters for searching. This is not applicable for wildcard characters used within double quotes.
- Search for a specific word by specifying the word within double quotes. This is required for words having the hyphen (-) character that the system treats as a space.
- Specify the entire word, if the word contains the underscore (_) character.
The following columns are available on this screen. Click a label to sort the items in the ascending or descending order. Sorting is available for the Name, Created, Modified, and Type columns.
| Column | Description |
|---|---|
| Name | A unique name for the signature verification job. |
| Indices | A list of indexes on which the signature verification job will run. |
| Query | The signature verification query. |
| Pending | The number of logs pending for signature verification. |
| Processed | The current number of logs processed. |
| Not-Verified | The number of logs that could not be verified. Only protector and PEP server logs for version 8.1.0.0 and higher can be verified. |
| Success | The number of verifiable logs where signature verification succeeded. |
| Failure | The number of verifiable logs where signature verification failed. |
| Created | The creation date of the signature verification job. |
| Modified | The date on which the signature verification job was modified. |
| Type | The type of the signature verification job. The available options are SYSTEM where the job is created by the system and ADHOC where the custom job is created by a user. |
| State | Shows the job status. |
| Action | The actions that can be performed on the signature verification job. |
The root or admin rights are required to create or modify signature verification jobs.
The available statuses are:
 : Queued to run. The job will run soon.
 : Ready. The job will run when the scheduler initiates the job.
 : Running. The job is running. Click Stop from Actions to stop the job.
 : Queued to stop. The job processing will stop soon.
 : Stopped. The job has been stopped. Click Continue Running from Actions to continue the job. If a signature verification scheduler job is stopped from the Scheduler > Monitor page, then the status might be updated on this page after about 5 minutes.
 : Completed. The job is complete. Click Continue Running from Actions to run the job again.
The available actions are:
- Click the Edit icon () to update the job.
- Click the Start icon (
 ) to run the job.
 - Click the Stop icon (
 ) to stop the job.
 - Click the Continue Running icon (
 ) to resume the job.
Creating a signature verification job
Specify a query for creating the signature verification job. Additionally, select the indexes that the signature verification job needs to run on.
In Analytics, navigate to Signature Verification > Jobs.
The Signature Verification Jobs screen is displayed.
Click New Job.
The Create Job screen is displayed.

Specify a unique name for the job in the Name field.
Select the index or alias to query from the Indices list. An alias is a reference to one or more indexes available in the Indices list. The alias is generated and managed by the system and cannot be created or deleted.
Specify a description for the job in the Description field.
Select the Run Now check box to run the job after it is created.
Use the Query field to specify a JSON query. Errors in the code, if any, are marked with a red cross before the code line.
The following options are available for working with the query:
- Indent code (
 ): Click to format the code using tab spaces.
 - Remove white space from code (
 ): Click to format the code by removing the white spaces and displaying the query in a continuous line.
 - Undo (
 ): Click to undo the last change made.
 - Redo (
 ): Click to redo the last change made.
 - Clear (
 ): Click to clear the query text.
- Indent code (
Specify the contents of the query tag for creating the JSON query. For example, specify the query
```
{
   "query":{
      "match" : {
         "*field\_name*":"*field\_value*"
      }
   }
}
```

as

```
{
      "match" : {
         "*field\_name*":"*field\_value*"
      }
   }
```
Click Run to test the query.
View the result displayed in the Query Response field.
The following options are available to work with the output:
- Expand all fields (
 ): Click to expand all fields in the result.
 - Collapse all fields (
 ): Click to collapse all fields in the result.
 - Switch Editor Mode (
 ): Click to select the editor mode. The following options are available:
- View: Switch to the tree view.
- Preview: Switch to the preview mode.
- Copy (
 ): Click to copy the contents of the output to the clipboard.
 - Search fields and values (
 ): Search for the required text in the output.
 - Maximize (
 ): Click to maximize the Query Response field. Click Minimize (
 ) to minimize the field to the original size when maximized.
- Expand all fields (
Click Save to save the job and return to the Signature Verification Jobs screen.
Editing a signature verification job
Edit an adhoc signature verification job to update the name and the description of the job.
In Analytics, navigate to Signature Verification > Jobs.
The Signature Verification Jobs screen is displayed.
Locate the job to update.
From the Actions column, click the Edit (
 ) icon.
The Job screen is displayed.

Update the name and description as required.
The Indices and Query options can be edited if the job is in the Ready state, else they are available in the read-only mode.
View the JSON query in the Query field.
The following options are available for working with the query:
- Indent code (): Click to format the code using tab spaces.
- Remove white space from code (): Click to format the code by removing the white spaces and displaying the query in a continuous line.
- Undo (): Click to undo the last change made.
- Redo (): Click to redo the last change made.
- Indent code (
Click Run to test the query, if required.
View the result displayed in the Query Response field.
The following options are available to work with the output:
- Expand all fields (): Click to expand all fields in the result.
- Collapse all fields (): Click to collapse all fields in the result.
- Switch Editor Mode (): Click to select the editor mode. The following options are available:
- View: Switch to the tree view.
- Preview: Switch to the preview mode.
- Copy (): Click to copy the contents of the output to the clipboard.
- Search fields and values (): Search for the required text in the output.
- Maximize (): Click to maximize the Query Response field. Click Minimize () to minimize the field to the original size when maximized.
- Expand all fields (
Click Save to update the job and return to the Signature Verification Jobs screen.
4.19.5 - Using the scheduler
To view the list of tasks that are scheduled, from the Analytics screen, navigate to Scheduler > Tasks. The viewer role user or a user with the viewer role can only view logs and history related to the Scheduler. You need admin rights to create or modify schedules.
The following tasks are available by default:
| Task | Description |
|---|---|
| Export Troubleshooting Indices | Scheduled task for exporting logs from the troubleshooting index. |
| Export Policy Log Indices | Scheduled task for exporting logs from the policy index. |
| Export Protectors Status Indices | Scheduled task for exporting logs from the protector status index. |
| Delete Miscellaneous Indices | Scheduled task for deleting old versions of the miscellaneous index that are rolled over. |
| Delete DSG Error Indices | Scheduled task for deleting old versions of the DSG error index that are rolled over. |
| Delete DSG Usage Indices | Scheduled task for deleting old versions of the DSG usage matrix index that are rolled over. |
| Delete DSG Transaction Indices | Scheduled task for deleting old versions of the DSG transaction matrix index that are rolled over. |
| Signature Verification | Scheduled task for performing signature verification of log entries. |
| Export Audit Indices | Scheduled task for exporting logs from the audit index. |
| Rollover Index | Scheduled task for performing an index rollover. |
Ensure that the scheduled tasks are disabled on all the nodes before upgrading the ESA.
The scheduled task values on a new installation and an upgraded machine might differ. This is done to preserve any custom settings and modifications for the scheduled task. After upgrading the ESA, revisit the scheduled task parameters and modify them if required.

The list of scheduled tasks are displayed. You can create tasks, view, edit, enable or disable, and modify scheduled task properties from this screen. The following columns are available on this screen.
| Column | Description |
|---|---|
| Name | A unique name for the scheduled task. |
| Schedule | The frequency set for executing the task. |
| Task Template | The task template for creating the schedule. |
| Priority IPs | A list of IP addresses of the machines on which the task must be run. |
| Params | The parameters for the task that must be executed. |
| Enabled | Use this toggle switch to enable or disable the task from running as per the schedule. |
| Action | The actions that can be performed on the scheduled task. |
The available action options are:
- Click the Edit icon () to update the task.
- Click the Delete icon (
 ) to delete the task.
Creating a Scheduled Task
Use the repository scheduler to create scheduled tasks. You can set a scheduled task to run after a fixed interval, every day at a particular time, a fixed day every week, or a fixed day of the month. The scheduler runs only one instance of a particular task. If the task is already running, then the scheduler skips running the task again. For example, if a task is set to run every 1 minute, and the earlier instance is not complete, then the scheduler skips running the task. The scheduled task will be run again at the scheduled time after the current task is complete. Some of the fields also accept the special syntax. For the special syntax, refer here.
Complete the following steps to create a scheduled task.
From the Analytics screen, navigate to Scheduler > Tasks.
Click Add New Task.
The New Task screen appears.

Complete the fields for creating a scheduled task.
The following fields are available:
Name: Specify a unique name for the task.
Schedule: Specify the template and time for running the command using cron. The date and time when the command will be run appears in the area below the Schedule field. The following settings are available:
Select Template: Select a template from the list. If a template is selected and the date and time settings are modified, then the Custom template is used. The following templates are available:
- Custom: Specify a custom schedule for executing the task.
- Every Minute: Set the task to execute every minute.
- Every 5 Minutes: Set the task to execute after every 5 minutes.
- Every 10 Minutes: Set the task to execute after every 10 minutes.
- Every Hour: Set the task to execute every hour.
- Every 2 Hours: Set the task to execute every 2 hours.
- Every 5 Hours: Set the task to execute every 5 hours.
- Every Day: Set the task to execute every day at 12 am.
- Every Alternate Day: Set the task to execute every alternate day at 12 am.
- Every Week: Set the task to execute once every week on Sunday at 12 am.
- Every Month: Set the task to execute at 12 am on the first day of every month.
- Every Alternate Month: Set the task to execute at 12 am on the first day of every alternate month.
- Every Year: Set the task to execute at 12 am on the first of January every year.
Date and time: Specify the date and the time when the command must be executed. The following fields are available:
- Min: Specify the time settings in minutes for executing the command.
- Hrs: Specify the time settings in hours for executing the command.
- DOM: Specify the day of the month for executing the command.
- Mon: Specify the month for executing the command.
- DOW: Specify the day of the week for executing the command.
Task Template: Select a task template to view and specify the parameters for the scheduled task. The following task templates are available:
- ILM Multi Delete
- ILM Multi Export
- Audit index Rollover
- Signature Verification
Priority IPs: Specify a list of the ESA IP addresses in the order of priority for execution. The task is executed on the first IP address that is specified in this list. If the IP is not available to execute the task, then the job is executed on the next prioritized IP address in the list.
Use Only Priority IPs: Enable this toggle switch to only execute the task on any one node from the list of the ESA IP addresses specified in the priority field. If this toggle switch is disabled, then the task execution is first attempted on the list of IPs specified in the Priority IPs field. If a machine is not available, then the task is run on any machine that is available on the Audit Store cluster which might not be mentioned in the Priority IPs field.
Multi node Execution: If disabled, then the task is run on a single machine. Enable this toggle switch to run the task on all available machines.
Enabled: Use this toggle switch to enable or disable the task from running as per the schedule.
Specify the parameters for the scheduled task and click Save. The parameters are based on the OR condition. The task is run when any one of the conditions specified is satisfied.
The scheduled task is created and enabled. The job executes on the date and time set.
ILM Multi Delete:
This task is used for automatically deleting indexes when the criteria specified is fulfilled. It displays the required fields for specifying the criteria parameters for deleting indexes. You can use a regex expression for the index pattern.
- Index Pattern: A regex pattern for specifying the indexes that must be monitored.
- Max Days: The maximum number of days to retain the index after which they must be deleted. The default is 365 (365 days).
- Max Docs: The maximum document limit for the index. If the number of docs exceeds this number, then the index is deleted. The default is 1000000000 (1 Billion).
- Max MB(size): The maximum size of the index in MB. If the size of the index exceeds this number, then the index is deleted. The default is 150000 (150 GB).
Specify one or multiple options for the parameters.
The fields for ILM entries is shown in the following figure.

ILM Multi Export:
This task is used for automatically exporting logs when the criteria specified is fulfilled. It displays the required fields for specifying the criteria parameters for exporting indexes. This task is disabled by default after it is created. Enable the Use Only Priority IPs and specify specific ESA machines in the Priority IPs field this task is created to improve performance. Any indexes imported into ILM are not exported using this scheduled task. The Audit index export task is enhanced to support multiple indexes and is renamed to ILM Multi Export.
This task is available for processing the audit, troubleshooting, policy log, and protector status indexes.
- Index Pattern: The pattern for the indexes that must be exported. Use regex to specify multiple indexes.
- Max Days: The number of days to store indexes that match the index pattern. Any matched index beyond this age is exported. The default age specified is 365 days.
- Max Docs: The maximum docs present over all the indexes that match the index pattern. If the number of docs exceeds this number, then the matched indexes are exported. The default is 1000000000 (1 Billion).
- Max MB(size): The maximum size of all the indexes in MB that matched the index pattern. If the total size exceeds this number, then the matched indexes are exported. The default is 150000 (150 GB).
- File password: The password for the exported file. The password is hidden. Keep the password safe. A lost password cannot be retrieved.
- Retype File password: The password confirmation for the exported file.
- Dir Path: The directory for storing the exported index in the default path. The default path specified is /opt/protegrity/insight/archive/. You can specify and create nested folders using this parameter. Also, if the directory specified does not exist, then the directory is created in the /opt/protegrity/insight/archive/ directory.
You can specify one or multiple options for the Max Days, Max Docs, and Max MB(size) parameters.
The fields for the entries is shown in the following figure.

Audit Index Rollover:
This task performs an index rollover on the index referred by the alias when any of the specified conditions are fulfilled. The conditions are index age, number of documents in the index, or the index size crosses the specified value.
This task is available for processing the audit, troubleshooting, policy log, protector status, and DSG-related indexes.
- Max Age: The maximum age after which the index must be rolled over. This default is 30d, that is 30 days. The values supported are, y for years, M for months, w for weeks, d for days, h or H for hours, m for minutes, and s for seconds.
- Max Docs: The maximum number of docs that an index can contain. An index rollover is performed when this limit is reached. The default is 200000000, that is 200 million.
- Max Size: The maximum index size of the index that is allowed. An index rollover is performed when the size limit is reached. The default is 5gb. The units supported are, b for bytes, kb for kilobytes, mb for megabytes, gb for gigabytes, tb for terabytes, and pb for petabytes.
The fields for the Audit Index Rollover entries is shown in the following figure.

Signature Verification:
This task runs the signature verification tasks after the time interval that is set. It runs the default signature-related job and the ad-hoc jobs created on the Signature Verification tab.
- Max Job Idle Time Minutes: The maximum time to keep the jobs idle. After the jobs are idle for the time specified, the idle jobs are cleared and re-queued. The default specified is 2 minutes.
- Max Parallel Jobs Per Node: The maximum number of signature verification jobs to run in parallel on each system. If number of jobs specified here is reached, then new scheduled jobs are not started. This default is 4 jobs. For example, if 10 jobs are queued to run on 2 ESAs, then 4 jobs are started on the first ESA, 4 jobs are started on the second ESA, and 2 jobs will be queued to run till an ESA job slot gets free to accept and run the queued job.
The fields for the Manage Signature Verification Jobs entries is shown in the following figure.

Working with scheduled tasks
After creating a scheduled task, specify whether the task must be enabled or disabled for running. You can edit the task to modify the commands or the task schedule.
Complete the following steps to modify a task.
From the Analytics screen, navigate to Scheduler > Tasks.
The list of scheduled tasks appears.
Use the search field to search for a specific task from the list.
Click the Enabled toggle switch to enable or disable the task for running as per the schedule.
Alternatively, clear the Enabled toggle switch to prevent the task from running as per the schedule.
Click the Edit icon (
) to update the task.The Edit Task page is displayed.

Update the task as required and click Save.
The task is saved and run as per the defined schedule.
Viewing the scheduler monitor
The Monitor screen shows a list of all the scheduled tasks. It also displays whether the task is running or was executed successfully. You can also stop a running task or restart a stopped task from this screen.
Complete the following steps to monitor the tasks.
From the Analytics screen, navigate to Scheduler > Monitor.
The list of scheduled tasks appears.

The Tail option can be set from the upper-right corner of the screen. Setting the Tail option to ON updates the scheduler history list with the latest scheduled tasks that are run.
You can use the search field to search for specific tasks from the list.
Scroll to view the list of scheduled tasks executed. The following information appears:
- Name: This is the name of the task that was executed.
- IP: This is the host IP of the system that executed the task.
- Start Time: This is the time when the scheduled task started executing.
- End Time: This is the end time when the scheduled task finished executing.
- Elapsed Time: This is the execution time in seconds for the scheduled task.
- State: This is the state displayed for the task. The available states are:
- : Running. The task is running. You can click Stop from Actions to stop the task.
- : Queued to stop. The task processing will stop soon.
- : Stopped. The task has been stopped. The job might take about 20 seconds to stop the process.
If an ILM Multi Export job is stopped, then the next ILM Multi Export job cannot be started within 2 minutes of stopping a previous running job.
If a signature verification scheduler job is stopped from the Scheduler > Monitor page, then the status might be updated on this page after about 5 minutes.
- : Completed. The task is complete.
- Action: Click Stop to abort the running task. This button is only displayed for tasks that are running.
Using the Index State Management
Use the scheduler and the Analytics ILM for managing indexes. The Index State Management can be used to manage indexes not supported by the scheduler or ILM. However, it is not recommended to use the Index State Management for managing indexes. The Index State Management provides configurations and settings for rotating the index.
Perform the following steps to configure the index:
- Log in to the ESA Web UI.
- Navigate to Audit Store > Dashboard. The Audit Store Dashboards appears. If a new tab does not automatically open, click Open in a new tab.
- Update the index definition.
- From the menu, navigate to Index Management.
- Click the required index entry.
- Click Edit.
- Select JSON editor.
- Click Continue.
- Update the required configuration under rollover.
- Click Update.
- Update the policy definition for the index.
- From the menu, navigate to Index Management.
- Click Policy managed indexes.
- Select the check box for the index that was updated.
- CLick Change Policy.
- Select the index from the Managed indices list.
- From the State filter, select Rollover.
- Select the index from the New policy list.
- Ensure that the Keep indices in their current state after the policy takes effect option is selected.
- Click Change.
Special syntax
The special syntax for specifying the schedule is provided in the following table.
| Character | Definition | Fields | Example |
|---|---|---|---|
| , | Specifies a list of values. | All | 1, 2, 5, 6. |
| - | Specifies a range of values. | All | 3-5 specifies 3, 4, 5. |
| / | Specifies the values to skip. | All | */4 specifies 0, 4, 8, and so on. |
| * | Specifies all values. | All | * specifies all the values in the field where it is used. |
| ? | Specifies no specific value. | DOM, DOW | 4 in the day-of-month field and ? in the day-of-week field specifies to run on the 4th day of the month. |
| # | Specifies the nth day of the month. | DOW | 2#4 specifies 2 for Monday and 4 for 4th week in the month. |
| L | Specifies the last day in the week or month. | DOM, DOW | 7L specifies the last Saturday in the month. |
| W | Specifies the weekday closest to the specified day. | DOM | 12W specifies to run on the 12th of the month. If 12 is a Saturday, then run on Friday the 11th. If 12th is a Sunday, then run on Monday the 13th. |
4.20 - Installing Protegrity Appliances on Cloud Platforms
This section describes the procedure for installing ESA appliances on cloud platforms, such as, Amazon Web Services (AWS), Google Cloud Platform (GCP), and Microsoft Azure.
4.20.1 - Installing ESA on Amazon Web Services (AWS)
Amazon Web Services (AWS) is a cloud-based computing service. It provides several services, such as, computing power through Amazon Elastic Compute Cloud (EC2), storage through Amazon Simple Storage Service (S3), and so on.
The AWS stores Amazon Machine Images (AMIs), which are templates or virtual images containing an operating system, applications, and configuration settings.
Protegrity appliances offer flexibility and can run in the following environments:
- On-premise: The ESA is installed and runs on dedicated hardware.
- Virtualized: The ESA is installed and runs on a virtual machine.
- Cloud: The ESA is installed and runs on or as part of a Cloud-based service.
Protegrity provides AMIs that contain the ESA image, running on a customized and hardened Linux distribution.
4.20.1.1 - Verifying Prerequisites
This section describes the prerequisites and tasks for installing Protegrity appliances on AWS. In addition, it describes some best practices for using the Protegrity ESA appliances on AWS effectively.
The Full OS Backup/Restore features of the Protegrity appliances is not available on the AWS platform.
Prerequisites
The following prerequisites are essential to install the Protegrity ESA appliances on AWS:
- Login URL for the AWS account
- AWS account with the authentication credentials
- Access to the My.Protegrity portal
Hardware Requirements
As the Protegrity ESA appliances are hosted and run on AWS, the hardware requirements are dependent on the configurations provided by Amazon. However, these requirements can autoscale as per customer requirements and budget.
The minimum recommendation for an ESA appliance is 8 CPU cores and 32 GB memory. On AWS, this configuration is available in the t3a.2xlarge option.
For more information about the hardware requirements of the ESA, refer to the section System Requirements.
Network Requirements
Protegrity ESA appliances on AWS are provided with an Amazon Virtual Private Cloud (VPC) networking environment. Amazon VPC enables you to access other AWS resources, such as other instances of Protegrity appliances on AWS.
You can configure the Amazon VPC by specifying its usable IP address range. You can also create and configure subnets, network gateways, and the security settings.
For more information about the Amazon VPC, refer to the Amazon VPC documentation at: http://docs.aws.amazon.com/AmazonVPC/latest/UserGuide/VPC_Introduction.html.
If you are using the ESA or the DSG appliance with AWS, then ensure that the inbound and outbound ports of the appliances are configured in the Amazon Virtual Private Cloud (VPC). This ensures that they are able to interact with the other required components.
For more information about the list of inbound and outbound ports to be configured based on the ESA or the DSG, refer Open Listening Ports.
Accessing the Internet
The following points list the ways in which you can provide or limit Internet access for an ESA instance in the VPC:
- If you need to connect the ESA to the Internet, then ensure that the ESA is on the default subnet so that it uses the Internet gateway that is included in the VPC.
- If you need to allow the ESA to initiate outbound connections to, and prevent inbound connections from the Internet, then ensure that you use a Network Address Translation (NAT) device.
- If you want to block the connection of the ESA to the Internet, then ensure that the ESA is on a private subnet.
Accessing a Corporate Network
If you need to connect the ESA to a corporate network, then ensure that you use an IPSec hardware VPN connection.
4.20.1.2 - Obtaining the AMI
Before creating the instance on AWS, you must obtain the image from the My.Protegrity portal. On the portal, you select the required ESA version and choose AWS as the target cloud platform. You then share the product to your cloud account. The following steps describe how to share the AMI to your cloud account.
To obtain and share the AMI:
Log in to the My.Protegrity portal with your user account.
Click Product Management > Explore Products > Data Protection.
Select the required ESA Platform Version from the drop-down.
The Product Family table will update based on the selected ESA Platform Version.
The ESA Platform Versions listed in drop-down menu reflect all versions. These include versions that were either previously downloaded or shipped within the organization along with any newer versions available thereafter. Navigate to Product Management > My Product Inventory to check the list of products previously downloaded.
The images in this section consider the ESA as a reference. Ensure that you select the required image.
Select the Product Family.
The description box will populate with the Product Family details.

Click View Products to advance to the product listing screen.

Callout Element Name Description 1 Target Platform Details Shows details about the target platform. 2 Product Name Shows the product name. 3 Product Family Shows the product family name. 4 OS Details Shows the operating system name. 5 Version Shows the product version. 6 End of Support Date Shows the final date that Protegrity will provide support for the product. 7 Action Click the View icon (  ) to open the Product Detail screen.
8 Export as CSV Downloads a .csv file with the results displayed on the screen. 9 Search Criteria Type text in the search field to specify the search filter criteria or filter the entries using the following options:- OS- Target Platform 10 Request one here Opens the Create Certification screen for a certification request. Select the AWS cloud target platform you require and click the View icon (
) from the Action column.The Product Detail screen appears.

Callout Element Name Description 1 Product Detail Shows the following information about the product:- Product name- Family name- Part number- Version- OS details- Hardware details- Target platform details- End of support date
- Description2 Product Build Number Shows the product build number. 3 Release Type Name Shows the type of build, such as, release, hotfix, or patch. 4 Release Date Shows the release date for the build. 5 Build Version Shows the build version. 6 Actions Shows the following options for download:- Click the Share Product icon (  ) to share the product through the cloud.- Click the Download Signature icon (
 ) to download the product signature file.- Click the Download Readme icon (
 ) to download the Release Notes.
7 Download Date Shows the date when the file was downloaded. 8 User Shows the user name who downloaded the build. 9 Active Deployment Select the check box to mark the software as active. Clear the check box to mark the software as inactive. This option is available only after you download a product.| |10|Product Build Number|Shows the product build number.|
Click the Share Product icon (
) to share the desired cloud product.If the access to the cloud products is restricted and the Customer Cloud Account details are not available, then a message appears. The message displays the information that is required and the contact information for obtaining access to cloud share.
A dialog box appears and your available cloud accounts will be displayed.

Select your required cloud account in which to share the Protegrity product.
Click Share.
A message box is displayed with the command line interface (CLI) instructions with the option to download a detailed PDF containing the cloud web interface instructions. Additionally, the instructions for sharing the cloud product are sent to your registered email address and to your notification inbox in My.Protegrity.

Click the Copy icon (
 ) to copy the command for sharing the cloud product and run the command in CLI. Alternatively, click Instructions to download the detailed PDF instructions for cloud sharing using the CLI or the web interface.
The cloud sharing instruction file is saved in a
.pdfformat. You need a reader, such as, Acrobat Reader to view the file.The Cloud Product will be shared with your cloud account for seven (7) days from the original share date in the My.Protegrity portal.
After the seven (7) day time period, you need to request a new share of the cloud product through My.Protegrity.com.
4.20.1.3 - Loading the Protegrity Appliance from an Amazon Machine Image (AMI)
This section describes the tasks that need to be performed for loading the ESA appliance from an AMI, which is provided by Protegrity.
4.20.1.3.1 - Creating an ESA Instance from the AMI
Perform the following steps to create an ESA instance using an AMI.
Access AWS at the following URL:
The AWS home screen appears.
Click the Sign In to the Console button.
The AWS login screen appears.
On the AWS login screen, enter the following details:
- Account Number
- User Name
- Password
Click the Sign in button.
After successful authentication, the AWS Management Console screen appears.
Click Services.
Navigate to Compute > EC2
The EC2 Dashboard screen appears.
Contact Protegrity Support and provide your Amazon Account Number so that the required Protegrity AMIs can be made accessible to the account.
Click on AMIs under the Images section.
The AMIs that are accessible to the user account appear in the right pane.
Select the AMI of the required ESA in the right pane.
Click the Launch instance from AMI button to launch the selected ESA appliance.
The Launch an instance screen appears.
Depending on the performance requirements, choose the required instance type.
For the ESA appliance, an instance with 32 GB RAM is recommended.
If you need to configure the details of the instance, then click the Next: Configure Instance Details button.
The Configure Instance Details screen appears.
Specify the following parameters on the Configure Instance Details screen:
Number of Instances: The number of instances that you want to launch at a time.
Purchasing option: The option to request Spot instances, which are unused EC2 instances. If you select this option, then you need to specify the maximum price that you are willing to pay for each instance on an hourly basis.
Network: The VPC to launch the ESA in. If you need to create a VPC, then click the Create new VPC link. For more information about creating a VPC, refer to the section Configuring VPC.
Subnet: The Subnet to be used to launch the ESA. A subnet resides in one Availability zone.
If you need to create a Subnet, then click the Create new subnet link.
For more information about creating a subnet, refer to the section Adding a Subnet to the Virtual Private Cloud (VPC).
Auto-assign Public IP: The IP address from where your instance can be accessed over the Internet. You need to select Enable from the list.
Availability Zone: A location within a region that is designed to be isolated from failures in other Availability Zones.
IAM role: This option is disabled by default.
Shutdown behaviour: The behaviour of the ESA when an OS-level shut down command is initiated.
Enable Termination Protection: The option to prevent accidental termination of the ESA instance.
Monitoring: The option to monitor, collate, and analyze the metrics for the instance of your ESA.
If you need to add additional storage to the ESA instance, then click the Next: Add Storage button.
The Add Storage screen appears.
You can provision additional storage for the ESA by clicking the Add New Volume button. Root is the default volume for your instance.
Alternatively, you can provision additional storage for the ESA later too.
For more information on configuring the additional storage on the instance of the ESA, refer to the section Increasing Disk Space on the Appliance.
If you need to create a key-value pair, then click the Add additional tags button.
Enter the Key and Value information and select the Resource types from the drop-down.
Select the Existing Key Pair option and choose a key from the list of available key pairs.
- Alternatively, you can select the Create a new Key Pair, to create a new key pair.
- If you proceed without a key pair, then the system will not be accessible.
If you need to configure the Security Group, then click the Next: Configure Security Group button.
The Configure Security Group screen appears.
You can assign a security group from the available list.
Alternatively, you can create security group with rules for the required inbound and outbound ports.
The Summary section lists all the details related to the ESA instance. You can review the required sections before you launch your instance.
Click the Launch instance button.
The ESA instance is launched and the Launch Status screen appears.
Click the View Instances button.
The Instances screen appears listing the ESA instance.
If you need to use the instance, then access the ESA CLI Manager using the IP address of the ESA.
4.20.1.3.2 - Configuring the Virtual Private Cloud (VPC)
If you need to connect two Protegrity appliances, or to the Internet, or a corporate network using a Private IP address, then you might need to configure the VPC.
For more information about the various inbound and outbound ports to be configured in the VPC, refer to section Open Listening Ports.
Perform the following steps to configure the VPC for the instance.
Ensure that you are logged in to AWS and at the AWS Management Console screen.
On the AWS Management Console, click VPC under the Networking section.
The VPC Dashboard screen appears.
Click on Your VPCs under the Virtual Private Cloud section.
The Create VPC screen appears listing all available VPCs in the right pane.
Click the Create VPC button.
The Create VPC dialog box appears.
Specify the following parameters on the Create VPC dialog box:
- Name tag: The name of the VPC.
- CIDR block: The range of the IP addresses for the VPC in x.x.x.x/y form where x.x.x.x is the IP address and y is the /16 and /28 netmask.
- Tenancy: This parameter can be set to Default or Dedicated. If the value is set to Default, then it selects the tenancy attribute specified while launching the instance of the appliance for the VPC.
Click the Yes, Create button.
The VPC is created.
4.20.1.3.3 - Adding a Subnet to the Virtual Private Cloud (VPC)
You can add Subnets to your VPC. A subnet resides in an Availability zone. When you create a subnet, you can specify the CIDR block.
Perform the following steps to create the subnet for your VPC.
Ensure that you are logged in to AWS and at the AWS Management Console screen.
On the AWS Management Console, click VPC under the Networking section.
The VPC Dashboard screen appears.
Click Subnets under the Virtual Private Cloud section.
The create subnet screen appears listing all available subnets in the right pane.
Click the Create Subnet button.
The Create Subnet dialog box appears.
Specify the following parameters on the Create Subnet dialog box.
- Name tag: The name for the Subnet.
- VPC: The VPC for which you want to create a subnet.
- Availability Zone: The Availability zone where the subnet resides.
- CIDR block: The range of the IP addresses for the VPC in x.x.x.x/y form where x.x.x.x is the IP address and y is the /16 and /28 netmask.
Click the Yes, Create button.
The subnet is created.
4.20.1.3.4 - Finalizing the Installation of Protegrity Appliance on the Instance
When you install the ESA appliance, it generates multiple security identifiers such as, keys, certificates, secrets, passwords, and so on. These identifiers ensure that sensitive data is unique between two appliances in a network. When you receive a Protegrity appliance image, the identifiers are generated with certain values. If you use the security identifiers without changing their values, then security is compromised and the system might be vulnerable to attacks.
Rotating Appliance OS keys to finalize installation
Using the Rotate Appliance OS Keys tool, you can randomize the values of these security identifiers for an appliance. During the finalization process, you run the key rotation tool to secure your appliance.
If you do not complete the finalization process, then some features of the appliance may not be functional including the Web UI.
For example, if the OS keys are not rotated, then you might not be able to add appliances to a Trusted Appliances Cluster (TAC).
For information about the default passwords, refer to the section Launching the ESA instance on Amazon Web Services in the Release Notes 10.2.0 from the My.Protegrity.
4.20.1.3.4.1 - Logging to the AWS Instance using the SSH Client
After installing the ESA on AWS, you must log in to the AWS instance using the SSH Client.
To login to the AWS instance using the SSH Client:
Start the local SSH Client.
Perform the SSH operation on the AWS instance using the key pair utilizing the following command. Ensure that you use the local_admin user to perform the SSH operation.
ssh -i <path of the private key pair> local_admin@<IP address of the AWS instance>Press Enter.
4.20.1.3.4.2 - Finalizing an AWS Instance
You can finalize the installation of the ESA after signing in to the CLI Manager.
Before you begin
“Before finalizing the AWS instance, consider the following:
The SSH Authentication Type by default, is set to Public key. Ensure that you use the Public key for accessing the CLI. You can change the authentication type from the ESA Web UI, once the finalization is completed.
Ensure that the finalization process is initiated from a single session only. If you start finalization simultaneously from a different session, then the “Finalization is already in progress.” message appears. You must wait until the finalization of the ESA instance is successfully completed.
Ensure that the session is not interrupted. If the session is interrupted, then the ESA becomes unstable and the finalization process is not completed on that instance.
Finalizing the AWS instance
Perform the following steps to finalize the AWS instance:
Sign in to the ESA CLI Manager of the instance created using the default local admin credentials.
The following screen appears.

Select Yes to initiate the finalization process.
If you select No, then the finalization process is not initiated.
To manually initiate the finalization process, navigate to Tools > Finalize Installation and press ENTER.
A confirmation screen to rotate the appliance OS keys appears. Select OK to rotate the appliance OS keys.
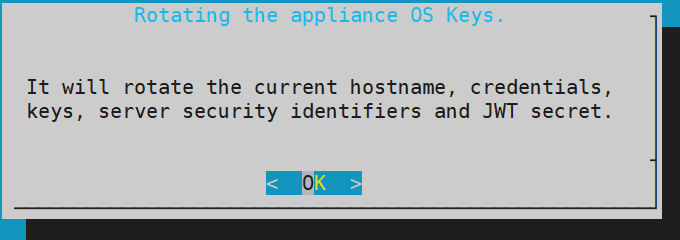
The following screen appears.
To update the user passwords, provide the credentials for the following users:
- root
- admin
- viewer
- local_admin
Select Apply.
The user passwords are updated and the appliance OS keys are rotated.
The finalization process is completed.
4.20.1.4 - Backing up and Restoring Data on AWS
A snapshot represents a state of an instance or disk at a point in time. You can use a snapshot of an instance or a disk to backup or restore information in case of failures.
Creating a Snapshot of a Volume on AWS
In AWS, you can create a snapshot of a volume.
To create a snapshot on AWS:
On the EC2 Dashboard screen, click Volumes under the Elastic Block Store section.
The screen with all the volumes appears.
Right click on the required volume and select Actions > Create Snapshot.
The Create Snapshot screen for the selected volume appears.
Enter the required description for the snapshot in the Description text box.
Select Add tag to add a tag.
Enter the tag in the Key and Value text boxes.
Click Add Tag to add additional tags.
Click Create Snapshot.
A message Create Snapshot Request Succeeded appears, along with the snapshot ID.
Ensure that you note the snapshot ID.
Ensure that the status of the snapshot is completed.
Restoring a Snapshot on AWS
On AWS, you can restore data by creating a volume of a snapshot. You then attach the volume to an EC2 instance.
Before you begin
Ensure that the status of the instance is Stopped.
Ensure that you detach an existing volume on the instance.
Restoring a Snapshot
To restore a snapshot on AWS:
On the EC2 Dashboard screen, click Snapshots under the Elastic Block Store section.
The screen with all the snapshots appears.
Right-click on the required snapshot and select Create Volume.
The Create Volume screen form appears.
Select the type of volume from the Volume Type drop-down list.
Enter the size of the volume in the Size (GiB) textbox.
Select the availability zone from the Availability Zone* drop-down list.
Click Add Tag to add tags.
Click Create Volume.
A message Create Volume Request Succeeded along with the volume id appears. The volume with the snapshot is created.
Ensure that you note the volume id.
Under the EBS section, click Volume.
The screen displaying all the volumes appears.
Right-click on the volume that is created.
The pop-up menu appears.
Select Attach Volume.
The Attach Volume dialog box appears.
Enter the Instance ID or name of the instance in the Instance text box.
Enter /dev/xvda in the Device text box.
Click Attach to add the volume to an instance.
The snapshot is added to the EC2 instance as a volume.
4.20.1.5 - Increasing Disk Space on the Appliance
After an ESA instance is created, you can increase the disk space on the appliance.Ensure that the instance is powered off before performing the following steps.
To increase disk space for the ESA on AWS:
On the EC2 Dashboard screen, click Volumes under the Elastic Block Store section.
The Create Volume screen appears.
Click the Create Volume button.
The Create Volume dialog box appears.
Enter the required size of the additional disk space in the Size (GiB) text box.
Enter the snapshot ID of the instance, for which the additional disk space is required in the Snapshot ID text box.
Click the Create button.
The required additional disk space is created as a volume.
Right-click on the additional disk, which is created.
The pop-up menu appears.
Select Attach Volume.
The Attach Volume dialog box appears.
Enter the Instance ID or name tag of the ESA to add the disk space in the Instance text box.
Click the Attach button to add the disk space to the required ESA instance.
The disk space is added to the ESA instance.
After the disk space on the ESA instance is added, navigate to Instances under the Instances section.
Right-click on the ESA instance in which the disk space was added.
Select Instance State > Start.
The ESA instance is started.
After the ESA instance is started, configure the additional storage using the CLI Manager.
For more information on configuring the additional storage on the ESA, refer to section Installation of Additional Hard Disks.
4.20.1.6 - Best Practices for Using Protegrity Appliances on AWS
There are recommended best practices for using Protegrity appliances on AWS.
Force SSH Keys
Configure the ESA to enable SSH keys and disable SSH passwords for all users.
If you need to create or join a Trusted Appliance cluster, then ensure that SSH passwords are enabled when you are creating or joining the cluster, and then disabled.
For more information about the SSH keys, refer to section Working with Secure Shell (SSH) Keys.
Install Upgrades
After you run the Appliance-rotation tool, it is recommended that you install all the latest Protegrity updates.
Configure your VPC or Security Group
To ensure successful communication between the ESA and the other entities connected to it.
For more information about the list of inbound and outbound ports for the ESA, refer to section Open Listening Ports.
4.20.1.7 - Running the Appliance-Rotation-Tool
The Appliance-rotation-tool modifies the required keys, certificates, credentials, and passwords for the appliance. This helps to differentiate the sensitive data on the appliance from other similar instances.
Before you begin
If you are configuring an ESA appliance instance, then you must run the Appliance-rotation-tool after creating the instance of the appliance.
Ensure that you do not run the appliance rotation tool when the ESA appliance OS keys are in use.
For example, you must not run the appliance rotation tool when a cluster is enabled, two-factor authentication is enabled, external users are enabled, and so on.
How to run the Appliance-Rotation-Tool
Perform the following steps to rotate the required keys, certificates, credentials, and passwords for the appliance.
To use the Appliance-rotation-tool:
On the ESA, navigate to CLI Manager > Tools > Rotate Appliance OS Keys.
The root password dialog box appears.
Enter the root password.
Press ENTER.
The Appliance OS Key Rotation dialog box appears.

Select Yes.
Press ENTER.
The administrative credentials dialog box appears.

Enter the Account name and Account password on the ESA appliance.
Select OK.
To update the user passwords, provide the credentials for the users on the User’s Passwords screen. If default users such as root, admin, viewer, and local_admin have been manually deleted, they will not be listed on the User’s Passwords screen. Otherwise, to update the passwords, provide credentials for the following default users:
- root
- admin
- viewer
- local_admin
Select Apply. The user passwords are updated.
The process to rotate the required keys, certificates, credentials, and other identifiers on the ESA starts.
4.20.1.8 - Working with Cloud-based Applications
Cloud-based applications are products or services for storing data on the cloud. In cloud-based applications, the computing and processing of data is handled on the cloud. Local applications interact with the cloud services for various purposes, such as, data storage, data computing, and so on. Cloud-based applications are allocated resources dynamically and aim at reducing infrastructure cost, improving network performance, easing information access, and scaling of resources.
AWS offers a variety of cloud-based products for computing, storage, analytics, networking, and management. Using the Cloud Utility product, services such as, CloudWatch and AWS CLI are leveraged by the Protegrity appliances.
Prerequisites
The following prerequisites are essential for AWS Cloud Utility.
The Cloud Utility AWS v2.3.0 product must be installed.
From 8.0.0.0, if an instance is created on the AWS using the cloud image, then Cloud Utility AWS is preinstalled on this instance.
For more information about installing the Cloud Utility AWS v2.3.0, refer to the Protegrity Installation Guide.
If you are launching a Protegrity appliance on an AWS EC2 instance, then you must have a valid IAM Role.
For more information about IAM Role, refer to Configuring Access for AWS Resources.
If you are launching a Protegrity appliance on a non-AWS instance, such as on-premise, Microsoft Azure, or GCP instance, then the AWS Configure option must be set up.
For more information about configuring AWS credentials, refer to AWS Configure.
The user accessing the Cloud Utility AWS Tools must have AWS Admin permission assigned to the role.
For more information about AWS admin, refer to Managing Roles.
4.20.1.8.1 - Configuring Access for AWS Resources
A server might contain resources that only the authorized users can access. For accessing a protected resource, you must provide valid credentials to utilize the services of the resource. Similarly, on the AWS platform, only privileged users can access and utilize the AWS cloud applications. The Identity and Access Management (IAM) is the mechanism for securing access to your resources on AWS.
The two types of IAM mechanisms are as follows:
IAM user is an entity that represents users on AWS. To access the resources or services on AWS, the IAM user must have the privileges to access these resources. By default, you have to set up all required permissions for a user. Each IAM user can have specific defined policies. An IAM user account is beneficial as it can have special permissions or privileges associated for a user.
For more information about creating an IAM user, refer to the following link:
https://docs.aws.amazon.com/IAM/latest/UserGuide/id_users_create.html
An IAM user can access the AWS services on the required Protegrity appliance instances with the access keys. The access keys are the authentication mechanisms that authorize AWS CLI requests. The access keys can be generated when you create the IAM user account. Similar to the username and password, the access keys consist of access key ID and the secret access key. The access keys validate a user to access the required AWS services.
For more information about setting up an IAM user to use AWS Configure, refer to AWS Configure.
IAM role is the role for your AWS account and has specific permissions associated with it. An IAM role has defined permissions and privileges which can be given to multiple IAM users. For users that need same permissions to access the AWS services, you should associate an IAM role with the given user account.
If you want a Protegrity appliance instance to utilize the AWS resources, the instance must be provided with the required privileges. This is achieved by attaching an IAM role to the instance. The IAM role must have the required privileges to access the AWS resources.
For more information about creating an IAM role, refer to the following link:
https://docs.aws.amazon.com/IAM/latest/UserGuide/id_roles_create.html
For more information about IAM, refer to the following link.
https://docs.aws.amazon.com/IAM/latest/UserGuide/introduction.html
AWS Configure
The AWS Configure operation is a process for configuring an IAM user to access the AWS services on the Protegrity appliance instance. These AWS services include CloudWatch, CloudTrail, S3 bucket, and so on.
To utilize AWS resources and services, you must set up AWS Configure if you have an IAM User.
To set up AWS Configure on a non-AWS instance, such as on-premise, Microsoft Azure, or GCP instance, you must have the following:
A valid IAM User
Secret key associated with the IAM User
Access key ID for the IAM User
The AWS Region on whose servers you want to send the default service requests
For more information about the default region name, refer to the following link.
https://docs.aws.amazon.com/cli/latest/userguide/cli-chap-configure.html
If the access keys or the IAM role do not have the required privileges, then the user cannot utilize the corresponding AWS resources.
For AWS Configure, only one IAM user can be configured for an appliance at a time.
Configuring AWS Services
Below are instructions for configuring AWS services.
Before you begin
It is recommended to configure the AWS services from the Tools > Cloud Utility AWS Tools > AWS Configure menu.
On the Appliance Web UI, ensure that the AWS Admin privilege is assigned to the user role for configuring AWS on non-AWS instance.
How to configure AWS Services
To configure the AWS services:
Login to the Appliance CLI Manager.
To configure the AWS services, navigate to Tools > Cloud Utility AWS Tools > AWS Configure.
Enter the root credentials.
The following screen appears.
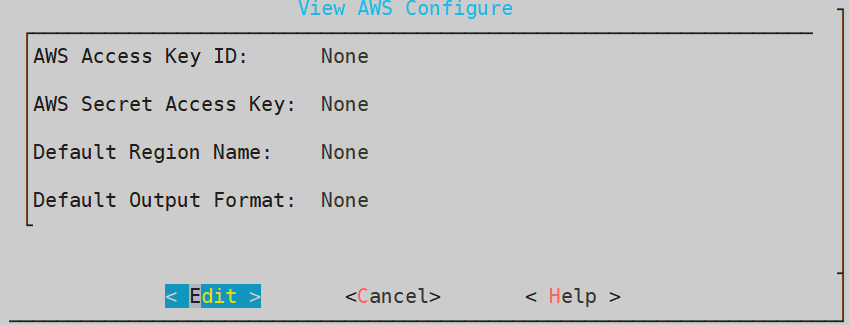
Select Edit and press ENTER.
Enter the AWS credentials associated with your IAM user in the AWS Access Key ID and AWS Secret Access Key text boxes.
Enter the region name in the Default Region Name text box. This field is case sensitive. Ensure that the values are entered in small-case.
For more information about the default region name, refer to the following link:
https://docs.aws.amazon.com/cli/latest/userguide/cli-chap-configure.html
Enter the output format in the Default Output Format text box. This field is case sensitive. Ensure that the values are entered in small-case.
If the field is left empty, the Default Output Format is json. However, the supported Default Output Formats are json, table, and text.
For more information about the default output format, refer to the following link:
https://docs.aws.amazon.com/cli/latest/userguide/cli-chap-configure.html
Select OK and press ENTER.
A validation screen appears.
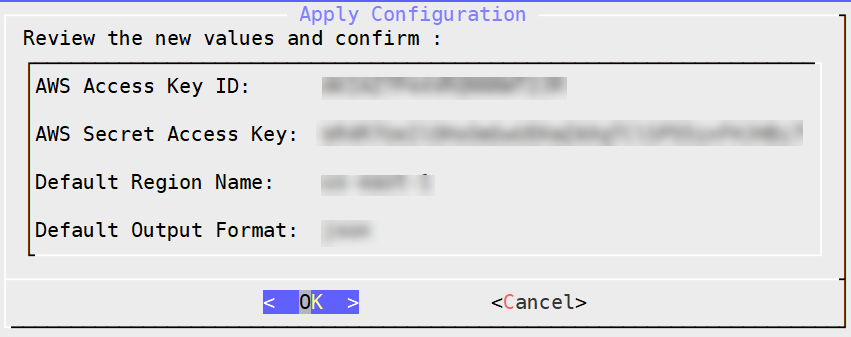
Select OK and press ENTER.
A confirmation screen appears.
Select OK.
The configurations are applied successfully.
4.20.1.8.2 - Working with CloudWatch Console
AWS CloudWatch tool is used for monitoring applications. Using CloudWatch, you can monitor and store the metrics and logs for analyzing the resources and applications.
CloudWatch allows you to collect metrics and track them in real-time. Using this service you can configure alarms for the metrics. CloudWatch provides visibility into the various aspects of your services including the operational health of your device, performance of the applications, and resource utilization.
For more information about AWS CloudWatch, refer to the following link:
https://docs.aws.amazon.com/AmazonCloudWatch/latest/monitoring/WhatIsCloudWatch.html
CloudWatch logs help you to monitor a cumulative list of all the logs from different applications on a single dashboard. This provides a central point to view and search the logs which are displayed in the order of the time when they were generated. Using CloudWatch you can store and access your log files from various sources. CloudWatch allows you to query your log data, monitor the logs which are originating from the instances and events, and retain and archive the logs.
For more information about CloudWatch logs, refer to the following link:
https://docs.aws.amazon.com/AmazonCloudWatch/latest/logs/WhatIsCloudWatchLogs.html
Prerequisites
For using AWS CloudWatch console, ensure that the IAM role or IAM user that you want to integrate with the appliance must have CloudWatchAgentServerPolicy policy assigned to it.
For more information about using the policies with the IAM Role or IAM User, refer to the following link:
4.20.1.8.2.1 - Integrating CloudWatch with Protegrity Appliance
You must enable CloudWatch integration to use the AWS CloudWatch services. This helps you to send the metrics and the logs from the appliances to the AWS CloudWatch Console.
The following section describes the steps to enable CloudWatch integration on Protegrity appliances.
To enable AWS CloudWatch integration:
Login to the ESA CLI Manager.
To enable AWS CloudWatch integration, navigate to Tools > Cloud Utility AWS Tools > CloudWatch Integration.
Enter the root credentials.
The following screen appears.

The warning message is displayed due to the cost involved from AWS.
For more information about the cost of integrating CloudWatch, refer to the following link:
Select Yes and press ENTER.
A screen listing the logs that are being sent to the CloudWatch Console appears.
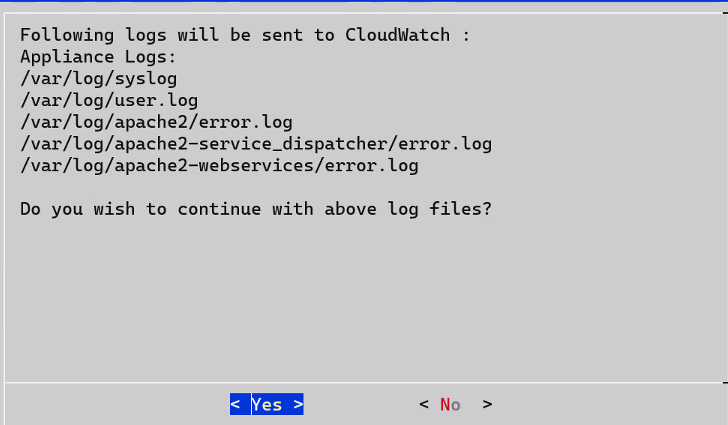
Select Yes.
Wait till the following screen appears.
Select OK.
CloudWatch integration is enabled successfully. The CloudWatch service is enabled on the Web UI and CLI.
4.20.1.8.2.2 - Configuring Custom Logs on AWS CloudWatch Console
You can send logs from an appliance which is on-premise or launched on any of the cloud platforms, such as, AWS, GCP, or Azure. The logs are sent from the appliances and stored on the AWS CloudWatch Console. By default, the following logs are sent from the appliances:
- Syslogs
- Current events logs
- Apache2 error logs
- Service dispatcher error logs
- Web services error logs
You can send custom log files to the AWS CloudWatch Console. To send custom log files to the AWS CloudWatch Console, you must create a file in the /opt/aws/pty/cloudwatch/config.d/ directory. You can add or edit the log streams in this file to generate the custom logs with the following parameters.
You must not edit the default configuration file, appliance.conf, in the /opt/aws/pty/cloudwatch/config.d/ directory.
The following table explains the parameters that you must use to configure the log streams.
| Parameter | Description | Example |
|---|---|---|
| file_path | Location where the file or log is stored | “/var/log/appliance.log” |
| log_stream_name | Name of the log that will appear on the AWS CloudWatch Console | “Appliance_Logs” |
| log_group_name | Name under which the logs are displayed on the CloudWatch Console | - On the CloudWatch Console, the logs appear under the hostname of the ESA instance.- Ensure that you must not modify the parameter log_group_name and its value {hostname}. |
Sample configuration files
Do not edit the appliance.conf configuration file in the /opt/aws/pty/cloudwatch/config.d/ directory.
If you want to configure a new log stream, then you must use the following syntax:
[
    {
            "file_path": "<path_of_the_first_log_file>",
            "log_stream_name": "<Name_of_the_log_stream_to_be_displayed_in_CloudWatch>",
            "log_group_name": "{hostname}"
    },
                .
                .
                .
    {
            "file_path": "<path_of_the_nth_log_file>",
            "log_stream_name": "<Name_of_the_log_stream_to_be_displayed_in_CloudWatch>",
            "log_group_name": "{hostname}"
    }
]
The following snippet displays the sample configuration file, configuration_filename.conf, that sends appliance logs to the AWS CloudWatch Console.
[
    {
            "file_path": "/var/log/syslog",
            "log_stream_name": "Syslog",
            "log_group_name": "{hostname}"
    },
    {
            "file_path": "/var/log/user.log",
            "log_stream_name": "Current_Event_Logs",
            "log_group_name": "{hostname}"
    }
]
If you configure custom log files to send to CloudWatch Console, then you must reload the CloudWatch integration or restart the CloudWatch service. Also, ensure that the CloudWatch integration is enabled and running.
For more information about Reloading AWS CloudWatch Integration, refer to Reloading AWS CloudWatch Integration.
4.20.1.8.2.3 - Toggling the CloudWatch Service
In the Protegrity appliances, the Cloudwatch service enables the transmission of logs from the appliances to the AWS CloudWatch Console. Enabling the AWS Cloudwatch Integration also enables this service with which you can start or stop the logs from being sent to the AWS CloudWatch Console. The following sections describe how to toggle the CloudWatch service for pausing or continuing log transmission. The toggling can be performed in either the CLI Manager or the Web UI.
Before you begin
Ensure that the valid AWS credentials are configured before toggling the CloudWatch service.
For more information about
Starting or Stopping the CloudWatch Service from the Web UI
If you want to temporarily stop the transmission of logs from the appliance to the AWS Console, then you can stop the CloudWatch Service.
To start or stop the AWS CloudWatch service from the Web Ui:
Login to the Appliance Web UI.
Navigate to System > Services.
Locate the CloudWatch service to start or stop. Select the appropriate icon, either Start or Stop, to perform the desired action.
- Select Stop to stop the transmission of logs and metrics.
- Select Start or Restart to start the CloudWatch service.
Starting or Stopping the CloudWatch Service from the CLI Manager
If you want to temporarily stop the transmission of logs from the appliance to the AWS Console, then you can stop the CloudWatch Service.
To start or stop the AWS CloudWatch service from the CLI Manager:
Login to the appliance CLI Manager.
Navigate to Administration > Services.
Locate the CloudWatch service to start or stop. Select the appropriate icon, either Start or Stop, to perform the desired action.
- Select Stop to stop the transmission of logs and metrics.
- Select Start to start the CloudWatch service.
4.20.1.8.2.4 - Reloading the AWS CloudWatch Integration
If you want to update the existing configurations in the /opt/aws/pty/cloudwatch/config.d/ directory, then you must reload the CloudWatch integration.
To reload the AWS CloudWatch integration:
Login to the ESA CLI Manager.
To reload CloudWatch, navigate to Tools > Cloud Utility AWS Tools > CloudWatch Integration.
Enter the root credentials.
The following screen appears.
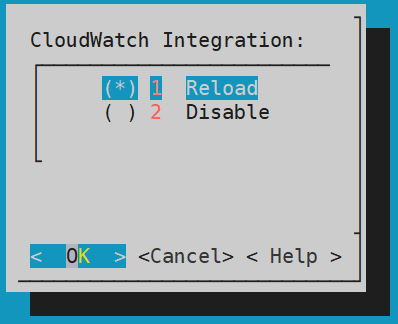
Select Reload and press ENTER.
The logs are updated and sent to the AWS CloudWatch Console.
4.20.1.8.2.5 - Viewing Logs on AWS CloudWatch Console
After performing the required changes on the CLI Manager, the logs are visible on the CloudWatch Console.
To view the logs on the CloudWatch console:
Login to the AWS Web UI.
From the Services tab, navigate to Management & Governance > CloudWatch.
To view the logs, from the left pane navigate to Logs > Log groups.
Select the required log group. The name of the log group is the same as the hostname of the appliance.
To view the logs, select the required log stream from the following screen.
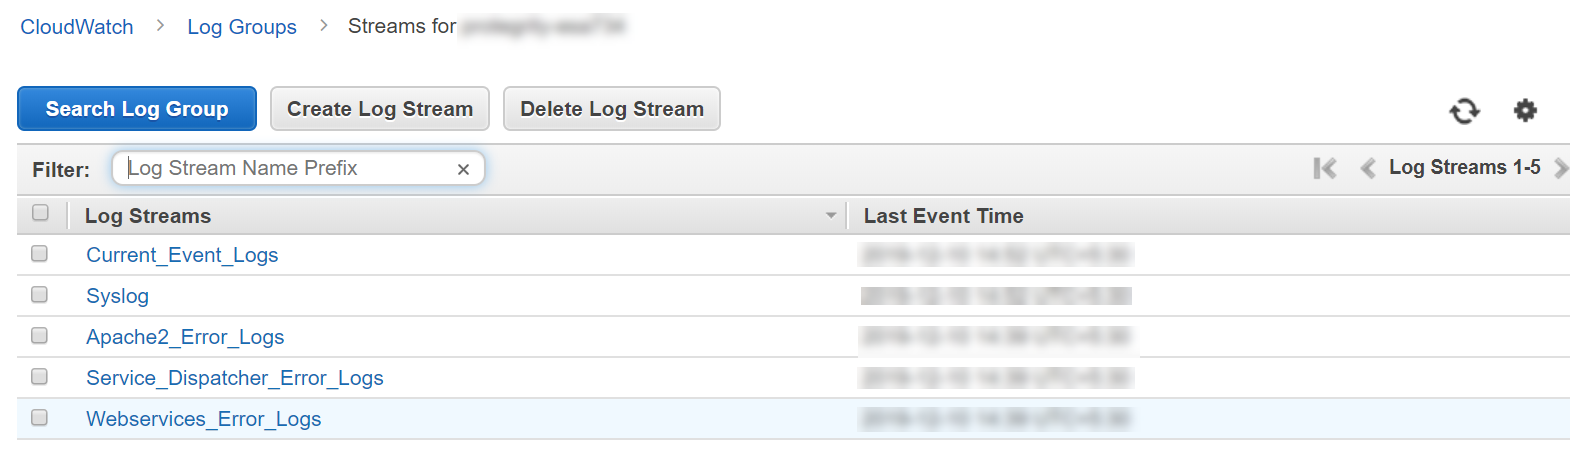
4.20.1.8.2.6 - Working with AWS CloudWatch Metrics
The metrics for the following entities in the appliances are sent to the AWS CloudWatch Console.
| Metrics | Description |
|---|---|
| Memory Use Percent | Percentage of the memory that is consumed by the appliance. |
| Disk I/O | Bytes and packets read and written by the appliance.You can view the following parameters:- write_bytes- read_bytes- writes- reads |
| Network | Bytes and packets sent and received by the appliance.You can view the following parameters:- bytes_sent- bytes_received- packets_sent- packets_received |
| Disk Used Percent | Percentage of the disk space that is consumed by the appliance. |
| CPU Idle | Percentage of time for which the CPU is idle. |
| Swap Memory Use Percent | Percentage of the swap memory that is consumed by the appliance. |
Unlike logs, you cannot customize the metrics that you want to send to CloudWatch. If you want to customize these metrics, then contact Protegrity Support.
4.20.1.8.2.7 - Viewing Metrics on AWS CloudWatch Console
To view the metrics on the CloudWatch console:
Login to the AWS Web UI.
From the Services tab, navigate to Management & Governance > CloudWatch.
To view the metrics, from the left pane navigate to Metrics > All metrics.
Navigate to AWS namespace.
The following screen appears.
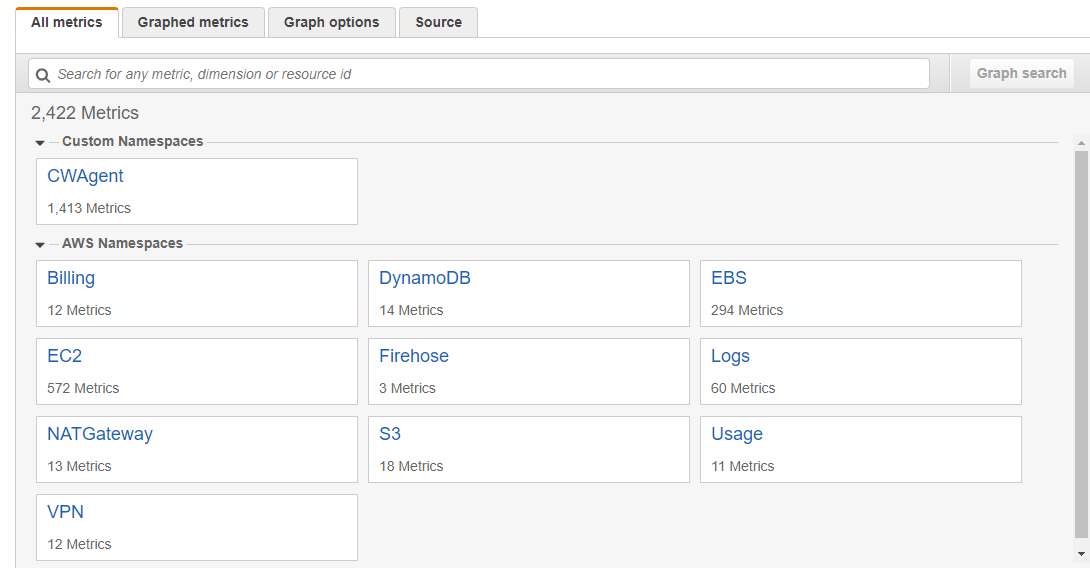
Select EC2.
Select the required metrics from the following screen.
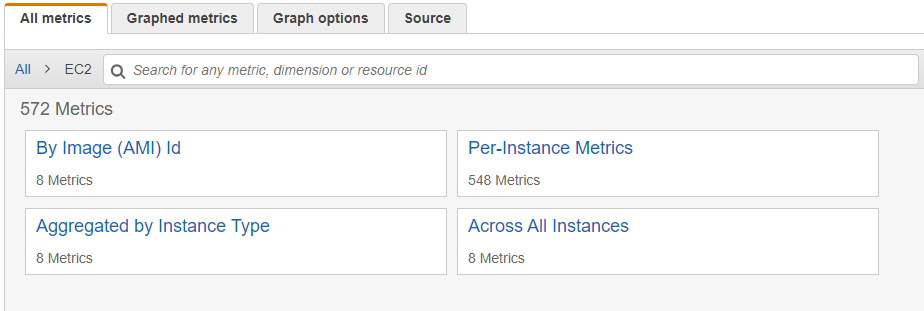
To view metrics of the Protegrity appliances that are on-premise or other cloud platforms, such as Azure or GCP, navigate to Custom namespace > CWAgent.
The configured metrics appear.
4.20.1.8.2.8 - Disabling AWS CloudWatch Integration
If you want stop the logs and metrics that are being sent to the AWS CloudWatch Console. To disintegrate the Cloudwatch removing the service from the appliance. Then, disable the AWS CloudWatch integration from the appliance. As a result, the CloudWatch service is removed from the Services screen of the Web UI and the CLI Manager.
To disable the AWS CloudWatch integration:
Login to the ESA CLI Manager.
To disable CloudWatch, navigate to Tools > Cloud Utility AWS Tools > CloudWatch Integration.
The following screen appears.
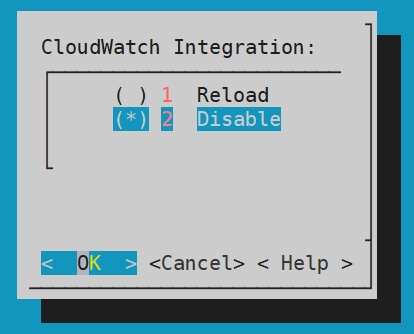
Select Disable and press ENTER.
The logs from the appliances are not updated in the AWS CloudWatch Console and the CloudWatch Integration is disabled.
A warning screen with message Are you sure you want to disable CLoudWatch integration? appears. Select Yes and press Enter.
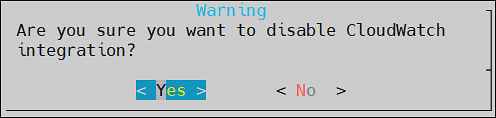
The CloudWatch integration disabled successfully message appears. Click Ok.
The AWS CloudWatch integration is disabled.
After disabling CloudWatch integration, you must delete the Log groups and Log streams from the AWS CloudWatch console.
4.20.1.8.3 - Working with the AWS Cloud Utility
You can work with the AWS Cloud Utility in various ways. This section contains usage examples for using the AWS Cloud Utility. However, the scope of working with Cloud Utility is not limited to the scenarios covered in this section.
The following scenarios are explained in this section:
- Encrypting and storing the backed up files on the AWS S3 bucket.
- Setting metrics-based alarms using the AWS Management Console.
4.20.1.8.3.1 - Storing Backup Files on the AWS S3 Bucket
If you want to store backed up files on the AWS S3 bucket, you can use the Cloud Utility feature. You can transit these files from the Protegrity appliance to the AWS S3 bucket.
The following tasks are explained in this section:
- Encrypting the backed up .tgz files using the AWS Key Management Services (KMS).
- Storing the encrypted files in the AWS S3 bucket.
- Retrieving the encrypted files stored in the S3 bucket.
- Decrypting the retrieved files using the AWS KMS.
- Importing the decrypted files on the Protegrity appliance.
About the AWS S3 bucket and usage
The AWS S3 bucket is a cloud resource which helps you to securely store your data. It enables you to keep the data backup at multiple locations, such as, on-premise and on cloud. For easy accessibility, you can backup and store data of one machine and import the same data to another machine, using the AWS S3 bucket. It also provides an additional layer of security by helping you encrypt the data before uploading it to the cloud.
Using the OS Console option in the CLI Manager, you can store your backed up files in the AWS S3 bucket. You can encrypt your files using the the AWS Key Management Services (KMS) before storing it in the AWS S3 bucket.
The following figure shows the flow for storing your data on the AWS S3 bucket.


Prerequisites
Ensure that you complete the following prerequisites for uploading the backed up files to the S3 bucket:
The Configured AWS user or the attached IAM role must have access to the S3 bucket.
For more information about configuring access to the AWS resources, refer to Configuring access for AWS resources.
The Configured AWS user or the attached IAM role must have AWSKeyManagementServicePowerUser permission to use the KMS.
For more information about configuring AWS resources, refer to Configuring access for AWS resources.
For more information about KMS, refer to the following link.
https://docs.aws.amazon.com/kms/latest/developerguide/iam-policies.html
The backed up .tgz file should be present in the /products/exports folder.
For more information about exporting the files, refer to Export Data Configuration to Local File.
You must have the KMS keys present in the AWS Key Management Service.
For more information about KMS keys, refer to the following link:
https://docs.aws.amazon.com/kms/latest/developerguide/getting-started.html.
Encrypting and Storing Files
To encrypt and upload the exported file from /products/exports to the S3 bucket:
Login to the Appliance CLI manager.
To encrypt and upload files, navigate to Administration > OS Console.
Enter the root credentials.
Change the directory to /products/exports using the following command.
cd /products/exportsEncrypt the required file using the aws-encryption-cli command.
aws-encryption-cli --encrypt --input <file_to_encrypt> --master-keys key=<Key_ID> region=<region-name> --output <encrypted_output_filename> --metadata-output <metadata_filename> --encryption-context purpose=<purpose_for_performing encryption>Parameter Description file_to_encrypt The backed up file that needs to be encrypted before uploading to the S3 bucket. Key_ID The key ID of the KMS key that needs to be used for encrypting the file. region-name The region where the KMS key is stored. encrypted_output_filename The name of the file after encryption. metadata_filename The name of the file where the metadata needs to be stored. purpose_for_performing encryption The purpose of encrypting the file. For more information about encrypting data using the KMS, refer to the following link.
https://docs.aws.amazon.com/cli/latest/reference/kms/encrypt.html
The file is encrypted.
Upload the encrypted file to the S3 bucket using the following command.
aws s3 cp <encrypted_output_filename> <s3Uri>The file is uploaded in the S3 bucket.
For example, if you have an encrypted file test.enc and you want to upload it to your personal bucket, mybucket, in s3 bucket, then use the following command:
aws s3 cp test.enc s3://mybucket/test.encFor more information about the S3 bucket, refer to the following link:
Decrypting and Importing Files
To decrypt and import the files from the S3 bucket:
Login to the Appliance CLI manager.
To decrypt and import the file, navigate to Administration > OS Console.
Enter the root credentials.
Change the directory to /products/exports using the following command:
cd /products/exportsDownload the encrypted file using the following command:
aws s3 cp <s3Uri> <local_file_name(path)>For example, if you want to download the file test.txt to your local machine as test2.txt, then use the following command:
aws s3 cp s3://mybucket/test.txt test2.txtDecrypt the downloaded file using the following command:
aws-encryption-cli --decrypt --input <file_to_decrypt> --output <decrypted_file_name>
 --metadata-output <metadata_filename>
Parameter Description file_to_decrypt The backed up file that needs to be decrypted after downloading from the S3 bucket. decrypted_output_filename The name with which the file is saved after decryption. metadata_filename The name of the file where the metadata needs to be stored. Ensure that the metadata_filename must be the same filename which is used during encryption of the file.
The file is decrypted.
For more information about decrypting the downloaded file, refer to the following link.
Import the decrypted file to the local machine.
For more information about importing the decrypted file, refer to Import Data/Configurations from a File.
4.20.1.8.3.2 - Set Metrics Based Alarms Using the AWS Management Console
If you want to set alarms and alerts for your machine, using Protegrity appliances, you can send logs and metrics to the AWS Console. The AWS Management Console enables you to set alerts and configure SNS events as per your requirements.
You can create alerts based on the following metrics:
- Memory Use Percent
- Disk I/O
- Network
- Disk Used Percent
- CPU Idle
- Swap Memory Use Percent
Prerequisite
Ensure that the CloudWatch integration is enabled.
For more information about enabling the CloudWatch integration, refer to Enabling AWS CloudWatch Integration.
Creating an SNS Event
The following steps explain how to create an SNS event for an email-based notification.
To create an SNS event:
Login to the Amazon Management Console.
To create an SNS event, navigate to Services > Application Integration > Simple Notification Services > Topics.
Select Create topic.
The following screen appears.
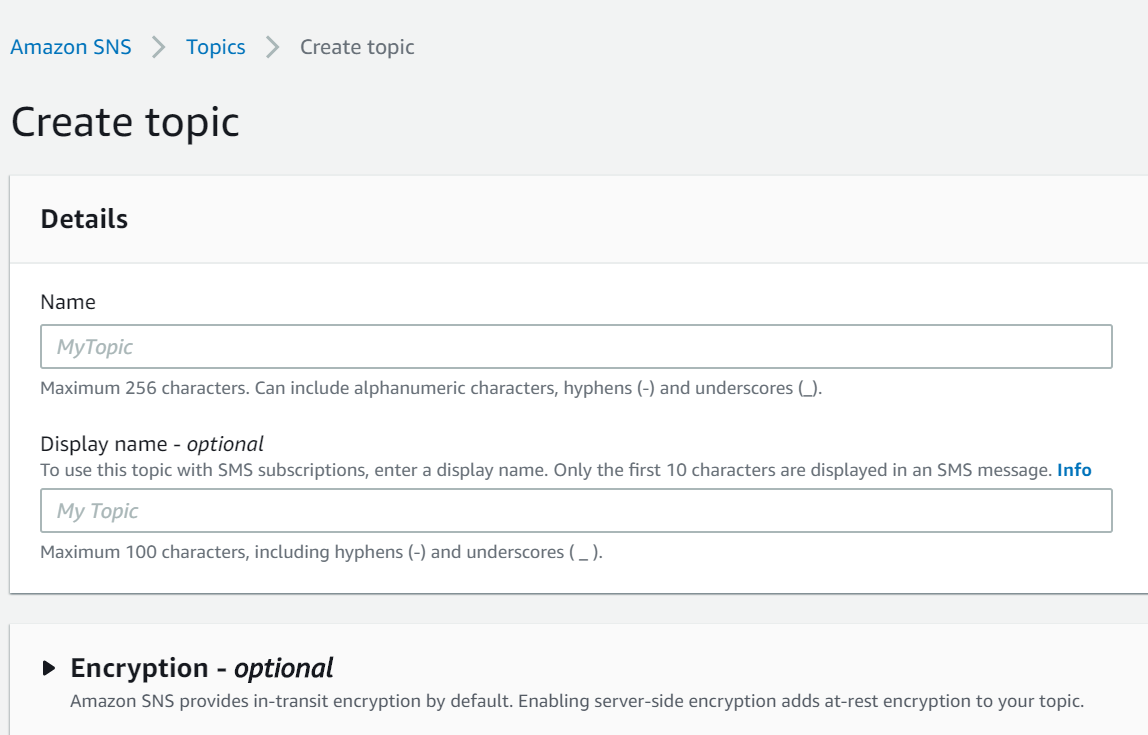
Enter the required Details.
Click Create topic.
The following screen appears.
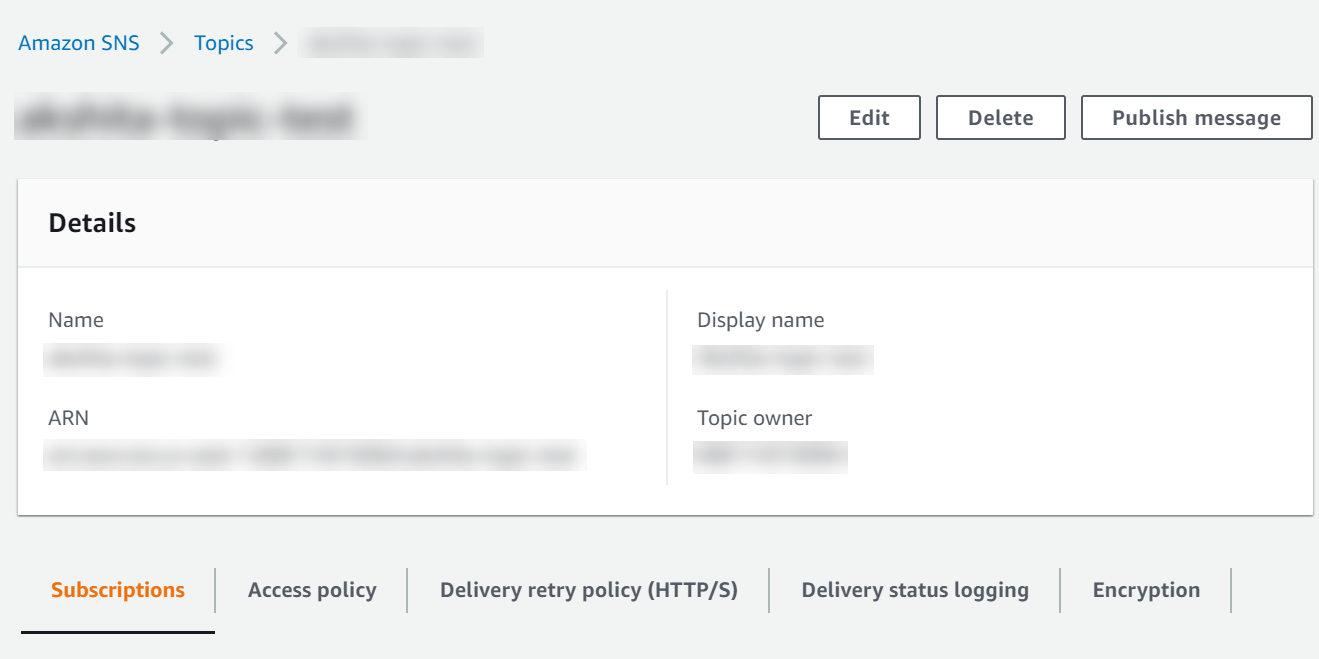
Ensure that you remember the Amazon Resource Name (ARN) associated to your topic.
For more information about the ARN, refer to the following link.
https://docs.aws.amazon.com/general/latest/gr/aws-arns-and-namespaces.html
The topic is created.
From the left pane, click Subscriptions.
Click Create subscription.
Enter the Topic ARN of the topic created in the above step.
From the Protocol field, select Email.
In the Endpoint, enter the required email address where you want to receive the alerts.
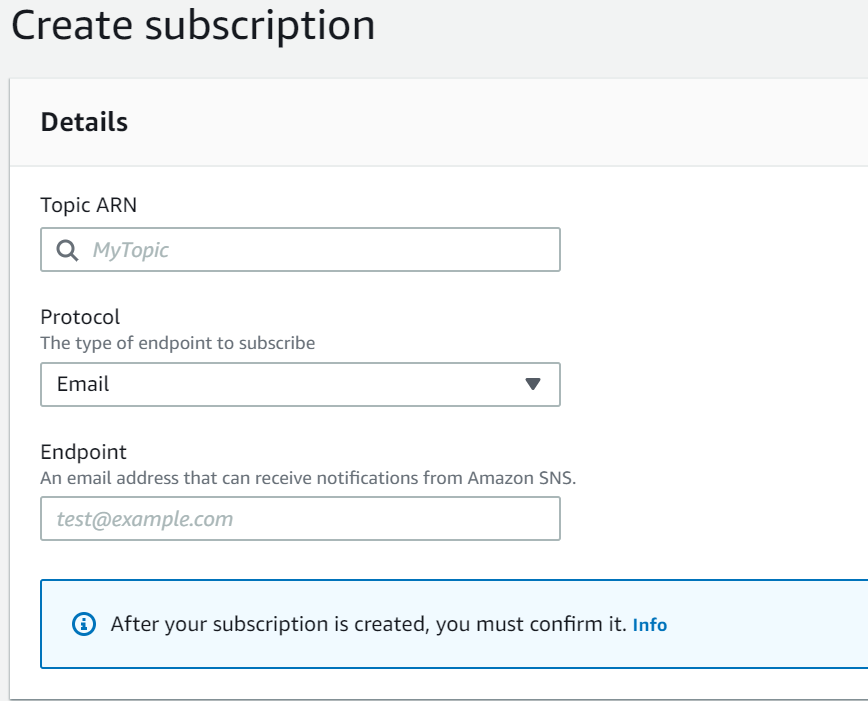
Enter the optional details.
Click Create subscription.
An SNS event is created and a confirmation email is sent to the subscribed email address.
To confirm the email subscription, click the Confirm Subscription link from the email received on the registered email address.
Creating Alarms
The following steps explain the procedure to set an alarm for CPU usage.
To create an alarm:
Login to the Amazon Management Console.
To create an alarm, navigate to Services > Management & Governance > CloudWatch.
From the left pane, select Alarms > In alarm.
Select Create alarm.
Click Select metric.
The Select metric window appears.
From the Custom Namespaces, select CWAgent.
Select cpu, host.
Select the required metric and click Select metric.
Configure the required metrics.
Configure the required conditions.
Click Next.
The Notification screen appears.
Select the alarm state.
From Select SNS topic, choose Select an existing SNS topic.
Enter the required email type in Send a notification to… dialog box.
Select Next.
Enter the Name and Description.
Select Next.
Preview the configuration details and click Create alarm.
An alarm is created.
4.20.1.8.4 - FAQs for AWS Cloud Utility
This section lists the FAQs for the AWS Cloud Utility.
Where can I install the AWS Cloud/CloudWatch/Cloud Utilities?
AWS Cloud Utility can be installed on any appliance-based product. It is compatible with the ESA and the DSG that are installed on-premise or on cloud platforms, such as, AWS, Azure, or GCP.
If an instance is created on the AWS using the cloud image, then Cloud Utility AWS is preinstalled on this instance.
Which version of AWS CLI is supported by the AWS Cloud Utility product v2.3.0?
AWS CLI 2.15.41 is supported by the Cloud Utility AWS product v2.3.0.
What is the Default Region Name while configuring AWS services?
The Default Region Name on whose servers you want to send the default service requests.
For more information about Default Region Name, refer to the following link: https://docs.aws.amazon.com/cli/latest/userguide/cli-chap-configure.html
Can I configure multiple accounts for AWS on a single appliance?
No, you cannot configure multiple accounts for AWS on a single appliance.
How to determine the Log group name?
The Log group name is same as the hostname of the appliance.
Can I change the Log group name?
No, you cannot change the Log group name.
Can I change the appliance hostname after enabling CloudWatch integration?
If you change the appliance hostname after enabling CloudWatch integration, then:
- A new Log Group is created with the updated hostname.
- Only the new logs will be present in the updated Log Group.
- The new Log Group consists of only the updated logs files.
- It is recommended to manually delete the previous Log Group from the AWS CloudWatch Console.
Are there any configuration files for AWS CloudWatch?
Yes, there are configuration files for CloudWatch. The configuration files are present in /opt/aws/pty/cloudwatch/config.d/ directory.
The config.json file for cloud watch is present in /opt/aws/pty/cloudwatch/config.json file.
It is recommended not to edit the default configuration files.
What happens if I enable CloudWatch integration with a corrupt file?
The invalid configuration file is listed in a dialog box.
The logs corresponding to all other valid configurations will be sent to the AWS CloudWatch Console.
What happens if I edit the only default configuration files, such as, /opt/aws/pty/cloudwatch/config.d/, with invalid data for CloudWatch integration?
In this case, only metrics will be sent to the AWS CloudWatch Console.
How can I export or import the CloudWatch configuration files?
You can export or import the CloudWatch configuration files either through the CLI Manager or through the Web UI.
For more information about exporting or importing the configuration files through the CLI manager, refer to Exporting Data Configuration to Local File.
For more information about exporting or importing the configuration files through the Web UI, refer to Backing Up Data.
What are the compatible Output Formats while configuring the AWS?
The following Default Output Formats are compatible:
- json
- table
- text
If I use an IAM role, what is the Default Output Formats?
The Default Output Format is json.
If I disable the CloudWatch integration, why do I need to delete Log Groups and Log Streams manually?
You should delete Log Groups and Log Streams manually because this relates to the billing cost.
Protegrity will only disable sending logs and metrics to the CloudWatch Console.
How can I check the status of the CloudWatch agent service?
You can view the status of the of the CloudWatch service using one of the following.
On the Web UI, navigate to System > Services.
On the CLI Manager, navigate to Administration > Services.
On the CLI Manager, navigate to Administration > OS Console and run the following command:
/etc/init.d/cloudwatch_service status
Can I customize the metrics that i want to send to the CloudWatch console?
No, you cannot customize the metrics to send to the CloudWatch console. If you want to customize the metrics, then contact Protegrity Support.
How often are the metrics collected from the appliances?
The metrics are collected at 60 seconds intervals from the appliance.
How much does Amazon CloudWatch cost?
For information about the billing and pricing details, refer to https://aws.amazon.com/cloudwatch/pricing/.|
Can I provide the file path as <foldername/>* to send logs to the folder?
No, you can not provide the file path as <foldername/>*.
Regex is not allowed in the CloudWatch configuration file. You must specify the absolute file path.
Can I configure AWS from OS Console?
No, you can not. If you configure AWS from the OS Console it will change the expected behaviour of the AWS Cloud Utility.
What happens to the custom configurations if I uninstall or remove the AWS Cloud Utility product?
The custom configurations are retained.
What happens to CloudWatch if I delete AWS credentials from ESA after enabling CloudWatch integration?
You can not change the status of the CloudWatch service. You must reconfigure the ESA with valid AWS credentials to perform the CloudWatch-related operations.
Why some of the log files are world readable?
The files with the .log extension present in the /opt/aws/pty/cloudwatch/logs/state folder are not log files. These files are used by the CloudWatch utility to monitor the logs.
Why is the CloudWatch service stopped when the patch is installed? How do I restart the service?
As the CloudWatch service is stopped when the patch is installed, it remains in the stopped state after the Cloud Utility Patch (CUP) installation. So, we must restart the CloudWatch service manually.To restart the CloudWatch service manually, perform the following steps.
- Login to the OS Console.
- Restart the CloudWatch service using the following command.
/etc/init.d/cloudwatch_service restart
4.20.1.8.5 - Working with AWS Systems Manager
The AWS Systems Manager allows you to manage and operate the infrastructure on AWS. Using the Systems Manager console, you can view operational data from multiple AWS services and automate operational tasks across the AWS services.
For more information about AWS Systems Manager, refer to the following link:
https://docs.aws.amazon.com/systems-manager/latest/userguide/what-is-systems-manager.html
Prerequisites
Before using the AWS Systems Manager, ensure that the IAM role or IAM user to integrate with the appliance has a policy assigned to it. You can attach one or more IAM policies that define the required permissions for a particular IAM role.
For more information about the IAM role, refer to section Configuring Access for AWS Instances.
For more information about creating an IAM instance profile for Systems Manager, refer to the following link:
https://docs.aws.amazon.com/systems-manager/latest/userguide/setup-instance-profile.html
4.20.1.8.5.1 - Setting up AWS Systems Manager
You must set up AWS Systems Manager to use the Systems Manager Agent (SSM Agent).
You can set up Systems Manager for:
- An AWS instance
- A non-AWS instance or an on-premise platform
After the SSM Agent is installed in an instance, ensure that the auto-update option is disabled, as we do not support auto-update. If the SSM Agent gets auto updated, the service will get corrupted.
For more information about automatic updates for SSM Agent, refer to the following link:
Setting up Systems Manager for AWS Instance
To set up Systems Manager for an AWS instance:
Assign the IAM Role created in the section Prerequisites.
For more information about attaching an IAM role to an instance, refer to the following link:
https://docs.aws.amazon.com/AWSEC2/latest/UserGuide/iam-roles-for-amazon-ec2.html#attach-iam-role
Start the Amazon SSM-Agent from the Services menu or run the following command to start the SSM-Agent.
/etc/init.d/amazon-ssm-agent start
Setting up Systems Manager for non-AWS Instance
To set up Systems Manager for non-AWS instance:
Create a hybrid activation for the Linux instances.
For more information about creating a managed instance activation for a hybrid environment, refer to the following link:
https://docs.aws.amazon.com/systems-manager/latest/userguide/sysman-managed-instance-activation.html
Important: After you successfully complete the activation, an Activation Code and Activation ID appears. Copy this information and save it. If you lose this information, then you must create a new activation.
Login to the CLI as an admin user and open the OS Console.
Using the Activation Code and Activation ID obtained in Step 1, run the following command to activate and register the SSM-Agent.
amazon-ssm-agent -register -code <activation-code> -id <activation-id> -region <region>Here
<region>is the identifier of the instance region.Note the instance-id. This will be used to perform operations from SSM-Agent.
For more information on how to register a managed instance, refer to the following link:
Start the Amazon SSM-Agent from the Services menu or run the following command to start the SSM-Agent.
/etc/init.d/amazon-ssm-agent start
4.20.1.8.5.2 - FAQs on AWS Systems Manager
This section lists the FAQs on AWS Systems Manager.
What can I do when there is a problem with starting the service or the service is automatically updated?
Uninstall and reinstall the Cloud Utility AWS product.
For more information on installing and uninstalling the services, refer Add/Remove Services.
What is the name of the service?
The service name is Amazon SSM-Agent.
What can I do if the AWS Systems Manager shows a permission denied message after attaching the correct IAM Role?
Restart the service after attaching the IAM role for new permissions to take effect.
Is the Amazon SSM-Agent service available in the Services menu in the Web UI and the CLI?
Yes.
Can I manage the Amazon SSM-Agent service from the Menu option in the Web UI?
Yes, you can start or stop and restart the Amazon SSM Agent service from the Menu option in the Web UI.
4.20.1.8.6 - Troubleshooting for the AWS Cloud Utility
This section lists the troubleshooting for the AWS Cloud Utility.
While using AWS services the following error appears: UnknownRegionError("No default region found...”)
Issue: The service is unable to retrieve the AWS Region from the system.
Workaround: The service is region specific. Include the region name in the command.
region=<region-name>
The CloudWatch service was running and the service has stopped after restarting the system.
Issue: The CloudWatch Service Mode is set to Manual
Workaround: You should restart the service manually.
If the CloudWatch Service Mode is set to Automatic, then wait until all the services start.
The CloudWatch integration is enabled, but the log group/log stream is not created or logs are not being updated.
Issue: This issue occurs because the associated IAM Role or IAM User does not have required permissions to perform CloudWatchrelated operations.
To verify the error, check the log file by using a text editor.
/var/log/amazon/amazoncloudwatch-agent/amazoncloudwatch-agent.log
You can see one of the following errors:
E! WriteToCloudWatch failure, err: AccessDenied: User: arn:aws:sts:**** is not authorized to perform: cloudwatch:PutMetricDataE! cloudwatchlogs: code: AccessDeniedException, message: User: arn:aws:sts:**** is not authorized to perform: logs:PutLogEventsE! CreateLogStream / CreateLogGroup AccessDeniedException: User: arn:aws:sts:**** is not authorized to perform: logs:CreateLogStream
Workaround: Assign CloudWatchAgentServerPolicy permissions to the associated IAM Role or IAM User and restart the service.
I can see the error message: Unable to locate valid credentials for CloudWatch
Issue: The error message can be because of one of the following reasons:
- If you are using an AWS instance, then the IAM Role is not configured for the AWS instance.
- If you are using a non-AWS instance, then the IAM User is configured with invalid AWS
Workaround: On AWS instance, navigate to the AWS console and attach the IAM role to the instance.
For more information about attaching the IAM role, refer https://aws.amazon.com/blogs/security/easily-replace-or-attach-an-iam-role-to-an-existing-ec2-instance-by-using-the-ec2-console/.
On non-AWS instance, to configure the IAM user with valid credentials, navigate to Tools > CloudWatch Utility AWS Tools > AWS Configure.
I am unable to see AWS Tools section under Tools in the CLI Manager
Issue: The AWS Admin role is not assigned to the instance.
Workaround: For more information about the AWS Admin role, refer Managing Roles.
I can see one of the following error messages: CloudWatch Service started failed or CloudWatch Service stopped failed
Issue: The ESA is configured with invalid AWS credentials.
Workaround: You must reconfigure the ESA with valid AWS credentials.
4.20.2 - Installing ESA on Google Cloud Platform (GCP)
The Google Cloud Platform (GCP) is a cloud computing service offered by Google, which provides services for compute, storage, networking, cloud management, security, and so on. The following products are available on GCP:
- Google Compute Engine provides virtual machines for instances.
- Google App Engine provides a Software Developer Kit (SDK) to develop products.
- Google Cloud Storage is a storage platform to store large data sets.
- Google Container Engine is a cluster-oriented container to develop and manage Docker containers.
Protegrity provides the images for GCP that contain either the Enterprise Security Administrator (ESA), or the Data Security Gateway (DSG).
This section describes the prerequisites and tasks for installing Protegrity ESA appliances on GCP. In addition, it describes some best practices for using the Protegrity ESA appliances on GCP effectively.
4.20.2.1 - Verifying Prerequisites
This section describes the prerequisites including the hardware, software, and network requirements for installing and using ESA on GCP.
Prerequisites
The following prerequisite is essential to install the Protegrity ESA appliances on GCP:
- A GCP account and the following information:
- Login URL for the GCP account
- Authentication credentials for the GCP account
- Access to the My.Protegrity portal
Hardware Requirements
As the Protegrity ESA appliances are hosted and run on GCP, the hardware requirements are dependent on the configurations provided by GCP. The actual hardware configuration depends on the actual usage or amount of data and logs expected. However, these requirements can autoscale as per customer requirements and budget.
The minimum recommendation for an ESA is 8 CPU cores and 32 GB memory. On GCP, this configuration is available under the Machine type drop-down list in the n1-standard-8 option.
For more information about the hardware requirements of ESA, refer to section System Requirements.
Network Requirements
The Protegrity ESA appliances on GCP are provided with a Google Virtual Private Cloud (VPC) networking environment. The Google VPC enables you to access other instances of Protegrity resources in your project.
You can configure the Google VPC by specifying the IP address range. You can also create and configure subnets, network gateways, and the security settings.
For more information about the Google VPC, refer to the VPC documentation at: https://cloud.google.com/vpc/docs/vpc
If you are using the ESA or the DSG appliance with GCP, then ensure that the inbound and outbound ports of the appliances are configured in the VPC.
For more information about the list of inbound and outbound ports, refer to the section Open Listening Ports.
4.20.2.2 - Configuring the Virtual Private Cloud (VPC)
You must configure your Virtual Private Cloud (VPC) to connect to different Protegrity appliances,such as, ESA and DSG.
To configure a VPC:
Ensure that you are logged in to the GCP Console.
Navigate to the Home screen.
Click the navigation menu on the Home screen.
Under Networking, navigate to VPC network > VPC networks.
The VPC networks screen appears.
Click CREATE VPC NETWORK.
The Create a VPC network screen appears.
Enter the name and description of the VPC network in the Name and Description text boxes.
Under the Subnets area, click Custom to add a subnet.
Enter the name of the subnet in the Name text box.
Click Add a Description to enter a description for the subnet.
Select the region where the subnet is placed from the Region drop-down menu.
Enter the IP address range for the subnet in the IP address range text box.
For example, 10.1.0.0/99.
Select On or Off from the Private Google Access options to set access for VMs on the subnet to access Google services without assigning external IP addresses.
Click Done. Additionally, click Add Subnet to add another subnet.
Select Regional from the Dynamic routing mode option.
Click Create to create the VPC.
The VPC is added to the network.
Adding a Subnet to the Virtual Private Cloud (VPC)
You can add a subnet to your VPC.
To add a subnet:
Ensure that you are logged in to the GCP Console.
Under Networking, navigate to VPC network > VPC networks.
The VPC networks screen appears.
Select the VPC.
The VPC network details screen appears.
Click EDIT.
Under Subnets area, click Add Subnet.
The Add a subnet screen appears.
Enter the subnet details.
Click ADD.
Click Save.
The subnet is added to the VPC.
4.20.2.3 - Obtaining the GCP Image
Before creating the instance on GCP, you must obtain the image from the My.Protegrity portal. On the portal, you select the required ESA version and choose GCP as the target cloud platform. You then share the product to your cloud account. The following steps describe how to share the image to your cloud account.
To obtain and share the image:
Log in to the My.Protegrity portal with your user account.
Click Product Management > Explore Products > Data Protection.
Select the required ESA Platform Version from the drop-down.
The Product Family table will update based on the selected ESA Platform Version.
The ESA Platform Versions listed in drop-down menu reflect all versions. These include versions that were either previously downloaded or shipped within the organization along with any newer versions available thereafter. Navigate to Product Management > My Product Inventory to check the list of products previously downloaded.
The images in this section consider the ESA as a reference. Ensure that you select the required image.
Select the Product Family.
The description box will populate with the Product Family details.
Click View Products to advance to the product listing screen.
Callout Element Name Description 1 Target Platform Details Shows details about the target platform. 2 Product Name Shows the product name. 3 Product Family Shows the product family name. 4 OS Details Shows the operating system name. 5 Version Shows the product version. 6 End of Support Date Shows the final date that Protegrity will provide support for the product. 7 Action Click the View icon ( ) to open the Product Detail screen.8 Export as CSV Downloads a .csv file with the results displayed on the screen. 9 Search Criteria Type text in the search field to specify the search filter criteria or filter the entries using the following options:- OS- Target Platform 10 Request one here Opens the Create Certification screen for a certification request. Select the GCP cloud target platform you require and click the View icon (
) from the Action column.The Product Detail screen appears.
Callout Element Name Description 1 Product Detail Shows the following information about the product:- Product name- Family name- Part number- Version- OS details- Hardware details- Target platform details- End of support date
- Description2 Product Build Number Shows the product build number. 3 Release Type Name Shows the type of build, such as, release, hotfix, or patch. 4 Release Date Shows the release date for the build. 5 Build Version Shows the build version. 6 Actions Shows the following options for download:- Click the Share Product icon ( ) to share the product through the cloud.- Click the Download Signature icon () to download the product signature file.- Click the Download Readme icon () to download the Release Notes.7 Download Date Shows the date when the file was downloaded. 8 User Shows the user name who downloaded the build. 9 Active Deployment Select the check box to mark the software as active. Clear the check box to mark the software as inactive. This option is available only after you download a product.| |10|Product Build Number|Shows the product build number.|
Click the Share Product icon (
) to share the desired cloud product.If the access to the cloud products is restricted and the Customer Cloud Account details are not available, then a message appears. The message displays the information that is required and the contact information for obtaining access to cloud share.
A dialog box appears and your available cloud accounts will be displayed.
Select your required cloud account in which to share the Protegrity product.
Click Share.
A message box is displayed with the command line interface (CLI) instructions with the option to download a detailed PDF containing the cloud web interface instructions. Additionally, the instructions for sharing the cloud product are sent to your registered email address and to your notification inbox in My.Protegrity.
Click the Copy icon (
) to copy the command for sharing the cloud product and run the command in CLI. Alternatively, click Instructions to download the detailed PDF instructions for cloud sharing using the CLI or the web interface.
The cloud sharing instruction file is saved in a
.pdfformat. You need a reader, such as, Acrobat Reader to view the file.The Cloud Product will be shared with your cloud account for seven (7) days from the original share date in the My.Protegrity portal.
After the seven (7) day time period, you need to request a new share of the cloud product through My.Protegrity.com.
4.20.2.4 - Converting the Raw Disk to a GCP Image
After obtaining the image from Protegrity, you can proceed to create a virtual image. However, the image provided is available as disk in a raw format. This must be converted to a GCP specific image before you create an instance. The following steps provide the details of converting the image in a raw format to a GCP-specific image.
To convert the image:
Login to the GCP Console.
Run the following command.
gcloud compute images create <Name for the new GCP Image > --source-uri gs://<Name of the storage location where the raw image is obtained>/<Name of the GCP image>>For example,
gcloud compute images create esa80 --source-uri gs://stglocation80/esa-pap-all-64-x86-64-gcp-8-0-0-0-1924.tar.gzThe raw image is converted to a GCP-specific image. You can now create an instance using this image
4.20.2.5 - Loading the Protegrity ESA Appliance from a GCP Image
This section describes the tasks that you must perform to load the Protegrity ESA appliance from an image that is provided by Protegrity. You must create a VM instance using the image provided in the following two methods:
- Creating a VM instance from the Protegrity ESA appliance image provided.
- Creating a VM instance from a disk that is created with an image of the Protegrity ESA appliance.
4.20.2.5.1 - Creating a VM Instance from an Image
This section describes how to create a Virtual Machine (VM) from an ESA image provided to you.
To create a VM from an image:
Ensure that you are logged in to the GCP.
Click Compute Engine.The Compute Engine screen appears.
Click CREATE INSTANCE.The Create an instance screen appears.
Enter the following information:
- Name: Name of the instance
- Description: Description for the instance
Select the region and zone from the Region and Zone drop-down menus respectively.
Under the Machine Type area, select the processor and memory configurations based on the requirements.
Click Customize to customize the memory, processor, and core configuration.
Under the Boot disk area, click Change to configure the boot disk.
The Boot disk screen appears.
Click Custom Images.
Under the Show images from drop-down menu, select the project where the image of the ESA is provided.
Select the image for the root partition.
Select the required disk type from the Boot disk type drop-down list.
Enter the size of the disk in the Size (GB) text box.
Click Select.
The disk is configured.
Under the Identity and API access area, select the account from the Service Account drop-down menu to access the Cloud APIs.
Depending on the selection, select the access scope from the Access Scope option.
Under the Firewall area, select the Allow HTTP traffic or Allow HTTPS traffic checkboxes to permit HTTP or HTTPS requests.
Click Networking to set the networking options.
Enter data in the Network tags text box.
Click Add network interface to add a network interface.
If you want to edit a network interface, then click the edit icon (
 ).
).
Click Create to create and start the instance.
4.20.2.5.2 - Creating a VM Instance from a Disk
You can create disks using the image provided for your account. You must create a boot disk using the OS image. After creating the disk, you can attach it to an instance.
This section describes how to create a disk using an image. Using this disk, you then create a VM instance.
Creating a Disk from the GCP Image
Perform the following steps to create a disk using an image.
Before you begin
Ensure that you have access to the Protegrity ESA appliance images.
How to create a disk using a GCP Image
To create a disk of the Protegrity ESA appliance:
Access the GCP domain at the following URL: https://cloud.google.com/
The GCP home screen appears.
Click Console.
The GCP login screen appears.
On the GCP login screen, enter the following details:
- User Name
- Password
Click Sign in.
After successful authentication, the GCP management console screen appears.
Click Go to the Compute Engine dashboard under the Compute Engine area.
The Dashboard screen appears
Click Disks on the left pane.
The Disks screen appears.
Click CREATE DISK to create a new disk.
The Create a disk screen appears.
Enter the following details:
- Name: Name of the disk
- Description: Description for the disk
Select one of the following options from the Type drop-down menu:
- Standard persistent disk
- SSD persistent disk
Select the region and zone from the Region and Zone drop-down menus respectively.
Select one of the following options from the Source Type option:
Image: The image of the Protegrity ESA appliance that is provided.
Select the image from the Source Image drop-down menu.
Snapshot: The snapshot of a disk.
Blank: Create a blank disk.
Enter the size of the disk in the Size (GB) text box.
Select Google-managed key from the Encryption option.
Click Create.
The disk is created.
Creating a VM Instance from a Disk
This section describes how to create a VM instance from a disk that is created from an image.
For more information about creating a disk, refer to section Creating a Disk from the GCP Image.
To create a VM instance from a disk:
Ensure that you are logged in to the GCP Console.
Click Compute Engine.
The Compute Engine screen appears.
Click CREATE INSTANCE.
The Create an instance screen appears.
Enter information in the following text boxes:
- Name
- Description
Select the region and zone from the Region and Zone drop-down menus respectively.
Under the Machine Type section, select the processor and memory configuration based on the requirements.
Click Customize to customize your memory, processor and core configuration.
Under Boot disk area, click Change to configure the boot disk.
The Boot disk screen appears.
- Click Existing Disks.
- Select the required disk created with the Protegrity ESA appliance image.
- Click Select.
Under Firewall area, select the Allow HTTP traffic or Allow HTTPS traffic checkboxes to permit HTTP or HTTPS requests.
Click Create to create and start the instance.
4.20.2.5.3 - Accessing the Appliance
After setting up the virtual machine, you can access the ESA through the IP address that is assigned to the virtual machine. It is recommended to access the ESA with the administrative credentials.
If the number of unsuccessful password attempts exceed the defined value in the password policy, the account gets locked.
For more information on the password policy for the admin and viewer users, refer here, and for the root and local_admin OS users, refer here.
4.20.2.6 - Finalizing the ESA Installation on the Instance
When you install the ESA, it generates multiple security identifiers such as, keys, certificates, secrets, passwords, and so on. These identifiers ensure that sensitive data is unique between two appliances in a network. When you receive a Protegrity ESA appliance image, the identifiers are generated with certain values. If you use the security identifiers without changing their values, then security is compromised and the system might be vulnerable to attacks.
Rotating Appliance OS keys to finalize installation
Using the Rotate Appliance OS Keys, you can randomize the values of these security identifiers for an ESA. During the finalization process, you run the key rotation tool to secure your ESA.
If you do not complete the finalization process, then some features of the ESA may not be functional including the Web UI.
For example, if the OS keys are not rotated, then you might not be able to add appliances to a Trusted Appliances Cluster (TAC).
For information about the default passwords, refer the Release Notes 10.2.0.
Finalizing ESA Installation
You can finalize the installation of the ESA after signing in to the CLI Manager.
Before you begin
Ensure that the finalization process is initiated from a single session only. If you start finalization simultaneously from a different session, then the Finalization is already in progress. message appears. You must wait until the finalization of the instance is successfully completed.
Additionally, ensure that the ESA session is not interrupted. If the session is interrupted, then the instance becomes unstable and the finalization process is not completed on that instance.
To finalize ESA installation:
Sign in to the ESA CLI Manager of the instance created using the default administrator credentials.
The following screen appears.
Select Yes to initiate the finalization process.
The screen to enter the administrative credentials appears.
If you select No, then the finalization process is not initiated.
To manually initiate the finalization process, navigate to Tools > Finalize Installation and press ENTER.
Enter the credentials for the admin user and select OK.
A confirmation screen to rotate the appliance OS keys appears.
Select OK to rotate the appliance OS keys.
The following screen appears.
To update the user passwords, provide the credentials for the following users:
- root
- admin
- viewer
- local_admin
Select Apply.
The user passwords are updated and the appliance OS keys are rotated.
The finalization process is completed.
4.20.2.7 - Deploying the Instance of the Protegrity Appliance with the Protectors
You can configure the various protectors that are a part of the Protegrity Data Security Platform with the instance of the ESA appliance running on AWS.
Depending on the Cloud-based environment which hosts the protectors, the protectors can be configured with the instance of the ESA appliance in one of the following ways:
- If the protectors are running on the same VPC as the instance of the ESA appliance, then the protectors need to be configured using the internal IP address of the ESA appliance within the VPC.
- If the protectors are running on a different VPC than that of the instance of the ESA appliance, then the VPC of the instance of the ESA needs to be configured to connect to the VPC of the protectors.
4.20.2.8 - Backing up and Restoring Data on GCP
You can use a snapshot of an instance or a disk to backup or restore information in case of failures. A snapshot represents a state of an instance or disk at a point in time.
Creating a Snapshot of a Disk on GCP
This section describes the steps to create a snapshot of a disk.
To create a snapshot on GCP:
On the Compute Engine dashboard, click Snapshots.
The Snapshots screen appears.
Click Create Snapshot.
The Create a snapshot screen appears.
Enter information in the following text boxes.
- Name - Name of the snapshot.
- Description – Description for the snapshot.
Select the required disk for which the snapshot is to be created from the Source Disk drop-down list.
Click Add Label to add a label to the snapshot.
Enter the label in the Key and Value text boxes.
Click Add Label to add additional tags.
Click Create.
Ensure that the status of the snapshot is set to completed.
Ensure that you note the snapshot id.
Restoring from a Snapshot on GCP
This section describes the steps to restore data using a snapshot.
Before you begin
Ensure that a snapshot of the disk was created before beginning this process.
How to restore data using a snapshot
To restore data using a snapshot on GCP:
Navigate to Compute Engine > VM instances.
The VM instances screen appears.
Select the required instance.
The screen with instance details appears.
Stop the instance.
After the instance is stopped, click EDIT.
Under the Boot Disk area, remove the existing disk.
Click Add Item.
Select the Name drop-down list and click Create a disk.
The Create a disk screen appears.
Under Source Type area, select the required snapshot.
Enter the other details, such as, Name, Description, Type, and Size (GB).
Click Create.
The snapshot of the disk is added in the Boot Disk area.
Click Save.
The instance is updated with the new snapshot.
4.20.2.9 - Increasing Disk Space on the Appliance
After creating an instance on GCP, you can add a disk to your appliance.
To add a disk to a VM instance:
Ensure that you are logged in to the GCP Console.
Click Compute Engine.
The Compute Engine screen appears.
Select the instance.
The VM instance details screen appears.
Click EDIT.
Under Additional disks, click Add new disk.
Enter the disk name in the Name field box.
Select the disk permissions from the Mode option.
If you want to delete the disk or keep the disk after the instance is created, select the required option from the Deletion rule option.
Enter the disk size in GB in the Size (GB) field box.
Click Done.
Click Save.
The disk is added to the VM instance.
4.20.3 - Installing Protegrity Appliances on Azure
Azure is a cloud computing service offered by Microsoft, which provides services for compute, storage, and networking. It also provides software, platform, and infrastructure services along with support for different programming languages, tools, and frameworks.
The Azure cloud platform includes the following components:
4.20.3.1 - Verifying Prerequisites
This section describes the prerequisites, including the hardware and network requirements, for installing and using Protegrity ESA appliances on Azure.
Prerequisites
The following prerequisites are essential to install the Protegrity ESA appliances on Azure:
- Sign in URL for the Azure account
- Authentication credentials for the Azure account
- Working knowledge of Azure
- Access to the My.Protegrity portal
Before you begin:
Ensure that you use the following order to create a virtual machine on Azure:
| Order | Description |
|---|---|
| 1 | Create a Resource Group |
| 2 | Create a Storage Account |
| 3 | Create a Container |
| 4 | Obtain the Azure BLOB |
| 5 | Create an image from the BLOB |
| 6 | Create a VM from the image |
Hardware Requirements
As the Protegrity ESA appliances are hosted and run on Azure, the hardware requirements are dependent on the configurations provided by Microsoft. However, these requirements can change based on the customer requirements and budget. The actual hardware configuration depends on the actual usage or amount of data and logs expected.
The minimum recommendation for an ESA appliance is 8 CPU cores and 32 GB memory. This option is available under the Standard_D8s_v3 option on Azure.
For more information about the hardware requirements of ESA, refer here.
Network Requirements
The Protegrity ESA appliances on Azure are provided with an Azure virtual networking environment. The virtual network enables you to access other instances of Protegrity resources in your project.
For more information about configuring Azure virtual network, refer here.
4.20.3.2 - Azure Cloud Utility
The Azure Cloud Utility is an appliance component that is available for supporting features specific to Azure Cloud Platform. For Protegrity ESA appliances, this component must be installed to utilize the services of Azure Accelerated Networking and Azure Linux VM agent. If you are utilizing the Azure Accelerated Networking or Azure Linux VM agent, then it is recommended to not uninstall this component.
When you upgrade or install the ESA from an Azure v10.2.0 blob, the Azure Cloud Utility is installed automatically in the appliance.
4.20.3.3 - Setting up Azure Virtual Network
The Azure virtual network is a service that provides connectivity to the virtual machine and services on Azure. You can configure the Azure virtual network by specifying usable IP addresses. You can also create and configure subnets, network gateways, and security settings.
For more information about setting up Azure virtual network, refer to the Azure virtual network documentation at:
https://docs.microsoft.com/en-us/azure/virtual-network/virtual-networks-overview
If you are using the ESA or the DSG appliance with Azure, ensure that the inbound and outbound ports of the appliances are configured in the virtual network.
For more information about the list of inbound and outbound ports, refer to section Open Listening Ports.
4.20.3.4 - Creating a Resource Group
Resource Groups in Azure are a collection of multiple Azure resources, such as virtual machines, storage accounts, virtual networks, and so on. The resource groups enable managing and maintaining the resources as a single entity.
For more information about creating resource groups, refer to the Azure resource group documentation at:
https://docs.microsoft.com/en-us/azure/azure-resource-manager/resource-group-portal
4.20.3.5 - Creating a Storage Account
Azure storage accounts contain all the Azure storage data objects, such as disks, blobs, files, queues, and tables. The data in the storage accounts are scalable, secure, and highly available.
For more information about creating storage accounts, refer to the Azure storage accounts documentation at:
https://docs.microsoft.com/en-us/azure/storage/common/storage-quickstart-create-account
4.20.3.6 - Creating a Container
The data storage objects in a storage account are stored in a container. Similar to directories in a file system, the container in Azure contain BLOBS. You add a container in Azure to store the ESA BLOB.
For more information about creating a container, refer to the following link:
https://docs.microsoft.com/en-us/azure/storage/blobs/storage-quickstart-blobs-portal
4.20.3.7 - Obtaining the Azure BLOB
In Azure, you can share files across different storage accounts. The ESA that is packaged as a BLOB, is shared across storage accounts on Azure. A BLOB is a data type that is used to store unstructured file formats. Azure supports BLOB storage to store unstructured data, such as audio, text, images, and so on. The BLOB of the ESA is shared by Protegrity to the client’s storage account.
Before creating the instance on Azure, you must obtain the BLOB from the My.Protegrity portal. On the portal, you select the required ESA version and choose Azure as the target cloud platform. You then share the product to your cloud account. The following steps describe how to share the BLOB to your cloud account.
Before creating the instance on AWS, you must obtain the image from the My.Protegrity portal. On the portal, you select the required ESA version and choose AWS as the target cloud platform. You then share the product to your cloud account. The following steps describe how to share the AMI to your cloud account.
To obtain and share the BLOB:
Log in to the My.Protegrity portal with your user account.
Click Product Management > Explore Products > Data Protection.
Select the required ESA Platform Version from the drop-down.
The Product Family table will update based on the selected ESA Platform Version.
The ESA Platform Versions listed in drop-down menu reflect all versions. These include versions that were either previously downloaded or shipped within the organization along with any newer versions available thereafter. Navigate to Product Management > My Product Inventory to check the list of products previously downloaded.
The images in this section consider the ESA as a reference. Ensure that you select the required image.
Select the Product Family.
The description box will populate with the Product Family details.
Click View Products to advance to the product listing screen.
Callout Element Name Description 1 Target Platform Details Shows details about the target platform. 2 Product Name Shows the product name. 3 Product Family Shows the product family name. 4 OS Details Shows the operating system name. 5 Version Shows the product version. 6 End of Support Date Shows the final date that Protegrity will provide support for the product. 7 Action Click the View icon ( ) to open the Product Detail screen.8 Export as CSV Downloads a .csv file with the results displayed on the screen. 9 Search Criteria Type text in the search field to specify the search filter criteria or filter the entries using the following options:- OS- Target Platform 10 Request one here Opens the Create Certification screen for a certification request. Select the Azure cloud target platform you require and click the View icon (
) from the Action column.The Product Detail screen appears.
Callout Element Name Description 1 Product Detail Shows the following information about the product:- Product name- Family name- Part number- Version- OS details- Hardware details- Target platform details- End of support date
- Description2 Product Build Number Shows the product build number. 3 Release Type Name Shows the type of build, such as, release, hotfix, or patch. 4 Release Date Shows the release date for the build. 5 Build Version Shows the build version. 6 Actions Shows the following options for download:- Click the Share Product icon ( ) to share the product through the cloud.- Click the Download Signature icon () to download the product signature file.- Click the Download Readme icon () to download the Release Notes.7 Download Date Shows the date when the file was downloaded. 8 User Shows the user name who downloaded the build. 9 Active Deployment Select the check box to mark the software as active. Clear the check box to mark the software as inactive. This option is available only after you download a product.| |10|Product Build Number|Shows the product build number.|
Click the Share Product icon (
) to share the desired cloud product.If the access to the cloud products is restricted and the Customer Cloud Account details are not available, then a message appears. The message displays the information that is required and the contact information for obtaining access to cloud share.
A dialog box appears and your available cloud accounts will be displayed.
Select your required cloud account in which to share the Protegrity product.
Click Share.
A message box is displayed with the command line interface (CLI) instructions with the option to download a detailed PDF containing the cloud web interface instructions. Additionally, the instructions for sharing the cloud product are sent to your registered email address and to your notification inbox in My.Protegrity.
Click the Copy icon (
) to copy the command for sharing the cloud product and run the command in CLI. Alternatively, click Instructions to download the detailed PDF instructions for cloud sharing using the CLI or the web interface.
The cloud sharing instruction file is saved in a
.pdfformat. You need a reader, such as, Acrobat Reader to view the file.The Cloud Product will be shared with your cloud account for seven (7) days from the original share date in the My.Protegrity portal.
After the seven (7) day time period, you need to request a new share of the cloud product through My.Protegrity.com.
4.20.3.8 - Creating Image from the Azure BLOB
After you obtain the BLOB from Protegrity, you must create an image from the BLOB. The following steps describe the parameters that must be selected to create an image.
To create an image from the BLOB:
Log in to the Azure portal.
Select Images and click Create.
Enter the details in the Resource Group, Name, and Region text boxes.
In the OS disk option, select Linux.
In the VM generation option, select Gen 1.
In the Storage blob drop-down list, select the Protegrity Azure BLOB.
Enter the appropriate information in the required fields and click Review + create.
The image is created from the BLOB.
4.20.3.9 - Creating a VM from the Image
After obtaining the image, you can create a VM from it. For more information about creating a VM from the image, refer to the following link.
To create a VM:
Login in to the Azure homepage.
Click Images.
The list of all the images appear.
Select the required image.
Click Create VM.
Enter details in the required fields.
Select SSH public key in the Authentication type option. Do not select the Password based mechanism as an authentication type. Protegrity recommends not using this type as a security measure.
In the Username text box, enter the name of a user. Be aware, this user will not have SSH access to the ESA appliance. Refer to the following section Created OS user and SSH access to appliance for more details.
This user is added as an OS level user in the ESA appliance. Ensure that the following usernames are not provided in the Username text box:
Select the required SSH public key source.
Enter the required information in the Disks, Networking, Management, and Tags sections.
Click Review + Create.
The VM is created from the image.
After the VM is created, you can access the ESA from the CLI Manager or Web UI.
Created OS user and SSH access to appliance
The OS user that is created in step 7 does not have SSH access to the ESA appliance. If you want to provide SSH access to this user, login to the appliance as another administrative user and toggle SSH access. In addition, update the user to permit Linux shell access (/bin/sh).
4.20.3.10 - Accessing the Appliance
After setting up the virtual machine, you can access the ESA appliance through the IP address that is assigned to the virtual machine. It is recommended to access the ESA with the administrative credentials.
If the number of unsuccessful password attempts exceed the defined value in the password policy, then the account gets locked.
For more information on the password policy for the admin and viewer users, refer here, and for the root and local_admin OS users, refer here.
4.20.3.11 - Finalizing the Installation of Protegrity Appliance on the Instance
When you install the ESA, it generates multiple security identifiers such as, keys, certificates, secrets, passwords, and so on. These identifiers ensure that sensitive data is unique between two appliances in a network. When you receive a Protegrity appliance image, the identifiers are generated with certain values. If you use the security identifiers without changing their values, then security is compromised and the system might be vulnerable to attacks.
Rotating Appliance OS keys to finalize installation
Using Rotate Appliance OS Keys, you can randomize the values of these security identifiers for an ESA appliance. During the finalization process, you run the key rotation tool to secure your ESA appliance.
If you do not complete the finalization process, then some features of the ESA appliance may not be functional including the Web UI.
For example, if the OS keys are not rotated, then you might not be able to add ESA appliances to a Trusted Appliances Cluster (TAC).
For information about the default passwords, refer the Release Notes 10.2.0.
Finalizing ESA Installation
You can finalize the installation of the ESA after signing in to the CLI Manager.
Before you begin
Ensure that the finalization process is initiated from a single session only. If you start finalization simultaneously from a different session, then the Finalization is already in progress. message appears. You must wait until the finalization of the instance is successfully completed.
Additionally, ensure that the ESA appliance session is not interrupted. If the session is interrupted, then the instance becomes unstable and the finalization process is not completed on that instance.
To finalize ESA installation:
Sign in to the ESA CLI Manager of the instance created using the default administrator credentials.
The following screen appears.
Select Yes to initiate the finalization process.
The screen to enter the administrative credentials appears.
If you select No, then the finalization process is not initiated.
To manually initiate the finalization process, navigate to Tools > Finalize Installation and press ENTER.
Enter the credentials for the admin user and select OK.
A confirmation screen to rotate the appliance OS keys appears.
Select OK to rotate the appliance OS keys.
The following screen appears.
To update the user passwords, provide the credentials for the following users:
- root
- admin
- viewer
- local_admin
Select Apply.
The user passwords are updated and the appliance OS keys are rotated.
The finalization process is completed.
4.20.3.12 - Accelerated Networking
Accelerated networking is a feature provided by Microsoft Azure which enables the user to improve the performance of the network. This is achieved by enabling Single-root input/output virtualization (SR-IOV) to a virtual machine.
In a virtual environment, SR-IOV specifies the isolation of PCIe resources to improve manageability and performance. The SR-IOV interface helps to virtualize, access, and share the PCIe resources, such as, the connection ports for graphic cards, hard drives, and so on. This successfully reduces the latency, network jitters and CPU utilization.
As shown in figure below, the virtual switch is an integral part of a network for connecting the hardware and the virtual machine. The virtual switch helps in enforcing the policies on the virtual machine. These policies include access control lists, isolation, network security controls, and so on, and are implemented on the virtual switch. The network traffic routes through the virtual switch and the policies are implemented on the virtual machine. This results in higher latency, network jitters, and higher CPU utilization.

However, in an accelerated network, the policies are applied on the hardware. The network traffic only routes through the network cards directly forwarding it to the virtual machine. The policies are applied on the hardware instead of the virtual switch. This helps the network traffic to bypass the virtual switch and the host while maintaining the policies applied at the host. Reducing the layers of communication between the hardware and the virtual machine helps to improve the network performance.

Following are the benefits of accelerated networking:
- Reduced Latency: Bypassing the virtual switch from the data path increases the number of packets which are processed in the virtual machine.
- Reduced Jitter: Bypassing the virtual switch and host from the network reduces the processing time for the policies. The policies are directly implemented on the virtual machine thereby reducing the network jitters caused by the virtual switch.
- CPU Utilization: Applying the policies to the hardware and implementing them directly on the virtual machine reduces the workload on the CPU to process these policies.
Prerequisites
The following prerequisites are essential to enable or disable the Azure Accelerated Networking feature.
A machine with the Azure CLI should be configured. This must be a separate Windows or Linux machine.
For more information about installing the Azure CLI, refer to the following link.
https://docs.microsoft.com/en-us/cli/azure/install-azure-cli?view=azure-cli-latest
The Protegrity ESA appliance must be in the stop (deallocated) state.
The virtual machine must use the supported instance size.
For more information about the supported series of virtual machines for the accelerated networking feature, refer to the Supported Instance Sizes for Accelerated Networking.
Supported Instance Sizes for Accelerated Networking
There are several series of instance sizes used on the virtual machines that support the accelerated networking feature.
These include the following:
- D/DSv2
- D/DSv3
- E/ESv3
- F/FS
- FSv2
- Ms/Mms
The most generic and compute-optimized instance sizes for the accelerated networking feature is with 2 or more vCPUs. However, on the systems with supported hyperthreading features, the accelerated networking feature must have instance sizes with 4 or more vCPUs.
For more information about the supported instance sizes, refer to the following link.
Creating a Virtual Machine with Accelerated Networking Enabled
If you want to enable accelerated networking while creating the instance, then it is achieved only from the Azure CLI. The Azure portal does not provide the option to create an instance with accelerated networking enabled.
For more information about creating a virtual machine with accelerated networking, refer to the following link.
To create a virtual machine with the accelerated networking feature enabled:
From the machine on which the Azure CLI is installed, login to Azure using the following command.
az loginCreate a virtual machine using the following command.
az vm create --image <name of the Image> --resource-group <name of the resource group> --name <name of the new instance> --size <configuration of the instance> --admin-username <administrator username> --ssh-key-values <SSH key path> --public-ip-address "" --nsg <Azure virtual network> --accelerated-networking trueFor example, the table below lists values to create a virtual machine with the following parameters.
Parameter Value Name of the image ProtegrityESAAzure name-of-resource-group MyResourcegroup size Standard_DS3_v2 admin-username admin nsg TierpointAccessDev ssh-key-value ./testkey.pub The virtual machine is created with the accelerated networking feature enabled.
Enabling Accelerated Networking
Perform the following steps to enable the Azure Accelerated Networking feature on the Protegrity ESA appliance.
To enable accelerated networking:
From the machine on which the Azure CLI is installed, login to Azure using the following command.
az loginStop the Protegrity ESA appliance using the following command.
az vm deallocate --resource-group <ResourceGroupName> --name <InstanceName>Parameter Description ResourceGroupName Name of the resource group where the instance is located. InstanceName Name of the instance that you want to stop. Enable accelerated networking on your virtual machine’s network card using the following command.
az network nic update --name <nic-name> --resource-group <ResourceGroupName> --accelerated-networking trueParameter Description nic-name Name of the network interface card attached to the instance where you want to enable accelerated networking. ResourceGroupName Name of the resource group where the instance is located. Start the ESA.
Disabling Accelerated Networking
Perform the following steps to disable the Azure Accelerated Networking features on the Protegrity ESA appliance.
To disable accelerated networking:
From the machine on which the Azure CLI is installed, login to Azure using the following command.
az loginStop the ESA using the following command.
az vm deallocate --resource-group <ResourceGroupName> --name <InstanceName>Parameter Description ResourceGroupName Name of the resource group where the instance is located. InstanceName Name of the instance that you want to stop. Disable accelerated networking on your virtual machine’s network card using the following command.
az network nic update --name <nic-name> --resource-group <ResourceGroupName> --accelerated-networking falseParameter Description nic-name Name of the network interface card attached to the instance where you want to enable accelerated networking. ResourceGroupName Name of the resource group where the instance is located. Start the ESA.
Troubleshooting and FAQs for Azure Accelerated Networking
This section lists the Troubleshooting and FAQs for the Azure Accelerated Networking feature.
What is the recommended number of virtual machines required in the Azure virtual network?
It is recommended to have at least two or more virtual machines in the Azure virtual network.
Can I stop or deallocate my machine from the Web UI?
Yes. You can stop or deallocate your machine from the Web UI. Navigate to the Azure instance details page and click Stop from the top ribbon.
Can I uninstall the Cloud Utility Azure if the accelerated networking feature is enabled?
It is recommended to disable the accelerated networking feature before uninstalling the Cloud Utility Azure.
How do I verify that the accelerated networking is enabled on my machine?
Perform the following steps:
Login to the CLI manager.
Navigate to Administration > OS Console.
Enter the root credentials.
Verify that the Azure Accelerated Networking feature is enabled by using the following commands.
# lspci | grep “Virtual Function”Confirm the Mellanox VF device is exposed to the VM with the lspci command.
The following is a sample output:
001:00:02.0 Ethernet controller: Mellanox Technologies MT27500/MT27520 Family [ConnectX-3/ConnectX-3 Pro Virtual Function]
# ethtool -S ethMNG | grep vfCheck for activity on the virtual function (VF) with the ethtool -S eth0 | grep vf_ command. If you receive an output similar to the following sample output, accelerated networking is enabled and working. The value of the packets and bytes should not be zero`
vf_rx_packets: 992956

vf_rx_bytes: 2749784180

vf_tx_packets: 2656684

vf_tx_bytes: 1099443970

vf_tx_dropped: 0
How do I verify from the Azure Web portal that the accelerated networking is enabled on my machine?
Perform the following steps:
- From the Azure Web portal, navigate to the virtual machine’s details page.
- From the left pane, navigate to Networking.
- If there are multiple NICs, then select the required NIC.
- Verify that the accelerated networking feature is enabled from the Accelerated Networking field.
Can I use the Cloud Shell on the Azure portal for enabling or disabling the accelerated networking feature?
Yes, you can use the Cloud Shell for enabling or disabling the accelerated networking. For more information about the pricing of the cloud shell, refer to the following link.
https://azure.microsoft.com/en-in/pricing/details/cloud-shell
How can I enable the accelerated networking feature using the Cloud Shell?
Perform the following steps to enable the accelerated networking feature using the Cloud Shell:
From the Microsoft Azure portal, launch the Cloud Shell.
Stop the ESA using the following command.
az vm deallocate --resource-group <ResourceGroupName> --name <InstanceName>Enable accelerated networking on your virtual machine’s network card using the following command.
az network nic update --name <nic-name> --resource-group <ResourceGroupName> --accelerated-networking trueStart the ESA.
How can I disable the accelerated networking feature using the Cloud Shell?
Perform the following steps to disable the accelerated networking feature using the Cloud Shell:
From the Microsoft Azure portal, launch the Cloud Shell.
Stop the ESA using the following command.
az vm deallocate --resource-group <ResourceGroupName> --name <InstanceName>Enable accelerated networking on your virtual machine’s network card using the following command.
az network nic update --name <nic-name> --resource-group <ResourceGroupName> --accelerated-networking falseStart the ESA.
Are there any specific regions where the accelerated networking feature is supported?
The accelerated networking feature is supported in all public Azure regions and Azure government clouds. For more information about the supported regions, refer to the following link:
https://docs.microsoft.com/en-us/azure/virtual-network/create-vm-accelerated-networking-cli#regions
Is it necessary to stop (deallocate) the machine to enable or disable the accelerated networking feature?
Yes. It is necessary to stop (deallocate) the machine to enable or disable the accelerated networking feature.This is because if the machine is not in the stop (deallocate) state, then it may cause the value of the vf packets to freeze. This results in an unexpected behaviour of the machine.
Is there any additional cost for using the accelerated networking feature?
No. There is no additional cost required for using the accelerated networking feature. For more information about the costing, contact Protegrity Support.
4.20.3.13 - Backing up and Restoring VMs on Azure
On Azure, you can prevent unintended loss of data by backing up your virtual machines. Azure allows you to optimize your backup by providing different levels of consistency. Similarly, the data on the virtual machines can be easily restored to a stable state. You can back up a virtual machine using the following two methods:
- Creating snapshots of the disk
- Using recovery services vaults
This following sections describe how to create and restore backups using the two mentioned methods.
Backing up and Restoring using Snapshots of Disks
The following sections describe how to create snapshots of disks and recover them on virtual machines. This procedure of backup and recovery is applicable for virtual machines that are created from disks and custom images.
Creating a Snapshot of a Virtual Machine on Azure
To create a snapshot of a virtual machine:
Sign in to the Azure homepage.
On the left pane, select Virtual machines.
The Virtual machines screen appears.
Select the required virtual machine and click Disks.
The details of the disk appear.
Select the disk and click Create Snapshot.
The Create Snapshot screen appears.

Enter the following information:
- Name: Name of the snapshot
- Subscription: Subscription account for Azure
Select the required resource group from the Resource group drop-down list.
Select the required account type from the Account type drop-down list.
Click Create.
The snapshot of the disk is created.
Restoring from a Snapshot on Azure
This section describes the steps to restore a snapshot of a virtual machine on Azure.
Before you begin
Ensure that the snapshot of the machine is taken.
How to restore from a snapshot on Azure
To restore a virtual machine from a snapshot:
On the Azure Dashboard screen, select Virtual Machine.
The screen displaying the list of all the Azure virtual machines appears.
Select the required virtual machine.
The screen displaying the details of the virtual machine appears.
On the left pane, under Settings, click Disks.
Click Swap OS Disk.
The Swap OS Disk screen appears.
Click the Choose disk drop-down list and select the snapshot created.
Enter the confirmation text and click OK.
The machine is stopped and the disk is successfully swapped.
Restart the virtual machine to verify whether the snapshot is available.
Backing up and Restoring using Recovery Services Vaults
Recovery services vault is an entity that stores backup and recovery points. They enable you to copy the configuration and data from virtual machines. The benefit of using recovery services vaults is that it helps organize your backups and minimize the overhead of management. It comes with enhanced capabilities of backing up data without compromising on data security. These vaults also allow you to create backup polices for virtual machines, thus ensuring integrity and protection. Using recovery services vaults, you can retain recovery points of protected virtual machines to restore them at a later point in time.
For more information about Recovery services vaults, refer to the following link:
https://docs.microsoft.com/en-us/azure/backup/backup-azure-recovery-services-vault-overview
Before you begin
This process of backup and restore is applicable only for virtual machines that are created from a custom image.
Creating Recovery Services Vaults
Before starting with the backup procedure, you must create a recovery services vault.
Before you begin
Ensure that you are aware about the pricing and role-based access before proceeding with the backup.
For more information about the pricing and role-based access, refer to the following links:
To create a recovery services vault:
Sign in to the Azure homepage.
On the Azure Dashboard screen, search Recovery Services vaults.
The screen displaying all the services vaults appears.
Click Add.
The Create Recovery Services vault screen appears.
Populate the following fields:
- Subscription: Account name under which the recovery services vault is created.
- Resource group: Associate a resource group to the vault.
- Vault name: Name of the vault.
- Region: Location where the data for recovery vault must be stored.
The Welcome to Azure Backup screen appears on the right pane.
Click Review + create .
The recovery services vault is created.
Backing up Virtual Machine using Recovery Services Vault
This section describes how to create a backup of a virtual machine using a Recovery Services Vault. For more information about the backup, refer to the link, https://docs.microsoft.com/en-us/azure/backup/backup-azure-vm-backup-faq
To create a backup of a virtual machine:
Sign in to the Azure homepage.
On the left pane, select Virtual machines.
The Virtual machines screen appears.
Select the required virtual machine.
On the left pane, under the Operations tab, click Backup.
The Welcome to Azure Backup screen appears on the right pane.
From the Recovery Services vault option, choose Select existing and select the required vault.
In the backup policy, you specify the frequency, backup schedule, and so on. From the Choose backup policy option, select a policy from the following options:
- DailyPolicy: Retain the daily backup taken at 9.00 AM UTC for 180 days.
- DefaultPolicy: Retain the daily backup taken at 10.30 AM UTC for 30 days.
- Create backup policy: Customize the backup policy as per your requirements.
Click Enable backup.
A notification stating that backup is initiated appears.
On the Azure Dashboard screen, search Recovery Services vaults.
The screen displaying all the services vaults appears.
Select the required services vault.
The screen displaying the details of the virtual machine appears.
On the center pane, under Protected items, click Backup items.
The screen displaying the different management types vault appears.
Select the required management type.
After the backup is completed, the list displays the virtual machine for which the backup was initiated.
Restoring a Virtual Machine using Recovery Services Vaults
In Azure, when restoring a virtual machine using Recovery Services vaults, you have the following two options:
- Creating a virtual machine: Create a virtual machine with the backed up information.
- Replacing an existing: Replace an existing disk on the virtual machine with the backed up information.
Restoring by Creating a Virtual Machine
This section describes how to restore a backup on a virtual machine by creating a virtual machine.
Before you begin
Ensure that the backup process for the virtual machine is completed.
How to restore by creating a virtual machine
To restore a virtual machine by creating a virtual machine:
On the Azure Dashboard screen, search Recovery Services vaults.
The screen displaying all the services vaults appears.
Select the required services vault.
The screen displaying the details of the services vault appears.
On the center pane, under Protected items, click Backup items.
The screen displaying the different management types vault appears.
Select the required management type.
The virtual machines for which backup has been initiated appears.
Select the virtual machine.
The screen displaying the backup details, and restore points appear.
Click Restore VM.
The Select Restore point screen appears.
Choose the required restore point and click OK.
The Restore Configuration screen appears.
If you want to create a virtual machine, click Create new.
Populate the following fields for the respective options:
- Restore type: Create a new virtual machine without overwriting an existing backup.
- Virtual machine name: Name for the virtual machine.
- Resource group: Associate vault to a resource group.
- Virtual network: Associate vault to a virtual network.
- Storage account: Associate vault to a storage account.
Click OK.
Click Restore.
The restore process is initiated. A virtual machine is created with the backed up information.
Restoring a Virtual Machine by Restoring a Disk
This section describes how to restore a backup on a virtual machine by restoring a disk on a virtual machine.
Before you begin
Ensure that the backup process for the virtual machine is completed. Also, ensure that the VM is stopped before performing the restore process.
How to restore a virtual machine by creating a virtual machine
To restore a virtual machine by creating a virtual machine:
On the Azure Dashboard screen, search Recovery Services vaults.
The screen displaying all the services vaults appears.
Select the required services vault.
The screen displaying the details of the services vault appears.
On the center pane, under Protected items, click Backup items.
The screen displaying the different management types vault appears.
Select the required management type.
The virtual machines for which backup has been initiated appears.
Select the virtual machine.
The screen displaying the backup details, and restore points appear.
Click Restore VM.
The Select Restore point screen appears.
Choose the required restore point and click OK.
The Restore Configuration screen appears.
Click Replace existing.
Populate the following fields:
- Restore type: Replace the disk from a selected restore point.
- Staging location: Temporary location used during the restore process.
Click OK.
Click Restore.
The restore process is initiated. The backup is restored by replacing an existing disk on the machine with the disk containing the backed up information.
4.20.3.14 - Deploying the ESA Instance with the Protectors
You can configure the various protectors that are a part of the Protegrity Data Security Platform with an instance of the ESA appliance running on Azure.
Depending on the cloud-based environment that hosts the protectors, the protectors can be configured with the instance of the ESA appliance in one of the following ways:
- If the protectors are running on the same virtual network as the instance of the ESA appliance, then the protectors need to be configured using the internal IP address of the ESA appliance within the virtual network.
- If the protectors are running on a different virtual network than that of the ESA appliance, then the virtual network of the ESA instance needs to be configured to connect to the virtual network of the protectors.
4.21 - Architectures
4.21.1 - Logging architecture
Architecture overview
Logging follows a fixed routine. The system generates logs, which are collected and then forwarded to Insight. Insight stores the logs in the Audit Store. The Audit Store holds the logs and these log records are used in various areas, such as, forensics, alerts, reports, dashboards, and so on. This section explains the logging architecture.

ESA:
The ESA has the td-agent service installed for receiving and sending logs to Insight. Insight stores the logs in the Audit Store that is installed on the ESA. From here, the logs are analyzed by Insight and used in various areas, such as, forensics, alerts, reports, dashboards, visualizations, and so on. Additionally, logs are collected from the log files generated by the Hub Controller and Membersource services and sent to Insight. By default, all Audit Store nodes have all node roles, that is, Master-eligible, Data, and Ingest. A minimum of three ESAs are required for creating a dependable Audit Store cluster to protect it from system crashes. The architecture diagram shows three ESAs. Legacy protectors send logs to the ESA using the Log Facade.
Protectors:
The logging system is configured on the protectors to send logs to Insight on the ESA using the Log Forwarder.
DSG:
The DSG has the td-agent service installed. The td-agent forwards the appliance logs to Insight on the ESA. The Log Forwarder service forwards the data security operations-related logs, namely protect, unprotect, and reprotect, and the PEP server logs to Insight on the ESA.
Important: The gateway logs are not forwarded to Insight.
Container-based protectors
The container-based protectors are the Immutable Java Application Protector Container and REST containers. They Immutable Java Application Protector Container represents a new form factor for the Java Application Protector. The container is intended to be deployed on the Kubernetes environment.
The REST container represents a new form factor that is being developed for the Application Protector REST. The REST container is deployed on Kubernetes, residing on any of the Cloud setups.
Components of Insight
The solution for collecting and forwarding the logs to Insight composes the logging architecture. The various components of Insight are installed on an appliance or an ESA.
A brief overview of the Insight components is provided in the following figure.

Understanding Analytics
Analytics is a component that is configured when setting up the ESA. After it is installed, the tools, such as, the scheduler, reports, rollover tasks, and signature verification tasks are available. These tools are used to maintain the Insight indexes.
Understanding the Audit Store Dashboards
The logs stored in the Audit Store hold valuable data. This information is very useful when used effectively. To view the information in an effective way, Insight provides tools such as dashboards and visualization. These tools are used to view and analyze the data in the Audit Store. The ESA logs are displayed on the Discover screen of the Audit Store Dashboards.
Understanding the Audit Store
The Audit Store is the database of the logging ecosystem. The main task of the Audit Store is to receive all the logs, store them, and provide the information when log-related data is requested. It is very versatile and processes data fast.
The Audit Store is a component that is installed on the ESA during the installation. The Audit Store is scalable, hence, additional nodes can be added to the Audit Store cluster.
Understanding the td-agent
The td-agent forms an integral part of the Insight ecosystem. It is responsible for sending logs from the appliance to Insight. It is the td-agent service that is configured to send and receive logs. The service is installed, by default, on the ESA and DSG.
Based on the installation, the following configurations are performed for the td-agent:
- Insight on the local system: In this case, the td-agent is configured to collect the logs and send it to Insight on the local system.
- Insight on a remote system: In this case, Insight is not installed locally, such as the DSG, but it is installed on the ESA. The td-agent is configured to forward logs securely to Insight in the ESA.
Understanding the Log Forwarder
The Log Forwarder is responsible for forwarding data security operation logs to Insight in the ESA. In cases when the ESA is unreachable, the Log Forwarder handles the logs until the ESA is available.
For Linux-based protectors, such as the Oracle Database Protector for Linux, if the connection to the ESA is lost, then the Log Forwarder starts collecting the logs in the memory cache. If the ESA is still unreachable after the cache is full, then the Log Forwarder continues collecting the logs and stores in the disk. When the connection to the ESA is restored, the logs in the cache are forwarded to Insight. The default memory cache for collecting logs is 256 MB. If the filesystem for Linux protectors is not EXT4 or XFS, then the logs will not be saved to the disk after the cache is full.
The following table provides information about how the Log Forwarder handles logs in different situations.
| If.. | then the Log Forwarder… |
|---|---|
| Connection to ESA is lost | Starts collecting logs in the in-memory cache based on the cache limit defined. |
| Connection to ESA is lost and the cache is full | In case of Linux-based protectors, the Log Forwarder continues to collect the logs and stores in disk. If the disk space is full, then all the cache files are emptied and the Log Forwarder continues to run. For Windows-based protectors, the Log Forwarder starts throwing away the logs. |
| Connection to ESA is restored | Forwards logs to Insight on the ESA. |
Understanding the log aggregation
The architecture, the configurations, and the workflow provided here describes the log aggregation feature.
Log aggregation happens within the protector.
- Protector flushes all security audits once every second, by default. If a different user, data elements, or operations are involved, the number of security logs generated every second varies. The operations include protect, unprotect, or reprotect. Also, the generation rate of security logs depends on the number of users, data elements, and operations involved.
- FluentBit, by default, sends one batch every 10 second and when this occurs it will take all security and application logs.
The following diagram describes the architecture and the workflow of the log aggregation.

- The security logs generated by the protectors are aggregated in the protectors.
- The application logs are not aggregated and they are sent directly to the Log Forwarder.
- The security logs are aggregated and flushed at specific time intervals.
- The aggregated security logs from the Log Forwarder are forwarded to Insight.
The following diagram illustrates how similar logs are aggregated.

The similar security logs are aggregated after the log send interval or when an application is stopped.
For example, if 30 similar protect operations are performed simultaneously, then a single log will be generated with a count of 30.
4.21.2 - Overview of the Protegrity logging architecture
Overview of logging
Protegrity software generates comprehensive logs. The logging infrastructure generates a huge number of log entries that take time to read. The enhanced logging architecture consolidates logs in Insight. Insight stores the logs in the Audit Store and provides tools to make it easier to view and analyze log data.
When the user performs some operation using Protegrity software, or interact with Protegrity software directly, or indirectly using a different software or interface, a log entry is generated. This entry is stored in the Audit Store with other similar entries. A log entry contains valuable information about the interaction between the Protegrity software and a user or other systems.
A log entry might contain the following information:
- Date and time of the operation.
- User who initiated the operation.
- Operation that was initiated.
- Systems involved in the operation.
- Files that were modified or accessed.
As the transactions build up, the quantum of logs generated also increases. Every day a lot of business transactions, inter-process activities, interactivity-based activities, system level activities, and other transactions take place resulting in a huge number of log entries. All these logs take up a lot of time and space to store and process.
Evolution of logging in Protegrity
Every system had its own advantages and disadvantages. Over time, the logging system evolved to reduce the disadvantages of the existing system and also improve on the existing features. This ensured that a better system was available that provided more information and at the same time reduced the processing and storage overheads.
Logging in legacy products
In legacy Protegrity platforms, that is version 8.0.0.0 and earlier, security events were collected in the form of logs. These events were a list of transactions when the protection, unprotection, and reprotection operations were performed. The logs were delivered as a part of the customer Protegrity security solution. This system allowed tracking of the operations and also provided information for troubleshooting the Protegrity software.
However, this had disadvantages due to the volume of the logs generated and the granularity of the logs. When many security operations were performed, the volume of logs kept on increasing. This made it difficult for the platform to keep track of everything. When the volume increased beyond a limit and could not be managed, then customers had to turn off receiving log operations for the successful attempts to get protected data in the clear.
The logs collected reported the security operations performed. However, the exact number of operations performed was difficult to record. This inconsistency existed across the various protectors. The SDKs could provide individual counts of the operations performed while database protectors could not provide the exact count of the operations performed.
To solve this issue of obtaining exact counts, the capability called metering was added to the Protegrity products. Metering provided a count of the total number of security events. Even in the case of Metering, storage was an issue. This is because one audit log was generated in PostgreSQL in each ESA. Cross replications of logs across ESAs was a challenge because there was no way to automatically replicate logs across ESAs.
New logging infrastructure
Protegrity continues to improve on the products and solutions provided. Starting from version 8.1.0.0, a new and robust logging architecture in introduced on the ESA. This new system improves on the way audit logs are created and processed on the protectors. The logs are processed and aggregated according to the event being performed. For example, if 40 protect operations are performed on the protector, then one log with the count 40 is created instead of 40 individual logs for each operation. This reduces the number of logs generated and at the same time retains the quality of the information generated.
The audit logs that are created provide a lot of information about the event being performed on the protector. In addition to system events and protection events, the audit log also holds information for troubleshooting the protector and the security events on the protector. This solves the issue of granularity of the logs that existed in earlier systems. An advantage of this architecture is that the logs help track the working of the system. It also allows monitoring the system for any issues, both in the working of the system and from a security perspective.
The new architecture uses software, such as, Fluent Bit and Fluentd. These allow logs to be transported from the protector to the ESA over a secure, encrypted line. This ensures the safety and security of the information. The new architecture also used Elasticsearch for replicating logs across ESAs. It made the logging system more robust and protected the data from being lost in the case of an ESA failure. Over iterations, the Elasticsearch was upgraded with additional security using Open Distro. From version 9.1.0.0, OpenSearch was introduced that improved the logging architecture further. These software provided configuration flexibility to provide a better logging system.
From version 9.2.0.0, Insight is introduced that allow the logs to be visualized and various reports to be created for monitoring the health and the security of the system. Additionally, from the ESA version 9.2.0.0 and protectors version 9.1.0.0 or 9.2.0.0 the new logging system has been improved even further. It is now possible to view how many security operations the Protegrity solution has delivered and what Protegrity protectors are being used in the solution.
The audit logs generated are important for a robust security solution and are stored in Insight in the ESA. Since the volume of logs generated have been reduced in comparison to legacy solutions, the logs are always received by the ESA. Thus, the capability to turn off logging is no longer required and has been deprecated. The new logging architecture offers a wide range of tools and features for managing logs. In the case where the volume of logs is very large, the logs can be archived using the Index Lifecycle Management (ILM) to the short term archive or long term archive. This frees up the system and resources and at the same time makes the logs available when required in the future.
For more information about ILM, refer here.
The process for archiving logs can also be automated using the scheduler provided with the ESA. In addition to archiving logs, the processes for auto generating reports, rolling over the index, and performing signature verification can also be automated.
For more information about scheduling tasks, refer here.
5 - Key Management
A Key Management solution that an enterprise selects must ensure that data encryption does not disrupt organizational functions. Key Management solutions must provide secure administration of keys through their life cycle. This includes generation, use, distribution, storage, recovery, rotation, termination, auditing, and archival.
5.1 - Protegrity Key Management
The following keys are a part of the Protegrity Key Management solution:
- Key Encryption Key (KEK): The cryptographic key used to protect other keys. It is also known as the Master Key (MK). It protects the Data Store Keys, Repository Keys, Signing Keys, and Data Element Keys.
- Data Encryption Key (DEK): The cryptographic keys used to protect sensitive data. The Data Encryption Keys (DEKs) are categorized as follows:
- Repository Key: It protects the policy information in the ESA.
- Signing Key: The protector utilizes the signing key to sign the audit logs for each data protection operation.
- Data Store Key: These keys are no longer used and are only present due to backward compatibility.
- Data Element Key: The cryptographic key that is used to protect sensitive data linked to an encryption data element.
Key Encryption Key (KEK) in Protegrity
- The Protegrity Key Encryption Key (KEK) is known as the Master Key (MK).
- It uses AES with a 256-bit key.
- The MK is non-exportable and is generated and stored within the active Key Store.
- The MK is responsible for protecting all the DEKs.
- The MK, RK, and signing key are generated when the ESA Policy and Key Management is initialized.
Data Encryption Keys (DEKs) in Protegrity
- The Repository Key (RK), Signing Key, Data Store Keys (DSKs), and Data Element Keys are collectively referred to as the (DEKs).
- The RK, Signing Key, and DSK are AES 256-bit keys.
- The Data Element Keys can be both 128-bit and 256-bit keys depending on the protection method used.
- The DEKs are generated by the active Key Store.
Key Usage Overview
In the Protegrity Data Security Platform, endpoint protection is implemented through policies. The keys form a part of the underlying infrastructure of a policy and are not explicitly visible.
The following figure provides an overview of the key management workflow.
- All MKs are stored in the Key Store.
- In the ESA, all DEKs are stored and protected by the MK.
- In the Protector, the Signing key and Data Element Keys are stored in the memory.
Certificates
Certificates in Protegrity are generated when the ESA is installed. These certificates are used for internal communication between various components in the ESA. Their related keys are used for communication between the ESA and protectors.
For more information about certificates, refer to the section Certificates in ESA in the Certificate Management.
Key Store
A Key Store is a device used to generate keys, store keys, and perform cryptographic operations. The MK is stored in the Key Store and it is used to protect and un-protect DEKs.
When an enterprise implements a data protection solution in their infrastructure, they must carefully consider the type of Key Store to use as part of the implementation strategy. The Key Store can be connected to the Soft HSM, HSM, or KMS.
When the ESA is installed, the internal Protegrity Soft HSM generates the Master Key (MK). When switching Key Store, a new MK is generated in the new Key Store. The existing DEKs are re-protected using this new MK and the old MK is deactivated.
Protegrity Soft HSM: The Protegrity Soft HSM is an internal Soft HSM bundled with the ESA. The Protegrity Soft HSM provides all the functionalities that are provided by an HSM. Using the Protegrity Soft HSM ensures that keys remain within the secure perimeter of the data security solution (ESA).
HSM: The Protegrity Data Security Platform provides you the flexibility, if needed, to switch to an HSM.
Ensure that the HSM supports the PKCS #11 interface.
For more information about switching from the Key Store, refer to the HSM Integration.
Cloud KMS: Cloud-hosted Key Management Service (KMS) enables you to host encryption keys in a cloud-hosted KMS. You can perform cryptographic operations using this service as well. Protegrity supports Amazon Web Service (AWS) KMS, Google Cloud Platform (GCP) KMS, and Azure key management service. The KMS support varies by vendors, where some vendors support creating HSM-level keys.
For more information about switching Protegrity Soft HSM to Cloud KMS, refer to the section Key Store Management.
5.2 - Key Management Web UI
Master Keys Web UI
Information related to Master Keys, such as, state, timestamps for key creation and modification, and so on is available on the Master Keys Web UI.
The following image shows the Master Keys UI.

Repository Keys Web UI
Information related to Repository keys, such as, state, timestamps for key creation and modification, and so on is available on the Repository Keys Web UI.
The following image shows the Repository Keys UI.

Data Store Keys Web UI
Information related to DSKs, such as, state, timestamps for key creation and modification, and so on is available on the Data Store Keys Web UI.
The following image shows the Data Store Keys UI.

The options available as part of the UI are explained in the following table.
| No. | Option | Description |
|---|---|---|
| 1 | Select multiple Data Store | Select the check box to rotate multiple Data Stores at the same time. |
| 2 | Data Store Name | Click to view information related to Active DSK and older keys. |
| 3 | UID | Unique identifier of the key. |
| 4 | State | Current State of the DSK linked to the Data Store. |
| 5 | OUP | The period of time in the cryptoperiod of a symmetric key during which cryptographic protection may be applied to data. |
| 6 | RUP | The period of time during the cryptoperiod of a symmetric key during which the protected information is processed. |
| 7 | Generated By | Indicates which Key Store has the generated key. |
| 8 | Action | Rotate - Click to rotate the DSK for a Data Store Key. |
| 9 | Rotate | Click to rotate the DSK for multiple selected Data Store Keys. |
If you click the Data Store name, for example DS1, you can view detailed information about the active key and older keys.

The Action column provides an option to change the state of a key to Destroyed or mark the key as Compromised. For more information about the options available for DSK states, refer to Changing Key States.
Signing Key Web UI
The Signing Key is used to add a signature to log records generated for each data protection operation. These signed log records are then sent from the Protector to the ESA. The Signing Key is used to identify if log records have been tampered with and that they are received from the required protection endpoint or Protector.
A single Signing Key is linked and deployed with all the data stores. At a time, only one Signing Key can be in the Active state.
The following image shows the Signing Keys UI.
Data Element Keys Web UI
Information related to Data Element Keys, such as, state, OUP, RUP, and so on is available on the Data Element Keys Web UI.
The following image shows the Data Element Keys UI.

The options available as part of the UI are explained in the following table.
| No | Option | Description |
|---|---|---|
| 1 | Data Element Name | Click to view information related to the Active Data Element Key and older keys. |
| 2 | UID | Unique identifier of the key. |
| 3 | State | Current State of the Data Element Key linked to the Data Element. |
| 4 | OUP | The period of time in the cryptoperiod of a symmetric key during which cryptographic protection may be applied to data. |
| 5 | RUP | The period of time during the cryptoperiod of a symmetric key during which the protected information is processed. |
| 6 | Generated By | Indicates the source of key generation: - Soft HSM - The key has been generated by Protegrity Soft HSM. - Key Store - The Key Store used to generate the key. - Software - This option appears if you have generated the Data Element Key in an earlier version of the ESA before upgrading the ESA to v10.2.0. |
| 7 | Action | Create New Key: Click to create a new key. This option is available only if you have created a Data Element Key with a key ID. |
If you click the Data Element name, for example AeS256KeyID, then you can view detailed information about an active key and older keys.

If key ID is enabled for a data element, then you click Create New Key to create a new key for the data element.
Important: Starting from the ESA v10.2.0, the Data Element Keys are generated by the active Key Store. When MK is rotated, all DEKs needs to be re-protected. As a result, if you are using too many keys, then your system might slow down in the following scenarios:
You are frequently rotating the keys.
You are using too many encryption data elements where the Key ID is enabled. This allows you to create multiple keys for the same encryption data element.
You are using too many data stores.
Your connection to the HSM is slow.
You can find out the total number of keys currently in use from the Keys area in the Policy Management Dashboard.
5.3 - Working with Keys
Key rotation involves putting the new encryption key into active use. Key rotation can take place when the key is about to expire or when it needs to be deactivated due to malicious threats.
Master Key (MK), Repository Key (RK), Data Store Key (DSK), and Signing Key
The key rotation for KEKs and DEKs in the Protegrity Data Security Platform can be described as follows:
- The Master Key (MK), Repository Key (RK), Data Store Key (DSK), and Signing Key can be rotated using the ESA Web UI.
- The supported states for the MK, RK, DSK, and Signing Key are Active, Deactivated, Compromised, and Destroyed.
- When the ESA is installed, the MK, RK, and Signing Key are in the Active state.
- When the MK, RK, DSK, and Signing Key is rotated, the old key state changes from Active to Deactivated, while the new key becomes Active.
- The MK, RK, DSK, and Signing Key is set for automatic rotation ten days prior to the Originator Usage Period (OUP) expiration date by default.
- On the ESA Web UI, navigate to Key Management > Key Name to view the key details.
- The rotation for the MK, RK, DSK, and Signing Key from the ESA Web UI requires the user to be assigned with the KeyManager role.
Viewing the Key Information
You can view the MK,RK, DSK, and Signing Key information, such as, state, OUP, RUP,and other details using the Web UI. To view the key information:
- On the ESA Web UI, click Key Management > Required Key tab.
For example; if you select MK, the MK screen appears.

- In the Current key info section, view the current key information.
- The table displays the information related to the older Master Key.
You can rotate the MK, RK, DSK, and Signing Key by clicking the Rotate button.
Disable automatic ESA Master Key Rotation
Warning: Protegrity recommends not to disable automatic ESA Master Key rotation. Only security administrator can disable or enable automatic ESA Master Key rotation.
An automatic ESA Master Key rotation feature can be disabled or enabled through the ESA web UI.
To disable the automatic ESA Master Key rotation:
- On the ESA Web UI, click Key Management > Master Keys.
The Master Keys screen appears. - Click the Disable Automatic key rotation button.
A confirmation message appears. - Click OK.
The Automatic rotation for master keys has been disabled successfully message appears.
Note:
- When automatic ESA Master Key rotation is enabled or disabled, audit logs are generated. These logs provide information about the type of key and its ID.
- To enable the automatic ESA Master Key rotation, click the Enable Automatic key rotation button.
Changing the Key States
The following table provides information about the possible key states for MK, RK, DSK, and Signing Key that you can change based on their current state.
Current Key State | Can change state to | State Change | |
State | Reason | ||
Active | Deactivated |
| Auto |
Deactivated | Compromised | Key is compromised. | Manual |
Destroyed | Organization requirement | Manual | |
In the Deactivated key state, you can -
- Click Compromised to mark the key as Compromised and display a Compromised label next to the state.
- Click Destroy to mark the key as Destroyed and display a Destroyed label next to the state.
Data Element Keys
Data elements can have key IDs associated with them. Key IDs are a way to correlate a data element with its encrypted data. When a data element is created, and if the protection method is key based, a unique Data Element Key is generated. This key is seen in the Key Management Web UI.
Information related to Data Element Keys, such as, state, OUP, RUP, and so on is available on the Data Element Keys Web UI.
To view information about the Data Element Key:
- On the ESA Web UI, click Key Management > Data Element Keys.
The View and manage Data Element Keys screen displays the list of data element keys. - Click a data element name, for example DE1. The Data Elements tab appears, which displays the current information about the Data Element Key.
- The table displays the information related to the older Data Element Keys.
Data Element Key States
This section describes the key states for the Data Element Keys.
The following table provides information about the possible key states for the Data Element Keys that you can change based on their current state.
Current Key State | Can change state to | State Change | |
State | Reason | ||
| Preactive | Active | Deploying a policy | Auto |
Active | Deactivated | Adding a new key to the data element.If you click the Data Element name, for example AES256KeyID, then you click Create New Key button to create a new key for the data element. | Auto |
When you create a new key, its state is set to Preactive state.
Key Cryptoperiod and States
Cryptoperiods can be defined as the time span for which the key remains available for use across an enterprise. Setting cryptoperiods ensures that the probability of key compromise by external threats is limited. Shorter cryptoperiods ensure that the strength of security is greater.
In the ESA, the Master Key, Repository Key, Signing Key, Data Store Key, and the Data Element Keys are governed by cryptoperiods. For these keys in the ESA, the validity is dictated by the Originator Usage Period (OUP) and the Recipient Usage Period (RUP). The OUP is the period until when the key can be used for protection, while the RUP is the period when the key can be used to unprotect only.
For keys in Protegrity, the following table provides the OUP and RUP information.
| Key Name | OUP | RUP |
|---|---|---|
| Master Key | 1 Year | 1 Year |
| Repository Key | <=2 Years | <=5 Years |
| Data Store Key | <=2 Years | <=5 Years |
| Signing Key | <=2 Years | <=5 Years |
| Data Element Key | <=2 Years | <=5 Years |
For more information about key states, refer to Changing Key States.
5.4 - Key Points for Key Management
- The user must have the KeyManager role to rotate the Repository Key (RK), Master Key (MK), Signing Key, and Data Store Key (DSK).
- Key Rotation must be performed only after reviewing the existing policies or regulatory compliances followed by your organization.
- It is essential that a Corporate Incident Response Plan is drafted to:
- Understand the security risks of key rotation.
- Handle situations where keys might be compromised.
- Consult with security professionals, such as Protegrity, to understand how to enable key rotation. Minimize the impact on business processes affected by the keys during this process.
5.5 - Keys-Related Terminology
The following table provides an introduction to terminology related to keys that can help you understand Protegrity Key Management.
| Term | Definition |
|---|---|
| Master Key (MK) | It is generated and stored in the Key Store. When the Key Management is initialized, the Key Store is switched or active key is rotated. MK protects all DEKs in the Policy repository. |
| Repository Key (RK) | It is generated in the configured Key Store when the Key Management is initialized or active key is rotated. It is protected by MK. It protects the Policy Repository in ESA. |
| Data Store Keys (DSK) | It is generated in the configured Key Store when a Data Store is created. It is protected by MK. It is only used to protect staging located on the ESA. |
| Signing Key | It is generated in the configured Key Store when the ESA is installed and key management is initialized. It is protected by MK.It is used to sign the audits generated by protectors. It is used by the Protector to add a signature to the log records generated for each data protection operation, which are then sent from the Protector to the ESA.The Signing Key helps to identify that the log records have not been tampered with and are received from the required protection endpoint or Protector. |
| Key Encryption Keys (KEK) | It protects other keys. In Protegrity Data Security Platform, the MK is the KEK. |
| Data Encryption Keys (DEK) | It is used to protect data. In the Protegrity Data Security Platform, the RK, Signing Key, DSK, and Data Element Keys are the DEKs. |
| Data Element Keys | It is generated when a data element is created. This key protects the sensitive data. |
| Protegrity Soft HSM | It is internally housed in the ESA. It is used to generate keys and stores the Master key. |
| Key Store - HSM or KMS | The Key Store can be a Hardware Security Module (HSM), or other supported Key Management Service (KMS) that can store keys and perform cryptographic operations. |
| NIST 800-57 | NIST Special Publication 800-57 defines best practices and recommendations for the Key Management. |
| FIPS 140-2 | Federal information process standard (FIPS) used to accredit cryptographic modules. |
| PKCS#11 Interface | Standard API for Key Management. |
| Key States | The state of a key during the key life cycle. |
| Cryptoperiods | The time span during which a specific key is authorized for use or in which the keys for a given system or application may remain in effect. |
| Originator Usage Period (OUP) | The period of time in the cryptoperiod of a symmetric key during which cryptographic protection may be applied to data |
| Recipient Usage Period (RUP) | The period of time during the cryptoperiod of a symmetric key during which the protected information is processed. |
| Endpoint | It is the protection endpoint. In most cases, it is the Protector. |
| Policy Repository | Internal storage in ESA, which stores policy information including the Master key properties and all DEK properties. |
5.6 - Key Store Management
Creating Key Stores
The steps to create a Key Store depend on the type, as shown in the following table.
Only users with a Security Administrator privileges can create Key Stores.
| Key Store Type | Steps to Create Key Store |
|---|---|
| PKCS #11 | |
| AWS KMS | Configuring the ESA with AWS KMS |
| Google Cloud KMS | Configuring the ESA with Google Cloud KMS |
| Azure Key Vault Managed HSM | Configuring the ESA with Azure Key Vault Managed HSM |
Managing Key Stores
A user with Security Administrator privileges can fully modify Key Stores after they have been created. However, a user with Security Viewer privileges cannot modify Key Stores.
Deleting Key Stores
Only a user with Security Administrator privileges can delete Key Stores. However, an active Key Store cannot be deleted. Also, the default Protegrity Soft HSM cannot be deleted.
To remove a Key Store:
On the ESA Web UI, navigate to Key Management > Key Stores.
The Key Stores tab appears.
Select the name of a key store from the list, and click the Delete action.
A confirmation dialog box appears.
Click OK.
A message Key Store has been deleted successfully appears.
5.6.1 - Support Matrix
Support Matrix for HSM
The following table for the support matrix describes the hardware requirements, software requirements, and the compatibility information of the Enterprise Security Administrator (ESA) and the Hardware Security Module (HSM).
| System or Appliance | Supported Version |
|---|---|
| Enterprise System Administrator (ESA) | 10.2.0 and later |
| Thales Luna Appliance | 7.4.0 |
| Firmware | 7.3.3 |
| Thales Luna Universal Client | 10.3.0 |
| Thales Data Protection on Demand (DPoD) Universal Client | 10.7 |
Support Matrix for Cloud Platforms
The following table provides compatibility information of the cloud platforms, such as Amazon Web Services (AWS), Azure, and Google Cloud Platform (GCP) with the Protegrity ESA appliance.
| Cloud Platform | Supported Version |
|---|---|
| AWS | ESA 10.2.0 and later |
| Azure | ESA 10.2.0 and later |
| GCP | ESA 10.2.0 and later |
5.6.2 - Configuring the ESA with HSMs supporting PKCS#11 Interface
Verifying the Prerequisites
Ensure that the following prerequisites are met:
Ensure that you have downloaded HSM Client on your local machine.
Ensure that the HSM partition is initialized.
Ensure that you have downloaded the required libraries, configuration files, and certificates required for connecting to the HSM. The certificates can include the server certificate of the HSM, the client certificate for the ESA appliance, and the CA certificate.
For more information required about the files required for connecting to the HSM, refer the documentation for the corresponding HSM.
Configuring Connection with HSM
To configure a connection with an HSM:
On the ESA Web UI, navigate to Key Management > Key Stores.
The Key Stores screen appears.
Click New Key Store.
The Create New Key Store screen appears.
In the Key Store Information section, enter the following details.
- Name: Type a unique name for HSM. The name that you type will update the Key Store installation path field.
- Type: Select PKCS #11.
In the PKCS#11 details section, enter the following details:
- User pin: Specify the user pin for the given slot ID of the HSM.
- Slot: Enter the slot ID for the HSM.
Perform the following steps to add the environment variables.
To configure the PKCS #11 connection, you need to override the default location of the HSM configuration file. You can do this by setting the environment variable for the HSM-specific library.In the Key Store files and environment variables > Key Store environment variables section, click Add environment variable.
The Add Key Store environment variable dialog box appears.Enter the following details:
- Environment variable name: Specify the environment variable name for the HSM.
For example, specify the ChrystokiConfigurationPath for Thales Luna HSM. - Environment variable value: Specify the value for the environment variable.
For example, specify /opt/protegrity/keystore/<Keystore_name>, which is the value of the Key Store installation path field, for the Thales Luna HSM.
If you want to mask the value of the variable in the UI, then click the Sensitive toggle to the on position. This ensures that the variable value is hidden while typing and is replaced with asterisks of a fixed-length in the list of environment variables.
- Click Save.
In the Key Store files and environment variables > Key Store files section, click Add File.
The Add Key Store File dialog box appears.Select the specific file type from the drop-down menu. The following table provides more detail on each selectable type. Note that only one type of file can be selected at a time.
| File Type | File |
|---|---|
| Library | Select the HSM library file from your local machine. For example, for Thales Luna HSM, select the libCryptoki2_64.so file. |
| Configuration | Select the HSM configuration file from your local machine. For example, for Thales Luna HSM, select the Chrystoki.conf file. |
| Other | Select the HSM client certificate, client key, and server certificate from your local machine. |
Click Add File to add the file to the Key Store files section.
Repeat steps 7 to 8 till you have added all the files required to connect to the Key Store.
Perform the following steps to edit the configuration file.
a. Click the Edit icon next to the configuration file.
The Edit Key Store File screen appears.b. Update the path of the required configuration parameters to match the path displayed in the Key Store installation path field.
c. Click Save.
The Edit Key Store File screen closes.Click Save.
The Key Store saved successfully message appears.Click Test to test the Key Store connection.
The Test Key Store Connection dialog box appears.Click OK to close the Test Key Store Connection dialog box.
Click Set As Active to activate the Key Store.
5.6.3 - Configuring the ESA with the Thales Luna HSM
Verifying the Prerequisites
Ensure that the following prerequisites are met:
Ensure that the HSM partition is initialized.
Ensure that you have downloaded the required libraries, configuration files, and certificates required for connecting to the HSM. The certificates can include the server certificate of the Thales Luna HSM, the client certificate for the ESA appliance, and the CA certificate.
For more information required about the files required for connecting to the Thales Luna HSM, refer to the Thales Luna documentation.Ensure that the following roles on the Thales Luna HSM are granted read and write permissions:
- Partition Officer (PO) / Security Officer (SO)
- Crypto Officer (CO)
- Crypto User (CU)
It is recommended to configure the Thales Luna HSM client library to authenticate using the Crypto User (CU). The following setting in the Miscellaneous section of the Chrystoki.conf configuration file configures the role to use for the challenge request status.
ProtectedAuthenticationPathFlagStatus = 2Note: The Crypto User (CU) must be initialized on the Thales Luna HSM by using methods, such as, setting a PIN for the Crypto User (CU).
For more information about initializing the Crypto User (CU), refer to the documentation of the HSM vendor.
Configuring Connection with Thales Luna HSM
To configure a connection with Thales Luna HSM:
On the ESA Web UI, navigate to Key Management > Key Stores.
The Key Stores screen appears.
Click New Key Store.
The Create New Key Store screen appears.
In the Key Store Information section, enter the following details.
- Name: Type a unique name for HSM. For example, type Thales_Luna_HSM. The name that you type will update the Key Store installation path field.
- Type: Select PKCS #11.
In the PKCS#11 details section, enter the following details:
- User pin: Specify the user pin for the given slot ID of the Thales Luna HSM.
- Slot: Enter the slot ID for the Thales Luna HSM.
In the Key Store files and environment variables > Key Store environment variables section, click Add environment variable.
The Add Key Store environment variable dialog box appears.Enter the following details, and then click Save:
- Environment variable name: Specify ChrystokiConfigurationPath as the environment variable name for the Thales Luna HSM.
- Environment variable value: Specify the value for the environment variable.
For example, specify /opt/protegrity/keystore/<Keystore_name>, which is the value of the Key Store installation path field, for the Thales Luna HSM.
If you want to mask the value of the variable in the UI, then click the Sensitive toggle to the on position. This ensures that the variable value is hidden while typing and is replaced with asterisks of a fixed-length in the list of environment variables.
In the Key Store files and environment variables > Key Store files section, click Add File.
The Add Key Store File dialog box appears.Enter the following details.
File Type File Library Select the libCryptoki2_64.so HSM library file from your local machine. Configuration Select the Chrystoki.conf HSM configuration file from your local machine. Other Select the Thales Luna HSM client certificate, client key, and server certificate from your local machine.
Note: You can select only one file at a time.
Click Add File to add the file to the Key Store files section.
Repeat steps 7 to 9 till you have added all the files required to connect to the Key Store.
Perform the following steps to edit the configuration file.
a. Click the Edit icon next to the configuration file.
The Edit Key Store File screen appears.b. Update the path of the required configuration parameters to match the path displayed in the Key Store installation path field.
c. Click Save.
The Edit Key Store File screen closes.Click Save.
The Key Store saved successfully message appears.Click Test to test the Key Store connection.
The Test Key Store Connection dialog box appears.Click OK to close the Test Key Store Connection dialog box.
Click Set As Active to activate the Key Store.
> Note: If you are using the Thales Luna HSM on an external network, then the policy management services might have a longer start-up time due to network latency.
5.6.4 - Configuring the ESA with Thales Data Protection on Demand (DPoD) HSM
Verifying the Prerequisites
Ensure that the following prerequisites are met:
Ensure that the HSM partition is initialized.
Ensure that you have downloaded the required libraries, configuration files, and certificates required for connecting to the HSM. The certificates can include the server certificate of the Thales DPoD HSM, the client certificate for the ESA appliance, and the CA certificate.
For more information required about the files required for connecting to the Thales DPoD HSM, refer to the Thales DPoD documentation.Ensure that the following roles on the Thales DPoD HSM are granted read and write permissions:
- Partition Officer (PO) / Security Officer (SO)
- Crypto Officer (CO)
- Crypto User (CU)
Configuring Connection with Thales DPoD HSM
To configure connection with Thales DPoD HSM:
On the ESA Web UI, navigate to Key Management > Key Stores.
The Key Stores screen appears.
Click New Key Store.
The Create New Key Store screen appears.
In the Key Store Information section, enter the following details.
- Name: Type a unique name for HSM. For example, type Thales_DPoD_HSM. The name that you type will update the Key Store installation path field.
- Type: Select PKCS #11.
In the PKCS#11 details section, enter the following details:
- User pin: Specify the user pin for the given slot ID of the Thales DPoD HSM.
- Slot: Enter the slot ID for the Thales DPoD HSM.
In the Key Store files and environment variables > Key Store environment variables section, click Add environment variable.
The Add Key Store environment variable dialog box appears.Enter the following details, and then click Save:
- Environment variable name: Specify ChrystokiConfigurationPath as the environment variable name for the Thales DPoD HSM.
- Environment variable value: Specify the value for the environment variable.
For example, specify /opt/protegrity/keystore/<Keystore_name>, which is the value of the Key Store installation path field, for the Thales DPoD HSM.
If you want to mask the value of the variable in the UI, then click the Sensitive toggle to the on position. This ensures that the variable value is hidden while typing and is replaced with asterisks of a fixed-length in the list of environment variables.
In the Key Store files and environment variables > Key Store files section, click Add File.
The Add Key Store File dialog box appears.Enter the following details.
File Type File Library Select the libCryptoki2_64.so HSM library file from your local machine. Configuration Select the Chrystoki.conf HSM configuration file from your local machine.
Note: You can select only one file at a time.
Click Add File to add the file to the Key Store files section.
Repeat steps 7 to 9 till you have added all the files required to connect to the Key Store.
Perform the following steps to edit the configuration file.
a. Click the Edit icon next to the configuration file.
The Edit Key Store File screen appears.b. Update the path of the required configuration parameters to match the path displayed in the Key Store installation path field.
c. Click Save.
The Edit Key Store File screen closes.Click Save.
The Key Store saved successfully message appears.Click Test to test the Key Store connection.
The Test Key Store Connection dialog box appears.Click OK to close the Test Key Store Connection dialog box.
Click Set As Active to activate the Key Store.
Note: If you are using the Thales DPOD HSM on an external network, then the policy management services might have a longer start-up time due to network latency.
5.6.5 - Configuring the ESA with AWS Key Management System (KMS)
Verifying the Prerequisites
Ensure that the following prerequisites are met before configuring the ESA with the AWS Key Store.
Authorization
The Amazon Web Services Key Management Service (AWS KMS) allows you to enable the creation of the data encryption key (DEK). Additionally, you can also encrypt and decrypt the data, and generate random bytes of data using the Key Management Gateway (KMGW) in the ESA.
To use the AWS KMS as a key store, the following permissions are required by the AWS user or role:
Table: Permissions for accessing AWS KMS user or role
| Actions | Permissions | Description |
|---|---|---|
| Decrypt | kms:Decrypt | Enable decryption using a key. |
| Encrypt | kms:Encrypt | Enable encryption using a key. |
| TagResource | kms:TagResource | Enable the possibility to tag a resource. |
| GenerateRandom | kms:GenerateRandom | Grant permission to generate random bytes. |
| DescribeKey | kms:DescribeKey | Grant permission to view information about a key. |
| CreateKey | kms:CreateKey | Grant permission to create a new key. |
| List MasterKeys | tag:GetResources | List all the masterkeys. |
Authentication
Authentication methods depend on if using AWS or On Premise.
On AWS
If the ESA EC2 instance is running on the AWS and an IAM role is setup, then the IAM role gets linked to the ESA EC2 instance. Further, the SDK automatically gets the credentials to perform authenticated calls to the AWS.
On Premise
If the ESA is running on any other environment, then ensure to set up the environment by generating the long-term credentials on the AWS. The following environment variables are used to set the long-term credentials:
Table: List of Environments Variables to set the long-term credentials
| Environment Variables | Values | Description |
|---|---|---|
| AWS_REGION* | us-east-1 | The AWS region to use. |
| AWS_ACCESS_KEY_ID* | AKI… | AWS Access key ID, which is the long-term credential. |
| AWS_SECRET_ACCESS_KEY* | wJalrXUt…CYEXAMPLEKEY | AWS Secret access key, which is the long-term credentials |
Note: Ensure that the environments marked with * are set when they are not running on the EC2 instance.
Configuring Connection with AWS KMS with the AWS Customer Managed Keys
The Key Store with the AWS customer managed keys is configured by using one of the following methods:
- Setting the environment variables.
- Using the roles that are set in the AWS KMS environment.
Configuring the AWS Key Store using the Environment Variables
To configure connection with AWS KMS using the environment variables:
On the ESA Web UI, navigate to Key Management > Key Stores.
The Key Stores screen appears.
Click New Key Store.
The Create New Key Store screen appears.
In the Key Store Information section, enter the following details.
- Name: Type a unique name for AWS KMS. For example, type AWS_KMS. The name that you type will update the Key Store installation path field.
- Type: Select AWS KMS.
In the Key Store files and environment variables > Key Store environment variables section, click Add environment variable.
The Add Key Store environment variable dialog box appears.Enter the following details, and then click Save:
- Environment variable name: Specify the environment variable name for the AWS KMS. For example, specify the following entries:
- AWS_ACCESS_KEY_ID
- AWS_SECRET_ACCESS_KEY
- AWS_REGION
- Environment variable value: Specify the value for the corresponding environment variable.
If you want to mask the value of the variable in the UI, then click the Sensitive toggle to the on position. This ensures that the variable value is hidden while typing and is replaced with asterisks of a fixed-length in the list of environment variables.
- Environment variable name: Specify the environment variable name for the AWS KMS. For example, specify the following entries:
Click Save.
The Key Store saved successfully message appears.Click Test to test the Key Store connection.
The Test Key Store Connection dialog box appears.Click OK to close the Test Key Store Connection dialog box.
Click Set As Active to activate the Key Store.
The AWS Key Store is set as active.
Note: You should verify that the master key is generated by the AWS Key Store.
Configuring the AWS Key Store using the Authorized IAM Role
Before you begin: Ensure that an ESA instance is created in the AWS.
To configure the AWS Key Store by using the authorized IAM role:
In the AWS screen, navigate to AWS > EC2.
Select the required instance.
Navigate to Actions > Security > Modify IAM.
Select the role with the AWS KMS permissions.
The IAM role is modified for the instance.
On the ESA Web UI, navigate to Key Management > Key Stores.
The Key Stores screen appears.
Click New Key Store.
The Create New Key Store screen appears.
In the Key Store Information section, enter the following details.
- Name: Type a unique name for AWS KMS. For example, type AWS_KMS.
- Type: Select AWS KMS.
Click Save.
The Key Store saved successfully message appears.Click Test to test the Key Store connection.
The Test Key Store Connection dialog box appears.Click OK to close the Test Key Store Connection dialog box.
Click Set As Active to activate the Key Store.
The AWS Key Store is set as active.
Note: You should verify that the master key is generated by the AWS Key Store.
Keys in AWS KMS
The AWS KMS keys are tagged with the following two tags:
- Owner: Protegrity
- Service: KMGW
These tags are used to search or filter keys which are created by the KMGW.
5.6.6 - Configuring the ESA with Google Cloud KMS
Verifying the Prerequisites
Ensure that the following prerequisites are met before configuring the ESA with the Google Cloud KMS.
Authorization
The resources are organized into a hierarchy in the GCP Key Store. This hierarchy helps to manage and grant access to the resources at various levels of granularity. The scope of the role depends on the level of the resource hierarchy, where the role is granted to access the Google Cloud resources.
The user or service account attached to the ESA requires the following permissions:
Table: Permissions for accessing Google Cloud KMS
| Permissions | Description |
|---|---|
| cloudkms.cryptoKeyVersions.useToEncrypt | Enable encryption using a key. |
| cloudkms.cryptoKeyVersions.useToDecrypt | Enable decryption using a key. |
| cloudkms.locations.generateRandomBytes | Enable access to generate random bytes. |
| cloudkms.cryptoKeys.create | Enable creation of keys in the Key ring. |
| cloudkms.locations.get | Enable requesting information about the configured location. |
| cloudkms.cryptoKeyVersions.destroy | Enable destruction of keys in the Key ring. |
| cloudkms.cryptoKeys.get | Enable access for fetching info about a specific key. |
| cloudkms.cryptoKeys.list | Enable access for fetching all keys in a Key ring. |
| resourcemanager.projects.get | Enables the role access to handle a project. |
Creating a Key Ring
The Enterprise Security Administrator (ESA) appliances needs a Key ring to store Key Encryption Keys (KEK).
Navigate to the Key Management screen in the Google Cloud console.
Click Create key ring.
In the Key ring name field, enter the required name for the key ring.
From the Key ring location drop-down list, select a location.
Note: The Key ring must be created in a location where Hardware Security Module (HSM) support is enabled. For more information on supported locations refer to https://cloud.google.com/kms/docs/locations.
Click Create. Key rings are created for the selected region.
Configuring Connection with Google Cloud KMS
To configure a connection with Google Cloud KMS:
On the ESA Web UI, navigate to Key Management > Key Stores.
The Key Stores screen appears.
Click New Key Store.
The Create New Key Store screen appears.
In the Key Store Information section, enter the following details.
- Name: Type a unique name for Google Cloud KMS. For example, Google_Cloud_KMS. The name that you type will update the Key Store installation path field.
- Type: Select Google Cloud KMS.
In the Google Cloud KMS details section, enter the following details:
- Project
- Key Ring
- Location
In the Key Store files and environment variables > Key Store environment variables section, click Add environment variable.
The Add Key Store environment variable dialog box appears.Enter the following details, and then click Save:
- Environment variable name: Specify the environment variable name for the Google Cloud KMS. For example, specify GOOGLE_APPLICATION_CREDENTIALS.
- Environment variable value: Specify the value for the corresponding environment variable. For example, specify /opt/protegrity/keystore/Google_Cloud_KMS/credentials.json.
If you want to mask the value of the variable in the UI, then click the Sensitive toggle to the on position. This ensures that the variable value is hidden while typing and is replaced with asterisks of a fixed-length in the list of environment variables.
In the Key Store files and environment variables > Key Store files section, click Add File.
The Add Key Store File dialog box appears.Enter the following details.
File Type File Other Select the Application Credentials JSON file for the Google Cloud KMS from your local machine. Click Add File to add the file to the Key Store files section.
Click Save.
The Key Store saved successfully message appears.Click Test to test the Key Store connection.
The Test Key Store Connection dialog box appears.Click OK to close the Test Key Store Connection dialog box.
Click Set As Active to activate the Key Store.
The Google Cloud KMS is set as active.
Note: You should verify that the master key is generated by the Google Cloud KMS.
Viewing Keys under the Key Ring
After activating the Google Cloud KMS, a new Master Key is created under the configured key ring.
To view keys under the Key Ring:
Navigate to the GCP Console > Key management > Key_ring_name > Keys.
Verify that the master key UID and key under the Key ring location is the same.
Note: The keys in the Key ring must not be rotated on GCP, as the ESA will not register it. Also, when a key is rotated on the ESA, a new key will be created in the Key ring and it will not create a new version of the key in GCP.
5.6.7 - Configuring the ESA with Azure Key Vault Managed HSM
Verifying the Prerequisites
Ensure that the following prerequisites are met before configuring the ESA with the Azure Key Vault Managed HSM.
Configuring the Managed HSM
Protegrity supports the Managed HSM Key Vault type due to the presence of Get Random Bytes functionality, which is not available in the standard Key Vault.
Ensure that the Azure Managed HSM is already set up and activated on your system.
For more information about setting up an Azure Managed HSM, refer to Quickstart: Provision and activate a Managed HSM using Azure CLI.
Authentication Components for Azure
You can choose one of the following authentication methods.
Service Principal
When you register a new application in Microsoft Entra ID, a Service Principal is automatically created. This Service Principal acts as the application identity within the Microsoft Entra tenant and controls access to resources based on the roles assigned to it.
Ensure that the Service Principal is created with access to the Key Vault. For more information about Service Principal using the CLI, refer to Create an Azure service principal with Azure CLI.
For more information about Service Principal using the Web UI, refer to Register a Microsoft Entra app and create a service principal.
When you create the Service Principal, the AZURE_CLIENT_SECRET and AZURE_CLIENT_ID values are generated.
The Service Principal is added to the Local RBAC of the Azure Managed HSM. The Service Principal is assigned the Managed HSM Crypto User role.
If you have the Azure CLI installed, then you can perform this operation with the help of the following command.
az keyvault role assignment create --hsm-name [NAME of key vault] --role "Managed HSM Crypto User" --assignee [ID of service principal] --scope /
System Managed Identity
Some Azure resources, such as virtual machines, allow you to enable a System Managed Identity directly on the resource. The System Managed Identity exists only as long as the underlying resource remains active. The name of the System Managed Identity is the same as the Azure resource it’s created for.
For more information about enabling the system managed identity, refer to Managed identities for Azure resources documentation.
The System Managed Identity is added to the Local RBAC of the Azure Managed HSM. The System Managed Identity is assigned the Managed HSM Crypto User role.
If you have the Azure CLI installed, then you can perform this operation with help of the following command.
az keyvault role assignment create --hsm-name [NAME of key vault] --role "Managed HSM Crypto User" --assignee [ID of system managed identity] --scope /
Configuring Connection with Azure Key Vault Managed HSM
To configure connection with Azure Key Vault Managed HSM:
On the ESA Web UI, navigate to Key Management > Key Stores.
The Key Stores screen appears.
Click New Key Store.
The Create New Key Store screen appears.
In the Key Store Information section, enter the following details.
- Name: Type a unique name for Azure KMS. For example, Azure_KMS. The name that you type will update the Key Store installation path field.
- Type: Select Azure Key Vault Managed HSM.
In the Azure Key Vault Managed HSM details section, specify the URI of the Azure Vault in the Azure Vault URI field.
For example, specifyhttps://<Vault_Name>.managedhsm.azure.netas the URI.In the Key Store files and environment variables > Key Store environment variables section, click Add environment variable.
The Add Key Store environment variable dialog box appears.Enter the following details, and then click Save:
- Environment variable name: Specify the environment variable name for the Azure KMS. For example, specify the following entries:
- AZURE_TENANT_ID
- AZURE_SUBSCRIPTION_ID
- AZURE_CLIENT_ID
- AZURE_CLIENT_SECRET
- Environment variable value: Specify the value for the corresponding environment variable.
If you want to mask the value of the variable in the UI, then click the Sensitive toggle to the on position. This ensures that the variable value is hidden while typing and is replaced with asterisks of a fixed-length in the list of environment variables.
- Environment variable name: Specify the environment variable name for the Azure KMS. For example, specify the following entries:
Click Save.
The Key Store saved successfully message appears.Click Test to test the Key Store connection.
The Test Key Store Connection dialog box appears.Click OK to close the Test Key Store Connection dialog box.
Click Set As Active to activate the Key Store.
The Azure Key Store is activated successfully.
Verify that the master key is generated successfully by the Azure Key Store by navigating to Key Management > Master Keys.
5.6.8 - Switching Key Stores
Verify individual vendor’s requirement
When using a Key Store (HSM) provided by a specific vendor, consult the vendor to ensure that the infrastructure in place can handle any issues with the Key Store. Issues can include data loss or breakdowns. With the required measures in place, minimal impact to the business critical data and the involved processes can be ensured. Ensure that you follow the best practices specified by the vendor for business continuity.
Before you begin
If you are switching between Key Stores, then ensure that you take a backup of the policy management-related data.
For more information about backup and restore of Policy Management, refer to the section Working with Backup and restore.
If you encounter failures when working with the new Key Store, then you can switch to the previous Key Store by following the guidelines specified by the corresponding vendor.
Note: It is recommended that before switching to a Key Store, you test it.
To switch Key Stores:
On the ESA Web UI, navigate to Key Management > Key Stores.
The Key Stores screen appears.
In the Action column, click Set As Active next to the Key Store that you want to activate.
The corresponding Key Store is activated. For an active Key Store, the Set As Active button is grayed out.To verify that the Key Store has been activated, navigate to Key Management > Master Keys.
In the Current key info section, the Generated By field displays the name of the Key Store that has generated the Master Key.
5.6.9 - Troubleshooting
The following section provides information about errors that are related to HSM integration with the ESA and the steps to resolve the errors.
Known Error or Problem: When you try to switch to an HSM, the switch fails.
This may happen because:
The HSM does not support or allow the type of key that is used.
Recovery:
Verify that the HSM supports creating secret keys with the following attributes:
- CKA_PRIVATE: TRUE
- CKA_SENSITIVE: TRUE
- CKA_EXTRACTABLE: FALSE
- CKA_ENCRYPT: TRUE
- CKA_DECRYPT: TRUE
- CKA_MODIFIABLE: FALSE
- CKA_WRAP: TRUE
- CKA_UNWRAP: TRUE
- CKA_DERIVE: FALSE
- CKA_SIGN: FALSE
- CKA_VERIFY: FALSE
Known Error or Problem: In a TAC, the source ESA is configured with the Key Store and the target ESA is configured with the Protegrity Soft HSM. Export the policy management settings from the source ESA to the target ESA with the Backup Policy-Management for Trusted Appliances Cluster without Key Store option selected. The HubController service on the target ESA stops with the following error:
[SEVERE ] Failed to start HubController [Caused by: Failed to start Key verticle: Failed to decrypt key: "..."Recovery:
The following steps must be performed on the target ESA to address this issue.
- On the target ESA, configure the Key Store with the same name as that of the Key Store on the source ESA.
- Enter the same user pin that you have specified for the Key Store in the source ESA.
- Test the Key Store connection.
Known Error or Problem: When you log in to the ESA instance in either AWS or GCP, the following error appears.
WARNING: Failed to find a usable hardware address from the network interfaces; using random bytes: 1b:1f:ff:64:9b:b6:ea:ceThis may happen because:
The licenses generated are not locked to the MAC address of the ESA machine.
Recovery:
You must contact Protegrity support to generate a license file that is linked to the MAC address of the ESA machine.
Known Error or Problem: The changed HSM PIN does not match the Key Store PIN on the primary ESA. In this case, restarting the HubController on the primary ESA may lead to one of the following issues:
- A broken connection with the secondary ESA.
- The secondary ESA being restored without the Key Store.
This may happen because:
If you change the PIN of the HSM but not on the primary ESA and then restart the HubController on the primary ESA.
Recovery:
Update the Key Store PIN on the primary ESA to match the one on the HSM, if you can access the Key Store. If the Key Store or Policy Management is inaccessible, then contact Protegrity Support.
Important: Do not restart or stop the HubController while updating the Key Store PIN on the primary ESA to match the one on the HSM.
For more information about this recovery method, contact Protegrity Support.Known Error or Problem: Key Store connection fails. This error can be identified when one of the following scenario occurs:
- Key rotation, data store creation, or encryption key creation fails.
- Key store test connection displays an error.
This may happen because:
- Credentials are changed or expired.
- Certificates are changed or expired.
- The ESA time is not synchronized with the NTP server. For more information about synchronizing the ESA time with the NTP server, refer to the section Setting Date and Time.
Recovery:
Do not restart the HubController on the ESA. Instead, perform the following steps:
- Test the Key Store connection. Review the error message for guidance.
- Check the HubController and the Key Management Gateway (KMGW) logs in the troubleshooting index in the Audit Store dashboard. For more information about the Audit Store dashboard, refer to the section Viewing the dashboards.
- Fix the issues based on the information available in the logs. Update any changed fields with accurate information.
- Retest the Key Store connection after making the changes.
- If the issues persist, contact Protegrity Support.
Known Error or Problem: When you configure an HSM on the primary ESA and do not import the Key Store configuration to the secondary ESA, the HubController service cannot be started on the secondary ESA.
This may happen because:
You set up the secondary node via the Trusted Appliance Cluster (TAC), or performed a backup and restore of the primary ESA on the ESA Web UI by selecting Backup and Restore > Backup Policy-Management for Trusted Appliances Cluster without Key Store. You then ran the task from the Task Scheduler on the primary ESA to restore the backed up files on the secondary ESA.
For more information about TAC Replication of HSM, refer to TAC Replication of Key Store-specific Files and Certificates.Recovery:
The following steps must be performed on the target ESA to address this issue.
- On the target ESA, configure the Key Store with the same name as that of the Key Store on the primary ESA.
- Enter the same user pin that you have specified for the Key Store in the primary ESA.
- Test the Key Store connection.
5.6.10 - TAC Replication of Key Store-specific Files and Certificates
A Trusted Appliances cluster (TAC) is a tool, where appliances such as the ESA replicate and maintain information. A trusted channel is created to transfer data between the appliances in a cluster. This section describes the steps that must be followed for replication of the Key Store-specific files and certificates in a TAC. In addition, it also explains the measures you must take while performing a replication without the Key Store files and certificates.
For more information about TAC, refer to the section Trusted Appliances Cluster (TAC).
A Key Store can be configured to accept either of the following:
- Same certificate from all the clients. In this scenario, select the Backup Policy-Management for Trusted Appliances Cluster option from the System > Backup & Restore > Export screen.
- Client-specific certificates. In this case, the TAC replication must not include Key Store files and certificates. In addition, all the nodes in the cluster must be configured to connect to the same Key Store host and Key Store slot. In this scenario, select the Backup Policy-Management for Trusted Appliances Cluster without Key Store option from the System > Backup & Restore > Export screen.
Replicating the Key Store-specific Files and Certificates in a TAC
This section explains the steps that must be followed to ensure replication of the Key Store files and certificates in a Trusted Appliances Cluster (TAC).
On the source ESA, switch from Protegrity Soft HSM to Key Store.
For more information about switching from Protegrity Soft HSM to Key Store, refer to section Switching Key Stores.Create a TAC between the source and the target ESA.
For more information about creating a TAC, refer to the section Trusted Appliances Cluster (TAC).On the source ESA, navigate to the ESA Web UI > System > Backup & Restore.
Select Cluster Export.
Select Backup Policy-Management for Trusted Appliances Cluster.
This option exports the policy management configurations and data from the source ESA to a specific target ESA node in a Trusted Appliances Cluster. The data includes the Key Store specific files and certificates.
Excluding the Key Store-specific Files and Certificates in a TAC Replication
This section explains the measures you must take while performing a TAC replication without the Key Store files and certificates.
Caution: This section must be followed only when you have a Key Store configured with client-specific certificates on the target ESA nodes, but the Key Store is not in Active state.
If you are using the Backup Policy-Management Trusted Appliances Cluster option by navigating to the ESA Web UI > System > Backup & Restore, then the TAC replication process replaces the Key Store specific files and certificates on the target ESA with the files and certificates from the source ESA. If you want to retain client-specific Key Store files and certificates on the target ESA during TAC replication, then ensure that you select the Backup Policy-Management for Trusted Appliances Cluster without Key Store option.
The following steps must be performed to ensure that the initial TAC replication setup is completed successfully with the client-specific Key Store files and certificates for the source ESA and the target ESA.
On the source ESA, switch from Protegrity Soft HSM to Key Store.
For more information about switching from Protegrity Soft HSM to Key Store, refer to section Switching Key Stores.On the target ESA, configure the Key Store with the same name as that of the Key Store on the source ESA.
Important: Do not activate the Key Store on the target ESA.
Create a TAC between the source and the target ESA.
For more information about creating a TAC, refer to the section Trusted Appliances Cluster (TAC).On the source ESA, navigate to the ESA Web UI > System > Backup & Restore.
Select Cluster Export.
Select Backup Policy-Management for Trusted Appliances Cluster without Key Store.
This option exports the policy management configurations and data excluding the Key Store files and certificates to a specific cluster node in a Trusted Appliances Cluster.
6 - Certificate Management
6.1 - Certificates in the ESA
Digital certificates are used to encrypt online communication and authentication between two entities. For two entities exchanging sensitive information, the one that initiates the request for exchange can be called the client. The one that receives the request and constitutes the other entity can be called the server.
The authentication of both the client and the server involves the use of digital certificates issued by the trusted Certificate Authorities (CAs). The client authenticates itself to a server using its client certificate. Similarly, the server also authenticates itself to the client using the server certificate. Thus, certificate-based communication and authentication involves a client certificate, server certificate, and a certifying authority that authenticates the client and server certificates.
Protegrity client and server certificates are self-signed by Protegrity. However, you can replace them by certificates signed by a trusted and commercial CA. These certificates are used for communication between various components in ESA.
The certificate support in Protegrity involves the following:
The ability to replace the self-signed Protegrity certificates with CA based certificates.
For more information about replacing the self-signed Protegrity certificates with CA based certificates, refer to the section Changing Certificates.
The retrieval of username from client certificates for authentication of user information during policy enforcement.
The ability to download the server’s CA certificate and upload it to a certificate trust store to trust the server certificate for communication with ESA.
Points to remember when uploading the certificates:
ESA supports the upload of certificates with strength equal to 4096 bits.
Certificates with strength equal to 2048 bits and above are allowed with a warning.
Certificates with strength less than 2048 bits are blocked.
Custom certificates for Insight must be generated using a 4096 bit key.
When uploading, make sure the certificate version is v3. Uploading certificates with version lower than v3 is not supported.
When uploading, make sure that the certificate uses the RSA Keys. Certificates with other keys are not supported.
The various components within the Protegrity Data Security Platform that communicate with and authenticate each other through digital certificates are:
- ESA and ESA Web UI (browser)
- ESA and Protectors
- Protegrity Appliances and external REST clients

As illustrated in the figure, the use of certificates within the Protegrity systems involves the following:
Communication between ESA Web UI (browser) and ESA
In case of a communication between the browser and ESA, ESA provides its server certificate to the browser. In this case, it is only server authentication that takes place in which the browser ensures that ESA is the trusted server.
Communication between ESA and protectors
In case of a communication between ESA and protectors, certificates are used to mutually authenticate both the entities. The server and the client i.e. ESA and the protector respectively ensure that both are trusted entities. The protectors could be hosted on customer business systems or it could be a Protegrity Appliance.
Communication between Protegrity Appliances and external REST clients
Certificates ensure the secure communication between the customer client and Protegrity REST server or between the customer client and the customer REST server.
6.2 - Certificate Requirements
The following table outlines the certificate requirements for various components within the ESA infrastructure:
| S.No. | Certificate | CN | SAN | Cert Type | Comments |
| 1 | CA | As per industry standards | NA | CA | NA |
| 2 | ESA Management – Server | FQDN of ESA where it is applied | Hostname and FQDN of ESA where it is applied | Server | Each ESA would have its own unique server certificate. |
| 3 | ESA Management – Client | Protegrity Client | NA | Client | Each ESA would have its own unique client certificate. |
| 4 | Consul Server | server.<datacenter name>.<domain> | 127.0.0.1 Hostname and FQDN of ESA where it is applied | Server | Each ESA would have its own unique server certificate. The
domain and datacenter name must be equal to the value mentioned in
the config.json file.For example, server.ptydatacenter.protegrity.Skip this certificate, consul is uninstalled, and traditional TAC is
being used. |
| 5 | Audit Store – Server | insights_cluster | Hostname and FQDN of all the ESAs in the Audit Store Cluster | Server | All the ESAs in the Audit Store Cluster should share the same certificate. |
| 6 | Audit Store – Client | es_security_admin | NA | Client | All the ESAs in the Audit Store Cluster should share the same certificate. |
| 7 | Audit Store REST – Server | Use same certificate created in entry 5 | Use same certificate created in entry 5 | Server | All the ESAs in the Audit Store Cluster should share the same certificate. |
| 8 | Audit Store REST – Client | es_admin | NA | Client | All the ESAs in the Audit Store Cluster should share the same certificate. |
| 9 | Audit Store PLUG – Client | plug | NA | Client | All the ESAs in the Audit Store Cluster should share the same certificate. |
| 10 | Audit Store Analytics – Client | insight_analytics | NA | Client | All the ESAs in the Audit Store Cluster should share the same certificate. |
| 11 | DSG Management-Server | FQDN of DSG where it is applied | Hostname and FQDN of DSG where it is applied | Server | Each DSG would have its own unique server certificate. |
| 12 | DSG Admin Tunnel – Server Certificate | FQDN of DSG where it is applied | Hostname and FQDN of DSG where it is applied | Server | Each DSG would have its own unique server certificate. |
| 13 | DSG Tunnel – Client Certificate | ProtegrityClient | NA | Client | CN value is configurable in
gateway.json |
6.3 - Certificate Management in ESA
When ESA is installed, it generates default self-signed certificates in X.509 v3 PEM format. These certificates are:
- CA Certificate – This consists of the CA.pem and CA.key file.
- Server Certificate - This consists of the server.pem and server.key file.
- Client Certificate - This consists of the client.pem and client.key file.
The services that use and manage these certificates are:
- Management – It is the service which manages certificate based communication and authentication between ESA and its internal components like LDAP, Appliance queue, protectors, etc.
- Web Services – It is the service which manages certificate based communication and authentication between ESA and external clients (REST).
- Consul – It is the service that manages certificates between the Consul server and the Consul client.
ESA provides a certificate manager where you can manage the default certificates and also upload your own CA-signed certificates. This manager comprises of two components which are as follows:
- Certificate Repository
- Manage Certificates
Note: When creating a CA-signed client certificate which you want use in ESA, it is mandatory that you keep the CN attribute of the client certificate to be “Protegrity Client".
If there are CA cross-sign certificates with the AddTrust legacy, then you must upload the active intermediate certificates from the Manage Certificates page. If the expired certificates are present in the certificate chain, then it might lead to failures.
For more information about upload the updated certificates, refer to the section Changing Certificates.
For more information about the CA cross-sign certificates with the AddTrust legacy, refer to https://support.sectigo.com/articles/Knowledge/Sectigo-AddTrust-External-CA-Root-Expiring-May-30-2020.
If other attributes, such as email address or name, are appended to the CN attribute, then you perform the following steps to set the CN attribute to Protegrity Client.
For example, if the CN attribute is set as Protegrity Client/emailAddress=user@abc.com, then the attributes appended after the / delimiter must be removed.
In the ESA Web UI, click the Terminal Icon in lower right corner to navigate to the ESA CLI Manager.
In the ESA CLI Manager, navigate to Administration > OS Console
Open the pty_get_username_from_certificate.py file using a text editor.
/etc/ksa/pty_get_username_from_certificate.pyComment the line containing the CN attribute and enter the following regular expression:
REG_EX_GET_VAL_AFTER_CN = "CN=(.*?)\/"Save the changes.
Navigate to Administration > Services
Restart the Service Dispatcher service.
6.3.1 - Certificate Repository
A Certificate Revocation List (CRL) is a list containing entries of digital certificates that are no longer trusted as they are revoked by the issuing Certificate Authority (CA). The digital certificates can be revoked for one of the following possible reasons:
- The certificate is expired.
- The certificate is compromised.
- The certificate is lost.
- The certificate is breached.
CRLs are used to avoid the usage of certificates that are revoked and are used at various endpoints including the web browsers. When a browser makes a connection to a site, the identity of the site owner is checked using the server’s digital certificate. Also, the validity of the digital certificate is verified by checking whether the digital certificate is not listed in the Certificate Revocation List. If the certificate entry is present in this list, then the authentication for that revoked certificate fails.
The Certificate Repository screen is accessible from the ESA Web UI, navigate to Settings > Network > Certificate Repository. The following figure and table provides the details about the Certificate Repository screen.

| Callout | Action | Description |
|---|---|---|
| 1 | ID | ESA generated ID for the certificate and key file. |
| 2 | Type | Specifies the type of the file i.e. certificate, key, or CRL. |
| 3 | Archive time | It is the timestamp when the certificate was uploaded to the certificate repository. |
| 4 | Status | This column shows the status of the certificate in the Certificate Repository, which can be:
|
| 5 | Description | Displays the description given by the user when the certificate is uploaded to Certificate Repository. It is recommended to provide a meaningful description while uploading a certificate. |
| 6 | Allows you to delete multiple selected certificates or CRLs from the Certificate Repository. Note: Only expired certificates or CRLs can be deleted. | |
| 7 |  Information Information | Provides additional information or details about a certificate and its private key (if uploaded). |
| 8 | Allows you to delete the certificate or CRL from the Certificate Repository. Note: Only expired certificates or CRLs can be deleted. |
6.3.2 - Uploading Certificates
To upload certificates:
On the ESA Web UI, navigate to Settings > Network > Certificate Repository.

Click Upload New Files.
The Upload new file to repository dialog box appears.

Click Certificate/Key to upload a certificate file and a private key file.
CAUTION: Certificates have a public and private key. The public key is mentioned in the certificate and as a best practice the private key is maintained as a separate file. In ESA, you can upload either the certificate file or both certificate and private key file together. In ESA Certificate Repository, it is mandatory to upload the certificate file.
CAUTION: If the private key file is inside the certificate, then you have the option to upload just the Certificate file. The DSKs are identified using the UID column that displays the Key Id.
> **Note:** It is recommended to use private key with a length of 4096-bit.
Click Choose File to select both certificate and key files.
Enter the required description in the Description text box.
Click Upload.
CAUTION: If the private key is encrypted, a prompt to enter the passphrase will be displayed.
The certificate and the key file is saved in repository and the Certificate Repository screen is updated with the details.
When you upload a private key that is protected with a passphrase, the key and the passphrase are stored in the hard disk. The passphrase is stored in an encrypted form using a secure algorithm. The passphrase and the private key are also stored in the system memory. The services, such as Apache, RabbitMQ, or LDAP, access this system memory to load the certificates.
If you upload a private key that does not have a passphrase, the key is stored in the system memory. The services, such as Apache, RabbitMQ, or LDAP access the system memory to load the certificates.
If you are using a proxy server to connect to the Internet, ensure that you upload the required custom certificates of that server in ESA from the Certificate Repository screen.
6.3.3 - Uploading Certificate Revocation List
Creating a CRL - An Example
To create a CRL:
In the CLI Manager, navigate to Administration > OS Console.
Run the following command to revoke a client certificate:
openssl ca -config demoCA/newcerts/openssl.cnf -revoke Client.crt -keyfile CA.key -cert CA.crtRun the following command to generate a CRL:
openssl ca -config demoCA/newcerts/openssl.cnf -gencrl -keyfile CA.key -cert CA.crt -out Client.crl
Uploading the CRL
To upload CRL:
On the ESA Web UI, navigate to Settings > Network > Certificate Repository .
Click Upload New Files.
The Upload new file to repository dialog box appears.
Click Certificate Revocation List to upload a CRL file.

Click Choose File to select a CRL file.
Enter the required description in the Description text box.
Click Upload.
A confirmation message appears and the CRL is uploaded to the ESA.
6.3.4 - Manage Certificates
On the ESA Web UI, navigate to Settings > Network > Manage Certificates.
The following figure and table provides the actions available from the Manage Certificates screen.

| Callout | Action | Description |
|---|---|---|
| 1 | Hover over the Help icon | Gives information about Management and Web Services groups. |
| 2 | Download server’s CA certificate | Download the server’s CA certificate. You can download only the server’s CA certificate and upload it to another certificate trust store to trust the server certificate for communication with ESA. |
| 3 | Hover over the icon | Gives additional information or details about a certificate. |
6.3.5 - Changing Certificates
To change certificates:
On the ESA Web UI, navigate to Settings > Network > Manage Certificates.

Click Change Certificates.
The Certificate Management wizard appears with CA certificate(s) section.
Select the check box next to the CA Certificate that you want to set as active.
CAUTION: This section shows server, client, and CA certificates together. However, ensure that you select only the required certificates in their respective screens. You can select multiple CA certificates for ESA Management and Web Services section. ESA allows you to have only one server and one client active at any given time.

Click Next.
The Server Certificate section appears.
Select the check box next to the Server Certificate that you want to set as active.

Click Next.
The Client Certificate section appears
Select the check box next to the Client Certificate that you want to set as active.

Click Apply.
The following message appears:
The system Management Certificates will be changed and a re-login maybe required. Do you want to continue?Click Yes.
A confirmation message appears and the active certificates are displayed on the screen.
CAUTION: When you upload a server certificate to the ESA and activate it, you are logged out of the ESA Web UI. This happens because the browser does not trust the new CA signed server certificate. You must login again for the browser to get the new server certificate and to use it for all further communications.
6.3.6 - Changing CRL
To change CRL:
On the ESA Web UI, navigate to Settings > Network > Manage Certificates.
Click Revocation List.
The Certificate Revocation List dialog box appears.
Select the Enable Certificate Revocation List check box.
Select the check box next to the CRL file that you want to set as active.

Click Apply.
A confirmation message appears.
6.4 - Certificates in DSG
During the install process of DSG, a series of self-signed SSL Certificates are generated. You may use it in a non-production environment. It is recommended to use your own certificate for production use.
When you install a DSG node, the following types of certificates and keys are generated:
- CA certificate –This consists of CA.pem, CA.crt, and CA.key file.
- Server Certificate - This consists ofservice.pem, service.crt, and service.key file.
- Client Certificate - This consists of client.pem, client.crt, and client.key file.
- Admin Certificate – This consists of admin.pem, admin.crt and admin.key.
- Admin Client Certificate - This consists of admin_client.crt and admin_client.key.
The certificates in DSG are classified as Inbound Certificates and Outbound Certificates. You must use Inbound certificates for secure communication between client and DSG. In setups, such as Software as a Service (SaaS), where DSG communicates with a SaaS that is not part of the on-premise setup or governed by an enterprise networking perimeter, Outbound certificates are employed.
The following image illustrates the flow of certificates in DSG.

Based on the protocol used the certificates that client must present to DSG and DSG must present to destination differ. For the Figure, consider HTTPS protocol is used.
- Step 1:
- When a client tries to access the SaaS through the DSG, DSG uses the certificate configured as part of tunnel configuration to communicate with the client. The client must trust the certificate to initiate the communication between client and DSG.
- Step 2:
- The step 2 involves DSG forwarding the request to the destination. In the TLS-based outbound communication in DSG, it is expected that the destination uses a certificate that is signed by a trusted certification authority. For example, in case of SaaS, it might use self-signed certificates. In this case, DSG must trust the server’s certificate to initiate TLS-based outbound communication.
- Step 3:
- When the REST API client tries to communicate with the DSG, DSG uses the certificate configured as part of tunnel configuration to communicate with the client. The client browser must accept and trust the certificate to initiate the communication.
Inbound Certificates
The inbound certificate differs based on the protocol that is used to communicate with the DSG. This section covers certificates involved when using HTTPS using default certificates, TLS mutual authentication, and SFTP protocols.
HTTPS using default certificates
Consider a setup where a client is accessing the destination with DSG in between using the HTTPS protocol. In this case, DSG uses the certificate configured as part of tunnel configuration to communicate with the client.
In non-production environment, you can continue to use the default certificates that are generated when DSG is installed. In case of production deployment, it is recommended that you use your own certificates that are signed by a trusted certification authority.
In case you are using own certificates and keys, ensure that you replace the default CA certificates /keys and other certificates/keys with the signed certificates/keys.
TLS Mutual Authentication
DSG can be configured with trusted root CAs and/or the individual client machine certificates for the machines that will be allowed to connect to DSG. The client presents a client certificate to DSG, DSG verifies it against the CA certificate, and once validated, lets the client machine communicate with destination where DSG is in between.
Ensure that you replace the default CA certificates and keys and other certificates and keys with the signed certificates and keys.
Along with these certificates, every time a request is made to the DSG node, the client machine will present client certificate that was generated using the CA certificate. DSG validates the client certificate so that the client machine can communicate with DSG. The clients that fail to present a valid client certificate will not be able to connect to the destination.
Apart from presenting the certificate, at Tunnel level, ensure that the TLS Mutual Authentication is set to CERT_OPTIONAL or CERT_MANDATORY. Also, in the Extract rule at Ruleset level, ensure that the Require Client Certificate check box is selected if you want to perform this check at service level.
For more information about enabling TLS mutual authentication, refer to Enabling Mutual Authentication.
SFTP
DSG can be configured to work as an intermediary between an SFTP client and server when accessing files using SFTP protocol. With SFTP, credentials are never transmitted in clear and information flows over an SSH tunnel.
If you are using SFTP, ensure that the SFTP server key is uploaded using the Certificates screen on the DSG node. At tunnel level, for an SFTP tunnel, you must specify this server key.
At the rule level, you can add a layer of security using the authentication method option. Using DSG, an SFTP client can communicate with the destination using either Password or SSH keys. Ensure that the SSH keys are trusted.
If you select Password as the authentication method, client must provide the password when prompted. While, if you are using Publickey as the authentication method, the SFTP client must trust DSG publickey and DSG must trust SFTP client publickey.
For more information about SFTP rule level settings and enabling password-less authentication, refer to SFTP Gateway.
Outbound Certificates
The DSG can be used as an intermediary between client and destination. For example, in case of SaaS as destination, it is important that the self-signed certificates that a destination uses are trusted by DSG.
It might happen that the SaaS certificates are in DER format. DSG accepts certificates in PEM or CRT format, and hence you must convert the DER format to an acceptable PEM format.
For more information about trusting the self-signed certificates and converting the DER format to PEM format, refer to Creating a Service under Ruleset.
6.5 - Replicating Certificates in a Trusted Appliance Cluster
The following figure illustrates the replication of certificates between two ESAs in a TAC.

The figure depicts two ESAs in a TAC. The ESA1 contains the server and the client certificates. The certificates in ESA1 are signed by CA1. The Protectors communicate with ESA1 to retrieve the client certificate.
Note: The Subject attribute for the server certificates is CN=<hostname> and that of the client certificate is CN= Protegrity Client.
In a TAC, when replication between ESA1 and ESA2 happens, the CA, server, and client certificates from ESA1 are copied to ESA2. However, when the certificates are replicated from ESA1 to ESA2, the Subject attribute is not updated to the hostname of ESA2. Due to this mismatch, the protectors are not able to communicate with ESA2.
- Solution:
- To ensure the communication of protectors with the ESA, perform one the following methods:
- Use a Subject Alternative Name (SAN) certificate to add additional hostnames. You can configure multiple ESA domains using a SAN certificate.
- Use wildcard for domain names in certificates to add multiple domains.
6.6 - Insight Certificates
The default certificates provided are signed using the system-generated Protegrity-CA certificate. However, after installation custom certificates can be used. Ensure that all the certificates are signed by the same CA as shown in the following diagram.

Update the certificates in the following order:
- Audit Store Cluster certificate
- Audit Store REST certificate
- PLUG client certificate for Audit Store
- Analytics client certificate for Audit Store
The various certificates used for communication between the nodes with their descriptions are provided here. The passphrase for the certificates are stored in the /etc/ksa/certs directory.
Management & Web Services: These services manages certificate-based communication and authentication between the ESA and its internal components and between ESA and external clients (REST).
For more information about Management and Web Services certificates, refer to Certificates in the ESA.

Audit Store Cluster: This is used for the Insight inter-node communication that takes place over the port 9300. These certificates are stored in the /esa/ksa/certificates/as_cluster directory on the ESA.
Server certificate: The server certificate is used for for inter-node communication. The nodes identify each other using this certificate. The Audit Store Cluster and Audit Store REST server certificate must be the same.
Client certificate: The client certificate is used for applying and maintaining security configurations for the Audit Store cluster.

Audit Store REST: This is used for the Audit Store REST API communication over the port 9201. These certificates are stored in the /esa/ksa/certificates/as_rest directory on the ESA.
Server certificate: The server certificate is used for mutual authentication with the client. The Audit Store Cluster and Audit Store REST server certificate must be the same.
Client certificate:The client certificate is used by the Audit Store nodes to authenticate and communicate with the Audit Store.

Analytics Client for Audit Store: This is used for communication between Analytics and the Audit Store. These certificates are stored in the /esa/ksa/certificates/ian directory on the ESA.
Client certificate: The client certificate is used by Analytics to authenticate and communicate with the Audit Store.

PLUG Client for Audit Store: This is used for communication between Insight and the Audit Store. These certificates are stored in the /esa/ksa/certificates/plug directory on the ESA.
Client certificate: The client certificate is used by the Log Forwarder to authenticate and communicate with the Audit Store.

Using custom certificates in Insight
The certificates used for Insight are system-generated Protegrity certificates. If required, upload and use custom CA, Server, and Client certificates for Insight.
For custom certificates, ensure that the following prerequisites are met:
Ensure that all certificates share a common CA.
Ensure that the following requirements are met when creating the certificates:
The CN attribute of the Audit Store Server certificate is set to insights_cluster.
The CN attribute of the Audit Store Cluster Client certificate is set to es_security_admin.
The CN attribute of the Audit Store REST Client certificate is set to es_admin.
The CN attribute of the PLUG client certificate for the Audit Store is set to plug.
The CN attribute of the Analytics client certificate for the Audit Store is set to insight_analytics.
The Audit Store Server certificates’ must contain the following in the Subject Alternative Name (SAN) field:
- Required: FQDN of all the Audit Store nodes in the cluster
- Optional: IP addresses of all the Audit Store nodes in the cluster
- Optional: Hostname of all the Audit Store nodes in the cluster
For a DNS server, include the hostname and FQDN details from the DNS sever in the certificate.
Ensure that the certificates are generated using a 4096 bit key.
For example, an SSL certificate with the SAN extension of servers ESA_Server_1, ESA_Server_2, and ESA_Server_3 in a cluster will have the following entries:
- ESA_Server_1
- ESA_Server_2
- ESA_Server_3
- ESA_Server_1.protegrity.com
- ESA_Server_2.protegrity.com
- ESA_Server_3.protegrity.com
- IP address of ESA_Server_1
- IP address of ESA_Server_2
- IP address of ESA_Server_3
When upgrading from an earlier version to ESA 8.1.0.0 and later with custom certificates, run the following step after the upgrade is complete and custom certificates are applied for Insight, that is, td-agent, Audit Store, and Analytics, if installed.
From the ESA Web UI, navigate to System > Services > Audit Store.
Ensure that the Audit Store Repository service is not running. If the service is running, then stop the service using the stop (
 ) icon in the Actions column.
Configure the custom certificates and upload it to the Certificate Repository.
Set the custom certificates for the logging components as Active.
From the ESA Web UI, navigate to System > Services > Audit Store.
Start the Audit Store Repository service using the start (
 ) icon in the Actions column.
In the ESA Web UI, click the Terminal Icon in lower-right corner to navigate to the ESA CLI Manager.
Navigate to Tools.
Run Apply Audit Store Security Configs.
Continue the installation to create an Audit Store cluster or join an existing Audit Store cluster.
For more information about creating the Audit Store cluster, refer here.
6.7 - Validating Certificates
Verifying the validity of a certificate
You can verify a client or a server certificate using the following commands:
```

openssl verify -CAfile /etc/ksa/certificates/CA.pem /etc/ksa/certificates/client.pem
openssl verify -CAfile /etc/ksa/certificates/CA.pem /etc/ksa/certificates/ws/server.pem

```

If the client or server certificate is signed by the provided CA certificate, then the certificate is valid. The message **OK** appears.
Verifying the purpose of a certificate
You can verify if the certificate is a client, a server, or a CA certificate using the following command:
```
openssl x509 -in <Certificate name> -noout -purpose
```

For example, run the following command to verify the purpose of the client certificate:

```
openssl x509 -in /etc/ksa/certificates/client.pem -noout -purpose
```
Extracting the CN of a certificate
To extract the username of a certificate, you must pass the DN value to the pty_get_username_from_certificate function. The following steps explain how to extract the CN of a certificate.
In the CLI Manager, navigate to Administration > OS Console..
Run the following command to extract the value that is in the Subject attribute of the certificate.
openssl x509 -noout -subject -nameopt compat -in /etc/ksa/certificates/client.pemRun the following command to extract the username from the Subject attribute of the client certificate.
/etc/ksa/pty_get_username_from_certificate.py "<Value in the Subject attribute of the client certificate>"For example,
/etc/ksa/pty_get_username_from_certificate.py "/O=Acme Inc./C=US/CN=Protegrity Client"
The CN attribute in a certificate can contain the Fully Qualified Domain Name (FQDN) of the client or server. If the length of the FQDN is greater than 64 characters, the hostname is considered as CN to generate a certificate.
Working with intermediate CA certificates
A root certificate is a public key certificate that identifies the root CA. The chain of certificates that exist between the root certificate and the certificate issued to you are known as intermediate CA certificates. You can use an intermediate CA certificate to sign the client and server certificates.
If you have multiple intermediate CA certificates, then you must link all the intermediate certificates and the root CA certificates into a single chain before you upload to the Certificate repository.
The following figure illustrates an example of two intermediate certificates and a root certificate.

In the figure, the server certificate is signed by an intermediate certificate CA2. The intermediate certificate CA2 is signed by CA1, which is signed by the root CA.
You can merge the CA certificates using the following command in the OS Console:
cat ./CA2.pem ./CA1.pem ./rootCA.pem > ./newCA.pem
You must then upload the newCA.pem certificate to the Certificate Repository.
Ensure that you link the CA certificates in the appropriate hierarchy.
Increasing the Log Level to view errors for certificates:
If you want to view the errors and warnings generated for certificates, then you can increase the LogLevel attribute.
In the CLI Manager, navigate to Administration > OS Console.
View the apache.mng.conf file using a text editor.
/etc/ksa/service_dispatcher/servers/apache.mng.confUpdate the value of the LogLevel parameter from warn to debug and exit the editor.
View the apache.ws.conf file using a text editor.
/etc/ksa/service_dispatcher/servers/apache.ws.confUpdate the value of the LogLevel parameter from warn to debug.
Navigate to Administration > Services. The Service Management screen appears.
Restart the Service Dispatcher service.
Navigate to the /var/log/apache2-service_dispatcher directory.
Open the error.log file to view the required logs.
After debugging the errors, ensure that you revert the value of the LogLevel parameter to warn and restart the Service Dispatcher service.
7 - Protegrity REST APIs
The Protegrity REST APIs include the following APIs:
- Policy Management REST APIs The Policy Management REST APIs are used to create or manage policies. The policy management functions performed from the ESA Web UI can also be performed using the REST APIs.
- Encrypted Resilient Package APIs
The Encrypted Resilient Package REST APIs include the REST API that is used to encrypt and export a resilient package, which is used by the resilient protectors.
For more information on how the REST API is used to export the encrypted resilient package in an immutable policy deployment, refer to the section DevOps Approach for Application Protector.
7.1 - Accessing the Protegrity REST APIs
The following section lists the requirements for accessing the Protegrity REST APIs.
Available endpoints - Protegrity has enabled the following endpoints to access the REST APIs.
- Base URL
- https://{ESA IP address or Hostname}/pty/<Version>/<API>
Where:
- ESA IP address or Hostname: Specifies the IP address or Hostname of the ESA.
- Version: Specifies the version of the API.
- API: Endpoint of the REST API.
Authentication - You can access the REST APIs using basic authentication, client certificates, or tokens. The authentication depends on the type of REST API that you are using. For more information about accessing the REST APIs using these authentication mechanisms, refer to the section Accessing REST API Resources.
Authorization - You must assign the permissions to roles for accessing the REST APIs. For more information about the roles and permissions required, refer to the section Managing Roles.
7.2 - View the Protegrity REST API Specification Document
The steps mentioned in this section contains the usage of Docker containers and services to download and launch the images for Swagger Editor within a Docker container.
For more information about Docker, refer to the Docker documentation.
The following example uses Swagger Editor to view the REST API specification document.
Install and start the Swagger Editor.
Download the Swagger Editor image within a Docker container using the following command.
docker pull swaggerapi/swagger-editorLaunch the Docker container using the following command.
docker run -d -p 8888:8080 swaggerapi/swagger-editorPaste the following address on a browser window to access the Swagger Editor using the specified host port.
http://localhost:8888/Download the REST API specification document using the following command.
curl "https://<Appliance IP address or Hostname>/pty/<Version>/<API>/doc" -H "accept: application/x-yaml" --output <api-doc>.yamlDrag and drop the downloaded <api-doc>.yaml file into a browser window of the Swagger Editor.
Generating the REST API Samples Using the Swagger Editor
Perform the following steps to generate samples using the Swagger Editor.
Open the <api-doc>.yaml file in the Swagger Editor.
On the Swagger Editor UI, click on the required API request.
Click Try it out.
Enter the parameters for the API request.
Click Execute.
The generated Curl command and the URL for the request appears in the Responses section.
7.3 - Using the Common REST API Endpoints
The following section specifies the common operations that are applicable to all the Protegrity REST APIs.
The Base URL for each API will change depending on the version of the API being used. The following table specifies the version that you must use when executing the common operations for each API.
| REST API | Description | Version in the Base URL <Version> |
|---|---|---|
| pim | Policy Management | v2 |
| rps | Encrypted Resilient Package | v1 |
Common REST API Endpoints
The following table lists the common operations for the Protegrity REST APIs.
| REST API | Description |
|---|---|
| /version | Retrieves the service versions that are supported by the Protegrity REST APIs on the ESA. |
| /health | This API request retrieves the health information for the Protegrity REST APIs and identifies whether the corresponding service is running. |
| /doc | This API request retrieves the API specification document. |
| /log | This API request retrieves current log level set for the corresponding REST API logs. |
| /log | This API request changes the log level for the REST API service during run-time. The level set through this resource is persisted until the corresponding service is restarted. This log level overrides the log level defined in the configuration. |
Retrieving the Supported Service Versions
This API retrieves the service versions that are supported by the corresponding REST API service on the ESA.
- Base URL
- https://{ESA IP address}/pty/<Version>/<API>
- Path
- /version
- Method
- GET
CURL request syntax
curl -X GET "https://{ESA IP address}/pty/<Version>/<API>/version"
Authentication credentials
Not required.
Sample CURL request
curl -X GET "https://10.10.101.43/pty/v1/rps/version"
Sample CURL response
{"version":"1.8.1","buildVersion":"1.8.1-alpha+605.gfe6b1d.master"}
Retrieving the Service Health Information
This API request retrieves the health information of the REST API service and identifies whether the service is running.
- Base URL
- https://{ESA IP address}/pty/<Version>/<API>
- Path
- /health
- Method
- GET
CURL request syntax
curl -H "Authorization: Bearer <TOKEN>" -X GET "https://{ESA IP address}/pty/<Version>/<API>/health"
In this command, Token indicates the JWT token used for authenticating the API.
Alternatively, you can also store the JWT token in an environment variable named TOKEN, as shown in the following command.
curl -H "Authorization: Bearer ${TOKEN}" -X GET "https://{ESA IP address}/pty/<Version>/<API>/health"
Authentication credentials
TOKEN - Enviroment variable containing the JWT token.
For more information about creating a JWT token, refer to the section Generating JWT for REST APIs.
Sample CURL request
curl -H "Authorization: Bearer ${TOKEN}" -X GET "https://10.10.101.43/pty/v2/pim/health"
This sample request uses the JWT token authentication.
Sample CURL response
{
  "isHealthy" : true
}
Where,
- isHealthy: true - Indicates that the service is up and running.
- isHealthy: false - Indicates that the service is down.
Retrieving the API Specification Document
This API request retrieves the API specification document.
- Base URL
- https://{ESA IP address}/pty/<Version>/<API>
- Path
- /doc
- Method
- GET
CURL request syntax
curl -X GET "https://{ESA IP address}/pty/<Version>/<API>/doc"
Authentication credentials
Not required.
Sample CURL requests
curl -X GET "https://10.10.101.43/pty/v1/rps/doc"
curl -X GET "https://10.10.101.43/pty/v1/rps/doc" -o "rps.yaml"
Sample CURL responses
The Encrypted Resilient Package API specification document is displayed as a response. If you have specified the “-o” parameter in the CURL request, then the API specification is copied to a file specified in the command. You can use the Swagger UI to view the API specification document.
Retrieving the Log Level
This API request retrieves current log level set for the REST API service logs.
- Base URL
- https://{ESA IP address}/pty/<Version>/<API>
- Path
- /log
- Method
- GET
CURL request syntax
curl -H "Authorization: Bearer <TOKEN>" -X GET "https://{ESA IP address}/pty/<Version>/<API>/log"
In this command, Token indicates the JWT token used for authenticating the API.
Alternatively, you can also store the JWT token in an environment variable named TOKEN, as shown in the following command.
curl -H "Authorization: Bearer ${TOKEN}" -X GET "https://{ESA IP address}/pty/<Version>/<API>/log"
Authentication credentials
TOKEN - Environment variable containing the JWT token.
For more information about creating a JWT token, refer to the section Generating JWT for REST APIs.
Sample CURL request
curl -H "Authorization: Bearer ${TOKEN}" -X GET "https://10.10.101.43/pty/v2/pim/log"
This sample request uses the JWT token authentication.
Sample CURL response
{
  "level": "INFO"
}
Setting Log Level for the REST API Service Log
This API request changes the REST API service log level during run-time. The level set through this resource persists until the corresponding service is restarted. This log level overrides the log level defined in the configuration.
- Base URL
- https://{ESA IP address}/pty/<Version>/<API>
- Path
- /log
- Method
- POST
CURL request syntax
curl -X POST "https://{ESA IP Address}/pty/<Version>/<API>/log" -H "Authorization: Bearer <TOKEN>" -H "accept: application/json" -H "Content-Type: application/json" -d "{\"level\":\"log level\"}"
In this command, Token indicates the JWT token used for authenticating the API.
Alternatively, you can also store the JWT token in an environment variable named TOKEN, as shown in the following command.
curl -X POST "https://{ESA IP Address}/pty/<Version>/<API>/log" -H "Authorization: Bearer ${TOKEN}" -H "accept: application/json" -H "Content-Type: application/json" -d "{\"level\":\"log level\"}"
Authentication credentials
TOKEN - Environment variable containing the JWT token.
For more information about creating a JWT token, refer to the section Generating JWT for REST APIs.
Request body elements
log level
Set the log level. The log level can be set to SEVERE, WARNING, INFO, CONFIG, FINE, FINER, or FINEST.
Sample CURL request
curl -X POST "https://{ESA IP Address}/pty/v1/rps/log" -H "Authorization: Bearer ${TOKEN}" -H "accept: application/json" -H "Content-Type: application/json" -d "{\"level\":\"SEVERE\"}"
This sample request uses the JWT token authentication.
Sample response
The log level is set successfully.
7.4 - Using the Policy Management REST APIs
The user accessing these APIs must have the Security Officer permission for write access and the Security Viewer permission for read-only access.
For more information about the roles and permissions required, refer to the section Managing Roles.
The Policy Management API uses the v2 version.
If you want to perform common operations using the Policy Management REST API, then refer the section Using the Common REST API Endpoints.
The following table provides section references that explain usage of some of the Policy Management REST APIs. It includes an example workflow to work with the Policy Management functions. If you want to view all the Policy Management APIs, then use the /doc API to retrieve the API specification.
| REST API | Section Reference |
|---|---|
| Policy Management initialization | Initializing the Policy Management |
| Creating an empty manual role that will accept all users | Creating a Manual Role |
| Create data elements | Create Data Elements |
| Create policy | Create Policy |
| Add roles and data elements to the policy | Adding roles and data elements to the policy |
| Create a default data store | Creating a default datastore |
| Deploy the data store | Deploying the Data Store |
| Get the deployment information | Getting the Deployment Information |
Initializing the Policy Management
This section explains how you can initialize Policy Management to create the keys-related data and the policy repository. If you are initializing the Policy Management from the ESA Web UI, then the execution of this service is not required.
For more information about initializing the Policy Management from the ESA Web UI, refer to the section Initializing the Policy Management.
- Base URL
- https://{ESA IP address or Hostname}/pty/v2
- Authentication credentials
- TOKEN - Environment variable containing the JWT token.
For more information about creating a JWT token, refer to the section Generating JWT for REST APIs. - Path
- /pim/init
- Method
- POST
Sample Request
curl -H "Authorization: Bearer ${TOKEN}" -X POST "https://{ESA IP address or Hostname}:443/pty/v2/pim/init" -H "accept: application/json"
This sample request uses the JWT token authentication.
Creating a Manual Role
This section explains how you can create a manual role that accepts all the users.
For more information about working with roles, refer to the section Working with Roles.
- Base URL
- https://{ESA IP address or Hostname}/pty/v2
- Authentication credentials
- TOKEN - Environment variable containing the JWT token.
For more information about creating a JWT token, refer to the section Generating JWT for REST APIs. - Path
- /pim/roles
- Method
- POST
Sample Request
curl -H "Authorization: Bearer ${TOKEN}" -X POST "https://{ESA IP address or Hostname}:443/pty/v2/pim/roles" -H "accept: application/json" -H "Content-Type: application/json" -d "{\"name\":\"ROLE\",\"mode\":\"MANUAL\",\"allowAll\": true}
This sample request uses the JWT token authentication.
Creating Data Elements
This section explains how you can create data elements.
For more information about working with data elements, refer to the section Working with Data Elements.
- Base URL
- https://{ESA IP address or Hostname}/pty/v2
- Authentication credentials
- TOKEN - Environment variable containing the JWT token.
For more information about creating a JWT token, refer to the section Generating JWT for REST APIs. - Path
- /pim/roles
- Method
- POST
Sample Request
curl -H "Authorization: Bearer ${TOKEN}" -X POST "https://{ESA IP address or Hostname}:443/pty/v2/pim/dataelements" -H "accept: application/json" -H "Content-Type: application/json" -d "{\"name\": \"DE_ALPHANUM\",\"description\": \"DE_ALPHANUM\",\"alphaNumericToken\":{\"tokenizer\":\"SLT_1_3\",\"fromLeft\": 0,\"fromRight\": 0,\"lengthPreserving\": true, \"allowShort\": \"YES\"}}"
This sample request uses the JWT token authentication.
Creating Policy
This section explains how you can create a policy.
For more information about working with policies, refer to the section Creating Policies.
- Base URL
- https://{ESA IP address or Hostname}/pty/v2
- Authentication credentials
- TOKEN - Environment variable containing the JWT token.
For more information about creating a JWT token, refer to the section Generating JWT for REST APIs. - Path
- /pim/policies
- Method
- POST
Sample Request
curl -H "Authorization: Bearer ${TOKEN}" -X POST "https://{ESA IP address or Hostname}:443/pty/v2/pim/policies" -H "accept: application/json" -H "Content-Type: application/json" -d "{\"name\":\"POLICY\",\"description\": \"POLICY\", \"template\":{\"access\":{\"protect\":true,\"reProtect\":true,\"unProtect\":true},\"audit\":{\"success\":{\"protect\":false,\"reProtect\":false,\"unProtect\":false},\"failed\":{\"protect\":false,\"reProtect\":false,\"unProtect\":false}}}}"
This sample request uses the JWT token authentication.
Adding Roles and Data Elements to a Policy
This section explains how you can add roles and data elements to a policy.
For more information about adding roles and data elements to a policy, refer to the sections Adding Data Elements to Policy and Adding Roles to Policy respectively.
- Base URL
- https://{ESA IP address or Hostname}/pty/v2
- Authentication credentials
- TOKEN - Environment variable containing the JWT token.
For more information about creating a JWT token, refer to the section Generating JWT for REST APIs. - Path
- /pim/policies/1/rules
- Method
- POST
Sample Request
curl -H "Authorization: Bearer ${TOKEN}" -X POST "https://{ESA IP address or Hostname}:443/pty/v2/pim/policies/1/rules" -H "accept: application/json" -H "Content-Type: application/json" -d "{\"role\":\"1\",\"dataElement\":\"1\",\"noAccessOperation\":\"EXCEPTION\",\"permission\":{\"access\":{\"protect\":true,\"reProtect\":true,\"unProtect\":true},\"audit\":{\"success\":{\"protect\":false,\"reProtect\":false,\"unProtect\":false},\"failed\":{\"protect\":false,\"reProtect\":false,\"unProtect\":false}}}}"
This sample request uses the JWT token authentication.
Creating a Default Data Store
This section explains how you can create a default data store.
For more information about working with data stores, refer to the section Creating a Data Store.
- Base URL
- https://{ESA IP address or Hostname}/pty/v2
- Authentication credentials
- TOKEN - Environment variable containing the JWT token.
For more information about creating a JWT token, refer to the section Generating JWT for REST APIs. - Path
- /pim/datastores
- Method
- POST
Sample Request
curl -H "Authorization: Bearer ${TOKEN}" -X POST "https://{ESA IP address or Hostname}:443/pty/v2/pim/datastores" -H "accept: application/json" -H "Content-Type: application/json" -d "{\"name\":\"DS\",\"description\": \"DS\", \"default\":true}"
This sample request uses the JWT token authentication.
Deploying the Data Store
This section explains how you can deploy policies or trusted applications linked to a specific data store or multiple data stores.
For more information about deploying the Data Store, refer to the section Deploying Data Stores.
Deploying a Specific Data Store
This section explains how you can deploy policies and trusted applications linked to a specific data store. The specifications provided for the specific data store are applied and becomes the end-result.
Note: If you deploy an array with empty policies or trusted applications, or both, then the connected protectors contain empty definitions for these respective items.
- Base URL
- https://{ESA IP address or Hostname}/pty/v2
- Authentication credentials
- TOKEN - Environment variable containing the JWT token.
For more information about creating a JWT token, refer to the section Generating JWT for REST APIs. - Path
- /pim/datastores/{dataStoreUid}/deploy
- Method
- POST
Sample Request
curl -H "Authorization: Bearer ${TOKEN}" -X POST "https://{ESA IP address or Hostname}:443/pty/v2/pim/datastores/{dataStoreUid}/deploy" -H "accept: application/json" -H "Content-Type: application/json" -d "{\"policies\":[\"1\"],\"applications\":[\"1\"]}"
This sample request uses the JWT token authentication.
Deploying Data Stores
This section explains how you can deploy data stores, which can contain the linking of either the policies or trusted applications, or both for the deployment.
Note: If you deploy a data store containing an array with empty policies or trusted applications, or both, then the connected protectors contain empty definitions for these respective items.
- Base URL
- https://{ESA IP address or Hostname}/pty/v2
- Authentication credentials
- TOKEN - Environment variable containing the JWT token.
For more information about creating a JWT token, refer to the section Generating JWT for REST APIs. - Path
- /pim/deploy
- Method
- POST
Sample Request
curl -H "Authorization: Bearer ${TOKEN}" -X POST "https://{ESA IP address}:443/pty/v2/pim/deploy" -H "accept: application/json" -H "Content-Type: application/json" -d "{\"dataStores\":[{\"uid\":\"1\",\"policies\":[\"1\"],\"applications\":[\"1\"]},{\"uid\":\"2\",\"policies\":[\"2\"],\"applications\":[\"2\"]}]}"
This sample request uses the JWT token authentication.
Getting the Deployment Information
This section explains how you can check the complete deployment information. This service returns the list of the data stores with the connected policies and trusted applications.
Note: The result might contain data store information that is pending deployment after combining the Policy Management operations performed through the ESA Web UI and PIM API.
- Base URL
- https://{ESA IP address or Hostname}/pty/v2
- Authentication credentials
- TOKEN - Environment variable containing the JWT token.
For more information about creating a JWT token, refer to the section Generating JWT for REST APIs. - Path
- /pim/deploy
- Method
- GET
Sample Request
curl -H "Authorization: Bearer ${TOKEN}" -X GET "https://{ESA IP address or Hostname}:443/pty/v2/pim/deploy" -H "accept: application/json"
This sample request uses the JWT token authentication.
7.5 - Using the Encrypted Resilient Package REST APIs
The Encrypted Resilient Package API is only used by the Immutable Resilient protectors.
Before you begin:
Ensure that the concept of resilient protectors and necessity of a resilient package is understood.
For more information on how the REST API is used to export the encrypted resilient package in an immutable policy deployment, refer to the section DevOps Approach for Application Protector.Ensure that the RPS service is running on the ESA.
The user accessing this API must have the Export Resilient Package permission.
For more information about the roles and permissions required, refer to the section Managing Roles.
The Encrypted Resilient Package API uses the v1 version.
If you want to perform common operations using the Encrypted Resilient Package API, then refer the section Using the Common REST API Endpoints.
The following table provides a section reference to the Encrypted Resilient Package API.
| REST API | Section Reference |
|---|---|
| Exporting the resilient package | Exporting Resilient Package |
Exporting Resilient Package Using GET Method
This API request exports the resilient package that can be used with resilient protectors. You can use the Basic authentication, Certificate authentication, and JWT authentication for encrypting and exporting the resilient package.
Warning: Do not modify the package that has been exported using the RPS Service API. If you modify the exported package, then the package will get corrupted.
The resilient package that has been exported using the Encrypted Resilient Package API is not FIPS-compliant.
- Base URL
- https://<ESA IP address or Hostname>/pty/v1/rps
- Path
- /export
- Method
- GET
- CURL request syntax
- Export API
curl -H "Authorization: Bearer <TOKEN>" -X GET https://<ESA IP address or Hostname>/pty/v1/rps/export/<fingerprint>?version=1&coreversion=1 -H "Content-Type: application/json" -o rps.json - In this command, TOKEN indicates the JWT token used for authenticating the API.
For more information about creating a JWT token, refer to the section Generating JWT for REST APIs.
- Query Parameters
- fingerprint
- Specify the fingerprint of the Data Store Export Key. The fingerprint is used to identify which Data Store to export and which export key to use for protecting the resilient package. The user with the Security Officer permissions must share the fingerprint of the Export Key with the user who is executing this API. For more information about obtaining the fingerprint of the Data Store Export Key, refer to step 7 of the section Adding Export Key.
version
- Set the schema version of the exported resilient package that is supported by the specific protector.
coreversion
- Set the Core policy schema version that is supported by the specific protector.
- Sample CURL request
- Export API
curl -H "Authorization: Bearer $<TOKEN>" -X GET https://<ESA IP address or Hostname>/pty/v1/rps/export/a7fdbc0cccc954e00920a4520787f0a08488db8e0f77f95aa534c5f80477c03a?version=1&coreversion=1 -H "Content-Type: application/json" -o rps.jsonThis sample request uses the JWT token authentication.
- Sample response
- The
rps.jsonfile is exported using the public key associated with the specified fingerprint.
Protect the encrypted resilient package with standard file permissions to ensure that only the dedicated protectors can access the package.
8 - Protegrity Data Security Platform Licensing
The Licensing content answers the following questions:
- What is the difference between a temporary and validated license?
- How can you request a validated license?
- What happens if the license expires?
- How are you notified when your license is due to expire?
- What are the features included in a validated license?
It is strongly recommended that you read all the Licensing sections. Ensure that you understand how the licensing affects the ESA installation, ESA upgrade, trusted appliances cluster licensing, and protectors’ licensing.
To prevent unauthorized use of the Protegrity Data Security Platform and prevent illegal copying and distribution, Protegrity supports licensing. The licenses provided by Protegrity are unique and non-transferable. They permit product usage for the term specified in your agreement with Protegrity.
The benefit to you, as our customer, is that the Protegrity license provides additional security to the product. The license also supports a legal agreement stipulating the rights and liabilities of both parties.
License Agreement
The License Agreement is a contract between the licensor and purchaser, establishing the purchaser’s right to use the software.
The Protegrity License Agreement stipulates the license expiration date and the functionality which is available before and after the license expiration date.
For specific details about your particular licensing terms, refer to your License Agreement provided by Protegrity.
License Types
When your Enterprise Security Administrator (ESA) is installed and Policy Management is initialized, a temporary license is applied to it by default.
The temporary license which is created during initialization allows you to use ESA and Policy management for 30 days starting from the day you initialized Policy Management. When the temporary license expires, you are able to log on to ESA, but you have restricted permissions for using it.
To continue using the ESA with full administrative permissions, you must obtain a validated license provided by Protegrity. The validated license has an expiration date which is determined by the License Agreement between your company and Protegrity.
Temporary and Validated License Characteristics
This section explains types of licenses and characteristics of each license.
The following table describes the characteristics of each type of license. The license characteristics explain the key points of each license and show how they differ from each other.
Table - Characteristics of Different License Types
| Characteristics | Temporary License | Validated License |
| Obtaining a license | Installed by default during ESA installation. | Requested using ESA Web UI. |
| Updating a license | Not applicable | Requested using ESA Web UI. |
| Warning alerts before expiration of the license date | 30 days prior to expiration date.
The alerts appear as start-up messages when you log into ESA. The
alerts can also be configured using email, and are available in
the ESA logs and logs received from the Protection Points. In addition, if the expiry of your license is less than or equal to 90 days, the License Information dialog box appears when you log in to the ESA. | |
| Cluster licensing | Can only be used on a particular node where it was created during installation. | Stipulated by the License Agreement. For details, refer to Cluster Licensing. |
8.1 - Obtaining a Validated License
You can validate the license from the Licenses pane, available in the ESA Web UI. You can refer to the following screenshot. Only a user with ESA Administrative permissions can request and activate the license.

Requesting a License
You can request a validated ESA license while your temporary license is valid, or invalid, or has already expired.
To request an ESA license:
As an ESA administrator, proceed to Settings > Licenses.
In the Licenses pane, click the Generate button.
Save the automatically generated licenserequest.xml file to the local disk.
Send the license request file to licensing@protegrity.com.
Activating a License
After submitting your license request, you receive an email with a license file called license.xml. This file includes the original data retrieved from the license request, expiration date, and additional information, if required.
Note: If there is a License Agreement between your company and Protegrity, you will receive the validated license by the end of the following business day.
To activate an ESA license:
Save the license.xml file to your local disk when you receive it from Protegrity.
As an ESA administrator, proceed to Settings > Licenses.
Click Activate License.
In the Licenses pane, click Browse.
Select the license.xml file.
You are notified about success or failure of the activation process.
Note: You do not need to restart ESA and any data protectors to activate the validated license. However, if you have policies deployed to protection points with a temporary license, then you must re-deploy the policies with the validated license.
The license file is stored in an encrypted format on the ESA file system after it is activated.
CAUTION: Modifying either the temporary or validated license file leads to license deactivation.
Updating a License
You need to update your current license before it expires. You may also update the license in case your needs have changed.
The process of updating the license is the same as when you apply for a new license. You need to submit a new license request and send an email to licensing@protegrity.com with the information about what you would like to change in your current license.
For details, refer to Requesting a License.
8.2 - Non-Licensed Product
A license expires when the end of the term for that license has passed. A corrupted license is not valid. For details about expired licenses, refer to Expired License. For more about corrupted licenses, refer to Corrupted (Invalid) License.
Warning: From 10.2.0 onwards, the protectors will display the following behaviour with regards to the ESA licensing -
An expired or invalid license will block policy, key, and deployment services on the ESA and via the DevOps APIs. An existing protector will continue to perform security operations. However, if you add a new protector or restart an existing protector, then the protector will not receive any policy until a valid license is applied. In addition, you will not be able to perform any other task from the Policy Management UI unless you obtain a valid license. On performing any action on the Policy Management UI, you will automatically be navigated to the License Manager screen as shown in the following screenshot.

For more information about obtaining a valid license, refer to Obtaining a Validated License.
License Expiration Notification
If the expiry of your license is less than or equal to 90 days, then the License Information dialog box appears when you log in to the ESA.

This dialog box specifies the number of days by when your license is going to expire. Click Acknowledge to continue accessing the ESA Web UI.
On the ESA Web UI, a message in the Notification pane reminds you that your license is due to expire. This reminder message appears every day from one month prior to the expiration date.

Expired License
A license expires depending on the expiration time and date settings in the license file. In the Notification pane of the ESA Web UI, Expired license status is displayed.
Corrupted (Invalid) License
If a license has been corrupted, in the Licenses pane of the ESA Web UI, then the Invalid license status is displayed.
If a license has been corrupted, in the Licenses pane of the ESA Web UI, then the Invalid license status is displayed.
A license may be corrupted in the following cases:
- License file has been changed manually.
- License file has been deleted.
- System date and time has been modified prior to when the license was applied to the product.
CAUTION: You MUST NOT change the system date and time to an earlier date and time than the license has been generated. This can lead to the license deactivation. The daylight saving time change is done automatically.
CAUTION: You MUST NOT edit or delete the license file saved on ESA since it can lead to license deactivation.
License Alerts
The Hub Controller generates warning logs at start-up, and once per day, when a license is about to expire, has expired, or is invalid. The ESA Web UI and Policy Management generate alert notifications about license status.
Once the system detects that the current system date is less than or equal to 30 days from the expiration date, an audit event is generated. For a temporary license, the system generates alerts once the ESA is installed.
Once the license is expired or becomes invalid, the Data Security Platform produces logs and notifications. These logs and notifications informs you about the change in the state of the license. You can refer to the Alerts and Notifications when License at Risk table for more details.
The Expiration Date field shows notifications about the current license status. In that field it will show the number of days left before the license expires.
You can also set up separate email notification alerts when licenses are about to expire using the ESA Web UI. For more information about setting up separate email notification alerts, refer to the Enterprise Security Administrator Guide.
The following table lists the system notifications and alerts about the status of the license at risk.
Table - Alerts and Notifications when License at Risk
| Alert type | ESA alerts | Protection point alerts | Cumulative alerts information |
| License Information dialog box in the ESA Web UI home page. | For 10.0.0 protectors, warning is not generated. For protectors earlier than 10.0.0, a WARNING is generated in the PEP Server application log once per hour and upon PEP Server restart. | The license alerts and audits are sent to the ESA Audit Store. |
| License alert in the Notifications tab of the ESA Web UI. | |||
| WARNING generated by the Hub Controller in application log once per day and upon Hub Controller restart. |
8.3 - Cluster Licensing
There are two types of restrictions that can be applied to your Protegrity license. A Configuration Lock is not machine specific and therefore can be used on other nodes in a cluster. A Node Lock is specific to the machine address of the node, and therefore cannot be used on other nodes. Node Lock is the stronger of the two restrictions and it will always take precedence when applied.
The descriptions of these restrictions follow:
| License Agreement | Configuration Lock | Node Lock |
|---|---|---|
| Perpetual License | Always applied | Not applied. |
| Term License | Always applied | Applied as stipulated by your License Agreement with Protegrity. |
The procedure you follow for requesting license files for your cluster are explained in the following sections.
CAUTION: These procedures must be followed ONLY when your Protegrity license agreement stipulates that the Node Lock is applied. If your license agreement only has the Configuration Lock applied, then you can use the same license file for all nodes.
Licensing Trusted Appliance Cluster
From Release 6.6.x onwards, we offer customers the functionality to create an appliance cluster, primarily for use in disaster recovery (DR) scenarios. This allows you to create a trusted network of appliances with replication between appliances hosts. Depending upon the type of license agreement you have with Protegrity, you may be required to request a new validated license file when adding nodes to your appliance cluster. You must refer to your Protegrity License Agreement for specific terms.
To obtain a license for an ESA cluster:
Create an ESA cluster as explained in the Protegrity Appliances Overview Guide.
Generate a license request file by using the Web Interface on each individual node.
Save the license request file on your local disk with a different name than the default name. For example, licenserequest2.xml.
Send an email to licensing@protegrity.com including all license request files obtained in step 2. In the email, state that you need a license for an ESA trusted appliances cluster.
When you receive the single Protegrity license, activate it on one of the ESA nodes as explained in section 3.2 Activating a License.
Export the policy to all other ESA nodes in the cluster.
Note: Ensure that you create a new license request for each node in the cluster. This request is created while you add a new node to an existing cluster, including the new node. Once it is done, you can send it to Protegrity.
9 - Troubleshooting
9.1 - Policy and Key Audit logs
The policy audit logs generated for policy-related operations are sent to ESA. You can view them in Discover. Log in to the ESA, navigating to Audit Store > Dashboard > Open in new tab. Select Discover from the menu and select a time period such as Last 30 days.
Note:
- The policy and key audit log codes are similar to the previous version.
- The log descriptions in v10.2.0 are revised for policy and key audits. These changes may impact automated systems, alerts, and parsing logic in production environments. We recommend to review and update any dependent tools or queries.
event_status Field
In the ESA v10.2.0, a new field event_status has been introduced for all policy and key related audits. This field captures the outcome of each policy operation:
Success: Indicates the action was completed successfully.
Failure: Indicates the action was unsuccessful due to an error.
Other: Indicates the
event_statuscannot be classified as neither a success nor a failure. The other value is usually used for logs providing information about an operation performed.
Example: Master Key Rotation – Success and Failure
Success Scenario
Imagine you are performing a routine rotation of the Master Key to maintain cryptographic hygiene. The following logs would indicate a successful operation:
| Log Code | Log Description | Event Status | What It Means |
|---|---|---|---|
| 179 | Rotate master key. (Master key rotated successfully) | success | The Master Key was rotated without issues. |
| 78 | Create key. (Key xxxxxxxx-xxxx-xxxx-xxxx-xxxxxxxxxxxx created) | success | A new key was generated as part of the rotation process. |
These logs confirm that the key lifecycle was handled properly. For instance, a new key was created, the old one was deactivated, and the system remains secure and compliant.
Failure Scenario
Now, suppose the Master Key rotation fails due to a service outage, for example the kmgw service has stopped. You might see logs like:
| Log Code | Log Description | Event Status | What It Means |
|---|---|---|---|
| 179 | Rotate master key. (Master key rotation failed) | failure | The rotation process could not complete due to a system issue. |
| 78 | Create key. | failure | The system failed to generate a new key, possibly because the key management gateway kmgw was down. |
These logs indicate that the rotation process was interrupted. No new key was created and the old key remains active. This could pose a security risk if not resolved promptly.
Other Scenario
| Log Code | Log Description | Event Status | What It Means |
|---|---|---|---|
| 178 | Master key expire warning. (Master key with UID: xxxxxxxx-xxxx-xxxx-xxxx-xxxxxxxxxxxx will expire on yyyy-mm-dd) | other | Master key expire warning. |
Table: Policy and Key Audit logs
| Audit Code | Log Description |
|---|---|
| 50 | Create policy. |
| 51 | Update policy. |
| 52 | Delete policy. |
| 56 | Role added to policy. |
| 57 | Unprotect access revoked for users having mask conflict. |
| 58 | Data element added to policy. |
| 59 | Data element removed from policy. |
| 71 | Deploy policy. |
| 74 | Policy removed from datastore. |
| 75 | Policy added to datastore. |
| 76 | Policy changed state. |
| 78 | Create key. |
| 80 | Policy deploy failed. |
| 81 | Policy deploy started. |
| 82 | Policy deploy ended. |
| 83 | Token publish failed. |
| 84 | Token published successful. |
| 85 | Data Element key(s) exported. |
| 86 | Policy deploy warning. |
| 87 | Alphabet publish failed. |
| 88 | Alphabet published successful. |
| 100 | Password changed. |
| 101 | Create datastore. |
| 102 | Update datastore. |
| 103 | Delete datastore. |
| 107 | Create mask. |
| 108 | Delete mask. |
| 109 | Securitycoordinate deleted. |
| 110 | Securitycoordinate created. |
| 111 | Create role. |
| 112 | Delete role. |
| 113 | Create membersource. |
| 114 | Update membersource. |
| 115 | Delete membersource. |
| 116 | All roles resolved. |
| 117 | Role resolved. |
| 118 | Role groupmember resolved. |
| 119 | Create trusted application. |
| 120 | Delete trusted application. |
| 121 | Update trusted application. |
| 124 | Trusted application added to datastore. |
| 125 | Trusted application removed from datastore. |
| 126 | Update mask. |
| 127 | Update role. |
| 128 | Policy permissions updated. |
| 129 | Node registered. |
| 130 | Node updated. |
| 131 | Node unregistered. |
| 141 | Create alphabet. |
| 142 | Delete Alphabet. |
| 149 | Update data element. |
| 150 | Create data element. |
| 151 | Delete data element. |
| 152 | Too many keys created. |
| 153 | License expire warning. |
| 154 | License has expired. |
| 155 | License is invalid. |
| 156 | Policy is compromised. |
| 157 | Failed to import some users. |
| 158 | Policy successfully imported. |
| 159 | Failed to import policy. |
| 170 | Key exported. |
| 171 | Key updated. |
| 172 | Key deleted. |
| 173 | Datastore key has expired. |
| 174 | Datastore key expire warning. |
| 176 | Rotate datastore key. |
| 177 | Master key has expired. |
| 178 | Master key expire warning. |
| 179 | Rotate master key. |
| 180 | Configure New HSM. |
| 181 | Repository key has expired. |
| 182 | Repository key expire warning. |
| 183 | Rotate repository key. |
| 184 | Metering created. |
| 185 | Metering updated. |
| 186 | Metering deleted. |
| 187 | Integrity created. |
| 188 | Integrity updated. |
| 189 | Integrity deleted. |
| 195 | Signing key has expired. |
| 196 | Signing key expire warning. |
| 197 | Rotate signing key. |
| 198 | Signing key exported. |
| 199 | Case sensitive data element created. |
| 210 | Data Element key has expired. |
| 211 | Data Element key expire warning. |
| 212 | Conflicting policy users found. |
| 213 | Change key state. |
| 214 | Automatic key rotation disabled. |
| 215 | Automatic key rotation enabled. |
| 220 | Data Element deprecated. |
| 221 | Add export key. |
| 222 | Update export key. |
| 223 | Delete export key. |
| 224 | Role permissions updated for Data Element. |
| 225 | Permissions for Data Element updated. |
| 226 | Role removed from policy. |
| 227 | Create range in datastore. |
| 228 | Update range in datastore. |
| 229 | Delete range from datastore. |
| 230 | Add member to role. |
| 231 | Update member in role. |
| 232 | Remove member from role. |
To view the policy audit logs:
- Log in to the ESA.
- Navigate to Audit Store > Dashboard.
- From the menu, select Discover.
- Select index pty_insight_analytics*policy_log_* from Index patterns and a time period such as Today.
The list of policy audit logs appear.
For more information about the Insight Indexes, refer to Understanding the Insight indexes.
9.2 - Known issues for the Audit Store
Known Issue: The Audit Store node security remains uninitialized and the message Audit Store Security is not initialized. appears on the Audit Store Cluster Management page.
Resolution:
Run the following steps to resolve the issue.
- From the ESA Web UI, navigate to System > Services > Audit Store.
- Ensure that the Audit Store Repository service is running.
- Open the ESA CLI.
- Navigate to Tools.
- Run Apply Audit Store Security Configs.
Known Issue: Logs sent to the Audit Store do not get saved and errors might be displayed.
Issue:
The Audit Store cannot receive and store logs when the disk space available on the ESA is low. In this case, errors or warnings similar to high disk watermark [90%] exceeded are displayed in the logs.
Resolution:
Perform one of the following steps to resolve the issue:
- Delete old indices that are not required using ILM in Analytics.
- Increase the disk space on all nodes.
- Add new nodes to the cluster.
Known Issue: The Audit Store Repository fails to start after updating the IP address, hostname, or domain name.
Issue:
After updating the IP address, hostname, or domain name, the Audit Store Repository service fails to start.
Resolution:
After updating the IP address, complete the steps provided in Updating the IP address of the ESA.
After updating the hostname, complete the steps provided in Updating the hostname of the ESA.
After updating the domain name, complete the steps provided in Updating the domain name of the ESA.
Known Issue: The Upgrade cannot continue as the cluster health status is red. Check out the Troubleshooting Guide for info on how to proceed. error message appears.
Issue: A cluster status in red color means that at least one primary shard and its replicas are not allocated to a node, that is, there are indices with the index health status in red color in the Audit Store cluster.
Workaround
Complete the following steps on a node where the Audit Store is available to resolve the cluster health with the red status.
From the Web UI of the ESA, navigate to System > Services > Audit Store.
Ensure that the Audit Store Repository service is running.
Log in to the CLI Manager of the Appliance.
Navigate to Administration > OS Console.
Identify the indices with the health status as red using the following command.
wget -q --ca-cert=<Path_to_CA_certificate>/CA.pem --certificate=<Path_to_client_certificate>/client.pem --private-key=<Path_to_client_key>/client.key -O - https://<ESA_HOSTNAME_IP>:9201/_cat/indices | grep redEnsure that you update the variables before running the command. An example of the command is provided here.
wget -q --ca-cert=/etc/ksa/certificates/as_cluster/CA.pem --certificate=/etc/ksa/certificates/as_cluster/client.pem --private-key=/etc/ksa/certificates/as_cluster/client.key -O - https://protegrity-esa123.protegrity.com:9201/_cat/indices | grep redA list of indices containing the health status as red appears as shown in the following example.
red open pty_insight_audit_vx.x-xxxx.xx.xx-000014 dxmEWom8RheqOhnaFeM3sw 1 1In the example, pty_insight_audit_vx.x-xxxx.xx.xx-000014 is the index having a red index health status where the index’s primary shard and replicas are not available or allocated to any node in the cluster.
Identify the reason for unassigned shards using the following command.
wget -q --ca-cert=<Path_to_CA_certificate>/CA.pem --certificate=<Path_to_client_certificate>/client.pem --private-key=<Path_to_client_key>/client.key -O - https://<ESA_HOSTNAME_IP>:9201/_cat/shards?h=index,shard,prirep,state,unassigned.reason | grep UNASSIGNEDEnsure that you update the variables before running the command. An example of the command is provided here.
wget -q --ca-cert=/etc/ksa/certificates/as_cluster/CA.pem --certificate=/etc/ksa/certificates/as_cluster/client.pem --private-key=/etc/ksa/certificates/as_cluster/client.key -O - https://protegrity-esa123.protegrity.com:9201/_cat/shards?h=index,shard,prirep,state,unassigned.reason | grep UNASSIGNEDThe reasons for the shards being unassigned appear. This example shows one of the reasons for the unassigned shard.
    `pty_insight_audit_vx.x-xxxx.xx.xx-000014             0 p UNASSIGNED NODE_LEFT`

    `pty_insight_audit_vx.x-xxxx.xx.xx-000014             0 r UNASSIGNED NODE_LEFT`
In the example, the 0th p and r shards of the pty_insight_audit_vx.x-xxxx.xx.xx-000014 index are unassigned due to the NODE_LEFT reason, that is, because the node left the Audit Store cluster. The p indicates a primary shard and the r indicates a replica shard.
Retrieve the details for the shard being unassigned using the following command.
wget -q --ca-cert=<Path_to_CA_certificate>/CA.pem --certificate=<Path_to_client_certificate>/client.pem --private-key=<Path_to_client_key>/client.key --header='Content-Type:application/json' --method=GET --body-data='{ "index": "<Index_name>", "shard": <Shard_ID>, "primary":<true or false> }' -O - https://<ESA_HOSTNAME_IP>:9201/_cluster/allocation/explain?prettyEnsure that you update the variables before running the command. An example of the command with the index name as pty_insight_audit_vx.x-xxxx.xx.xx-000014, shard ID as 0, and primary shard as true is provided here.
wget -q --ca-cert=/etc/ksa/certificates/as_cluster/CA.pem --certificate=/etc/ksa/certificates/as_cluster/client.pem --private-key=/etc/ksa/certificates/as_cluster/client.key --header='Content-Type:application/json' --method=GET --body-data='{ "index": "pty_insight_audit_vx.x-xxxx.xx.xx-000014", "shard": 0, "primary": true }' -O - https://protegrity-esa123.protegrity.com:9201/_cluster/allocation/explain?prettyThe details of the unassigned shard appears. This example shows one of the reasons for the unassigned shard.
{
        "index": "pty_insight_audit_vx.x-xxxx.xx.xx-000014",
        "shard": 0,
        "primary": true,
        "current_state": "unassigned",
        "unassigned_info": {
            "reason": "NODE_LEFT",
            "at": "2022-03-28T05:05:25.631Z",
            "details": "node_left [gJ38FzlDSEmTAPcP0yw57w]",
            "last_allocation_status": "no_valid_shard_copy"
        },
        "can_allocate": "no_valid_shard_copy",
        **"allocate\_explanation": "cannot allocate because all found copies of the shard are either stale or corrupt",**
        "node_allocation_decisions": [
            {
                "node_id": "3KXS1w9HTOeMH1KbDShGIQ",
                "node_name": "ESA1",
                "transport_address": "xx.xx.xx.xx:9300",
                "node_attributes": {
                    "shard_indexing_pressure_enabled": "true"
                },
                "node_decision": "no",
                "store": {
                    "in_sync": false,
                    "allocation_id": "HraOWSZlT3KNXxOHDhZL5Q"
                }
            }
        ]
    }
In this example, the shard is not allocated because all found copies of the shard are either stale or corrupt. There are no valid shard copies that can be allocated for this index. This is a data loss scenario, where the data is unavailable because the node or nodes that had the data have disconnected from the cluster. In such a scenario, if the disconnected nodes are brought back in the cluster, then the cluster can reconstruct itself and become healthy again. If bringing the nodes back is not possible, then deleting indices with the red index health status is the only way to fix a red cluster health status.
Complete one of the following two steps to stabilize the cluster.
Troubleshoot the cluster:
- Verify that the Audit Store services are running. Restart any Audit Store service that is in the stopped state.
- Ensure that the disconnected nodes are running.
- Try to add any disconnected nodes back to the cluster.
- Restart the system or restore the system from a backup.
Delete the index:
Delete the indices with the index health status as red using the following command. Execute the command from any one node of Audit Store node which is running.
wget -q --ca-cert=<Path_to_CA_certificate>/CA.pem --certificate=<Path_to_client_certificate>/client.pem --private-key=<Path_to_client_key>/client.key --header='Content-Type:application/json' --method=DELETE -O - https://<ESA_HOSTNAME_IP>:9201/<Index_name>Ensure that you update the variables before running the command. An example of the command to delete the pty_insight_audit_vx.x-xxxx.xx.xx-000014 index is provided here.
wget -q --ca-cert=/etc/ksa/certificates/as_cluster/CA.pem --certificate=/etc/ksa/certificates/as_cluster/client.pem --private-key=/etc/ksa/certificates/as_cluster/client.key --header='Content-Type:application/json' --method=DELETE -O - https://protegrity-esa123.protegrity.com:9201/pty_insight_audit_vx.x-xxxx.xx.xx-000014CAUTION:
This command deletes the index and must be used carefully.
Known Issue: The Authentication failure for the user during JWT token generation while downloading ssh key from node error appears while performing any Audit Store cluster-related operation.
Issue: The Can create JWT token permission is required for a role to perform Audit Store cluster-related operations. The error appears if the permission is not assigned to the user.
Workaround
Use a user with the appropriate permissions for performing Audit Store cluster-related operations. Alternatively, verify and add the Can create JWT token permission. To verify and add the Can Create JWT Token permission, from the ESA Web UI, navigate to Settings > Users > Roles.
Known Issue: The pty_insight_analytics_miscellaneous_* index on the Discover page loads with errors.
Issue:
The index fails to load correctly because the index_time_utc field must be defined in the index pattern.
Resolution:
Complete the following steps to update the index pattern.
- Log in to the ESA Web UI.
- Navigate to Audit Store > Dashboard.
- From menu on the Audit Store Dashboards page, navigate to Management > Dashboard Management > Index patterns.
- Click pty_insight_analytics_miscellaneous_* and click the Remove index pattern icon.
- Click Delete to confirm.
- Click Create index pattern.
- Specify
pty_insight_analytics_miscellaneous_*for the index pattern name. - Click Next step.
- Select index_time_utc for the Time field.
- Click Create index pattern.
- Navigate to the Discover page to view the required logs.
9.3 - ESA Error Handling
ESA appliance collects all logs that come from different Protegrity Servers. The following section explains the logs that you may find and the errors that you may encounter on the ESA.
9.3.1 - ESA Upgrade Readiness Patch Error Messages and Resolutions
This article provides detailed information on error messages and their resolutions related to the ESA Upgrade Readiness Patch for version 10.2.0. It covers various issues such as insufficient disk space, version compatibility, unicast hosts file errors, analytics initialization, and service status checks. Each error message is accompanied by high-level steps for resolving the issue, ensuring a smooth upgrade process to ESA version 10.2.0.
Use the information provided in this section for the detailed steps to resolve the issues shown by the readiness patch.
Issue: Insufficient Disk Space
ERROR: The required disk space is insufficient for the following partitions:

/ - available: <available_space>%, required: 40%

/opt - available: {opt_available_gb}GB, required: 10GB

/var/log/ - available: <available_space>%, required: 20%
Resolution
The space used in the OS(/) partition should not be more than 60%. If the space used is more than 60%, then you must clean up the OS(/) partition before proceeding with the patch installation process. For more information about cleaning up the OS(/) partition, refer here.
For increasing the /opt partition, perform the steps using Increasing the Appliance Disk Size.
For increasing the size of /var/log directory, perform the steps using Extending the Logs Volume.
Issue: Expected ESA version
ERROR: Expecting appliance version 10.1.x/10.0.x/9.2.0.x/9.1.0.x. Current ESA version {appliance_version}
Resolution
This patch must be applied on any of the following versions:
- 9.1.0.x
- 9.2.0.x
- 10.0.x
- 10.1.x
Issue: Missing IP address in Unicast hosts file
ERROR: Unicast hosts file does not contain the IP addresses of the nodes and is empty. Run the Audit Store Management Unicast Hosts scheduled task.
Applicable Version: 9.1.0.x
Resolution
To run the Audit Store Management Unicast Hosts scheduled task:
Log in to the ESA WebUI.
Navigate to System > Task Scheduler.
Select the Audit Store Management Update Unicast Hosts task.
Click Run now!.
In some ESA versions, the task is named as Audit Store Management - Cluster Config - Sync.
Issue: Unicast hosts file verification failed
ERROR: Unicast IP verification failed. IPs in cluster: {node_ips} IPs in unicast hosts file: {ips}. Verify the entries in the {UNICAST_HOSTS_FILE} file.
ERROR: Unicast hostname verification failed. Retrieved hostname: {hostname}. Verify the entries in the {UNICAST_HOSTS_FILE} file.
ERROR: Unicast hosts file is empty. Please add the IP and hostname entries for all the nodes in the Audit Store cluster in the Unicast hosts file /opt/protegrity/auditstore/config/unicast_hosts.txt
ERROR: Unicast hosts file not found. {UNICAST_HOSTS_FILE}. Create the file with the relevant node IPs.
Applicable Version: 9.2.0.x, 10.x
Resolution
Update the unicast hosts file:
- Obtain the IP and hostname entries of all the ESA nodes in the Audit Store cluster.
- Log in to the CLI Manager on the ESA.
- Navigate to Administration > OS Console.
- Enter the root password.
- Navigate to
/opt/protegrity/auditstore/config. - Open the
unicast_hosts.txtfile using a text editor. - Add and verify the node entries in the file.
- Save and close the file.
Issue: Analytics is not initialized
ERROR: Analytics is not initialized. Please initialize analytics.
Resolution:
Initialize Analytics.
- Log in to the ESA Web UI.
- Verify that the Audit Store services are running by navigating to System > Services > Audit Store.
- Navigate to Analytics. For ESA v10.x, navigate to Audit Store > Initialize Analytics.
- Click Initialize Analytics.
Issue: Insight services not running
ERROR: Analytics service is not running. Please start the service.
ERROR: Audit Store Dashboards service is not running. Please start the service.
ERROR: Audit Store Management service is not running. Please start the service.
ERROR: Audit Store Repository service is not running. Please start the service.
ERROR: Audit Store connection failed, cluster verification cannot proceed.
ERROR: Audit Store connection failed, unicast file verification cannot proceed.
ERROR: Audit Store connection failed. Audit Store Repository service is not running. Please start it to proceed.
ERROR: Audit Store connection failed. Audit Store Repository took too long to respond (00:00:30). <exception-Connection Error>
ERROR: td-agent service is not running. Please start the service.
Resolution:
Enable the Run the following steps to resolve the issue.
- From the ESA Web UI, navigate to System > Services > Audit Store.
- Ensure that the Audit Store Repository service is running.
- Open the ESA CLI.
- Navigate to Tools.
- Run Apply Audit Store Security Configs.
Issue: Audit Store connection failed due to certificates
ERROR: Audit Store connection failed. Certificated expired. Please upload valid certificate.
Resolution:
Upload valid certificates using the steps provided in Uploading Certificates and Insight Certificates.
Issue: The master or repository keys are expired
Validate that master/repository keys are not expired with respect to OUP

"ERROR: Call to check key state failed. Please verify that all services are running" (when hubcontroller is down)

"ERROR: Master or repository key is expired, please rotate the key(s)"
Resolution:
If the security keys, such as, master key or repository key have expired or are due to expire within 30 days, then the upgrade fails. Hence, the keys must be rotated before performing the upgrade. Additionally, ensure that the keys are active and in running state.
For more information about rotating keys, refer to Working with Keys.
If you are using an HSM, ensure that the HSM is accessible and running.
For more information about HSM, refer to the corresponding HSM vendor document.
If the prerequisites are not met, the ESA upgrade process fails. In such a case, it is required to restore the ESA to its previous stable version.
Issue: The active Key Store health check failed
Validate that Key Store is healthy

"ERROR: Call to check HSM health failed. Please verify that all services are running" (when kmgw/ soft hsm service is down)

"ERROR: The health check for active HSM GW instance is failing, please make sure HSM is accessible"
Resolution:
Test the Key Store connection to validate where the Key Store can be accessed using the steps from Key Store Management.
Issue: The license is invalid or expired
Validate that license is valid (expired/invalid)

"ERROR: License is not valid"

"ERROR: Failed to check license. Please verify that Policy Management services are running" (when hubcontroller is down)
Resolution:
Before upgrading the ESA, ensure that the license is not expired or invalid.
An expired or invalid license blocks policy services on the ESA and Devops API’s. A new or existing protector will not receive any policies until a valid license is applied.
For more information about the license, refer Protegrity Data Security Platform Licensing.
Warning: List of unsupported protectors connected with the ESA
Check for unsupported protectors
Installation pre-checks have detected protector versions that under specific circumstances pose a potential risk

"ERROR: Failed to list unsupported protectors" (When hubcontroller is down)
Resolution:
The ESA v10.2.0 only supports protectors having the PEP server version 1.2.2+42 and later.
During the upgrade, the process checks if any unsupported protector is registered in the system.
If the Installation pre-check script detects any protector that is not supported by the ESA v10.2.0, then the Warning dialog box appears.
You can either terminate the Upgrade process or you can continue with unsupported protectors.
It is recommended to upgrade the protectors to a supported version before proceeding with the Upgrade process.
Perform the following steps to identify the PEP server version of the protector:
- Log in to the ESA.
- Navigate to Policy Management > Nodes.
- View the Version field for all the protectors.
If the protector version is unsupported, perform one of the following actions:
- Uninstall the unsupported protector and delete the node from the list of registered nodes.
- Upgrade the unsupported protector to a supported version. For most of the protectors, this process involves uninstalling and installing the protectors. However, some protectors, such as Data Security Gateway (DSG) and Big Data Protector (BDP), might support the upgrade process. The new installed protector updates the registered node entry.
Issue: DTP/DTP2 data elements are present
Validate that no DTP/DTP2 data elements are present

"ERROR: Found unsupported DTP data elements"

"ERROR: Failed to establish a new connection to the HubController service"
Resolution:
If the DTP/DTP2 is present in the algorithm property of a data element while upgrading from the ESA v9.1.0.x or later versions to ESA v10.2.0, then the upgrade script fails. The following error message appears:
ERROR: Found unsupported DTP data elements
Perform the following actions:
- Reprotect data with a new data element that is supported.
- Remove the data elements that contain DTP/DTP2 algorithm.
This prevents the data loss that occurs during the upgrade. The DTP/DTP2 data elements are now unsupported.
For more information about the data elements to be used, contact Protegrity Support.
Issue: FPE data elements are present
Validate that no FPE data elements with left/right > 0 are present

"ERROR: FPE Data Element(s) with characters in clear ('From Left' / 'From Right') are no longer supported on the target version. Please consult the documentation or Protegrity staff for guidance. Data Element(s) affected: "

"ERROR: Failed to list FPE Data Elements"
Resolution:
If the format-preserving encryption (FPE) data elements with Left and Right settings are present while upgrading from the ESA v9.1.0.x or later versions to ESA v10.2.0, then the upgrade script fails. The following error message appears:
ERROR: FPE Data Element(s) with characters in clear ('From Left' / 'From Right') are no longer supported on the target version.
   Please consult the documentation or Protegrity staff for guidance.
   Data Element(s) affected: <List of affected data elements>
Perform the following actions:
- Reprotect data with a new FPE data element that does not have Left and Right settings or a new data element that is supported.
- Remove the data elements that contain Left and Right settings.
This prevents the data loss that occurs during the upgrade. The FPE data elements with Left and Right settings are now unsupported.
For more information about the data elements to be used, contact Protegrity Support.
9.3.2 - Common ESA Logs
| Log type | Details | Logs Description |
|---|---|---|
Appliance logs ESA Web Interface, | Here you can view appliance system logs. These logs are saved for two weeks, and then they are automatically deleted. | The ESA appliance logs the appliance-specific system
events:
|
| Data Management Server (DMS) logs ESA Web Interface, | Here you can view DMS system related logs:
| System logs related to monitoring and maintenance of the Logging Repository (DMS). |
9.3.3 - Common ESA Errors
Table: ESA Common Errors
Error /Problem | This may happen because… | Recovery Actions |
While ESA is running, some services stop abruptly. | This issue occurs when the ESA OS partition is completely full. When the disk space gets full, there is an impact on the services that are running. These services encounter a shortage of resources, and hence, stop abruptly. | Perform the following steps to resolve this issue.
|
After upgrading the ESA to v10.2.0, the Label of ESA node in the TAC is not Consul Server or Consul Client | This issue occurs when the ESA is upgraded to v10.2.0, and the Label of ESA node in the TAC is not Consul Server or Consul Client. This may impact the functionality of the TAC. | Perform the following steps to resolve this issue.
|
From v10.2.0, all the packages, including the Protegrity developed packages, are signed by Protegrity. This ensures the integrity of the software being installed.The following errors may occur while uploading the patch using Web UI or CLI Manager. The patch is signed by Protegrity signing key and the verification key is expired | This issue occurs if the verification key is expired, the following error message appears:Error: Patch signature(s) expired. Would you like to continue installation? |
|
The patch is not signed by Protegrity signing key | This issue occurs if the patch is not signed by Protegrity signing key.Error: Signatures not found. Aborting | Click Exit to terminate the installation process.It is recommended to use a Protegrity signed patch.For more information about the Protegrity signed patch, contact Protegrity Support. |
Insufficient disk space in the /var/log directory | This issue occurs if the disk space in the /var/log directory is insufficient.Error: Unable to install the patch. The required disk space is insufficient for the following partition: /var/log | Ensure that at least 20% disk space in the /var/log directory is available to install the patch successfully. |
Insufficient disk space in the /opt/ directory | This issue occurs if the disk space in the /opt/ directory is insufficient.Error: Unable to install the patch. The required disk space is insufficient for the following partition: /opt/ | Ensure that the available disk space in the /opt/tmp directory is at least twice the patch size. |
Insufficient disk space in the /OS directory | This issue occurs if the disk space in the /OS directory is insufficient. | Ensure that at least 40% disk space in the _/OS_ directory is available to install the patch successfully.The space used in the OS(/) partition should not be more than 60%. If the space used is more than 60%, then you must clean up the OS(/) partition before proceeding with the patch installation process.For more information about cleaning up the OS(/) partition, refer to the documentation available at the following link.https://my.protegrity.com/knowledge/ka0Ul0000000a9xIAA/ |
Unable to export the information while executing the cluster task using the IP address of the node. | This might occur if the task is executed using the IP address of the cluster task instead of the Hostname. | To resolve this issue, ensure that the IP address of the cluster node is replaced with the Hostname in the task.
For more information about executing the cluster task, refer [Scheduling Configuration Export to Cluster Tasks](/docs/aog/web_user_interface_management/aog_system_webui/aog_schedule_tasks/aog_schedule_cluster_tasks). |
If you try to perform operations, such as, joining a cluster, exporting data/ configuration to a remote appliance, and so on , the operation fails with the following error:Errorcode: 403 | This issue occurs if the Basic Authentication is disabled, and you try to perform any of the following operations.
| Ensure that the Can Create JWT Token permission is assigned to the role. If the Can Create JWT Token permission is not assigned to the role of the required user, then the operation fails. To verify the Can Create JWT Token permission, from the ESA Web UI navigate to Settings > Users > Roles. |
In the ESA CLI, when you copy files to
home directories (/ Permission denied:home/service_admin,
/home/local_admin, or /home/service_viewer) using the
Put Files for the option under Trusted
Appliance Cluster, a following traceback error
appears. | The user does not have the permission
to copy the file to the target directory. | Perform the following steps to copy the
files to the home directory:
The files are deployed to the target
node. |
When you run a cluster export task, the
following message appears for all the target nodes: Host Denied | Perform the following steps:
On the Web UI, refresh the trusted
appliance cluster screen. | |
When exporting or importing custom
files, the export import process fails. | The file that is exported does not
exist. | You can perform one of following
options:
Run the export process. |
While uploading a file from the Web UI
the following error appears: Proxy
Error Reason: Error reading
from remote server | The file is not uploaded to the
server. | Perform one of the following methods..
|
A failure occurs while extending the OS
or logs partition. |
| |
While extending the OS partition, the
following message appears: Couldn't find device with uuid <ID> Cannot change VG <volume group> while PVs are missing | Run the following command and press
ENTER: #vgreduce -removemisssing
<volumegroup> | |
When a role is deleted, the users
associated with the role are not updated. The deleted role appears
on user list in the User Management screen. For example, role name appears in the
following format: <Role
name><Random number> | Delete the user from the
User Management screen. If required, add a
user with the same name and credentials. | |
When you are importing a file from System → Backup & Restore → Import, the following error appears: Bad
Gateway The proxy server received an invalid response from an
upstream server | The size of the file is more than the value in the Max File Upload Size. | Perform the following steps to increase the file upload
size:
|
| The Linux Host ID does not change in an ESA or a DSG instance created on the AWS cloud platform. | The Linux Host ID and the Protegrity Host ID are generated after an ESA or DSG instance is created on the AWS cloud platform. As per the expected behaviour of the appliance, only the Protegrity Host ID is modified after running the appliance rotation tool on the ESA or the DSG instance. | Perform the following steps to modify the Linux Host ID:
|
The SSH session is terminated during the creation of a
bond on the ethMNG interface. | Restart the session after the NIC bond on the ethMNG NIC
is created. | |
The slave NICs do not have an IP assigned, but the
following message appears during creating a bond: NIC
Bonding is not available | The NICs might be on the DHCP mode. | Convert the NICs to Static mode. |
The Web UI is not accessible after the NICs are
bonded. | Reset the Network Bonding from the CLI Manager and bond
the NICs again. For more information about resetting the NIC
bonding, refer to the Appliance Overview Guide. | |
During binding NICs, the following message
appears. Unknown Error | This might occur if the network is slow. | Restart the appliance queues using the following
command: /etc/init.d/appliance-queues server restart |
When you enable Two-Factor Authentication and export
data from one ESA to another, the export process
fails. | You must create two separate scheduler tasks to export
data. First you must export the LDAP settings. Then, you must
export the OS settings. | |
When you remove an appliance from the cluster is
removed, a warning that the appliance is the last leader of the
server of the cluster appears. | The appliance that is the last server of the cluster
cannot be removed as all the clients are connected to it for
receiving cluster-related information. Removing the last server
from the cluster might de-stabilize the cluster. | NA |
You cannot add an appliance to the cluster. | Certificates are not valid. | Ensure that you assign a valid server and CA
certificates on the appliance. For more information about
validating certificates, refer the Certificate Management
Guide. |
When you join an appliance to the cluster, the process
is not completed, and a following error appears in the
logs: Error: [WARNING] No Consul node is available as
join target! | The Consul service is not available. | Perform the following steps to remove the Consul labels
for the appliance:
|
When you simultaneously remove multiple appliances from
a cluster, the following error appears in the
logs: Failed To Update KV Store. | Remove the appliances separately from the cluster and
refresh the Trusted Appliances Cluster screen. | |
When you remove a node from the cluster the following
error appears on the screen: RunNow error: [object
Object] errorThrown: error | Perform the following steps to remove the Consul labels
for the appliance:
| |
When you create a cluster, the following error appears
on the screen: Failed to join. Error: “Cannot get/parse
target cluster config file. Please make sure the target node’s
cluster is enabled. | The SSH configuration on the target machine is
incorrect. | Ensure that the Authentication Type on the SSH
configuration manager screen is set to Password +
PublicKey. Perform the following steps:
|
The following error is observed in the logs: /dev/shm/heardbeat/servers File Doesn't exists | When a Set ESA Communication is established, the
heartbeat service checks for the ESA's that are available. If the
heartbeat is not established, the file is not generated, and the
error appears. | There is no functional impact on the appliance. This
error can be ignored. |
In the System File page, when you modify, upload, or
reset a file, the ownership of the file changes from local user
such as, service_admin user to the
root user.The ownership of the files
in the following file groups change:
| Perform the following commands to change the ownership
of the file
| |
In the System File page, when you modify, upload, or
reset a file, the ownership of the file changes from local user
such as, www-data user to the
root user.The ownership of the files
in the following file group changes:
| Perform the following commands to change the ownership
of the file:
| |
On the ESA Web UI, run the the export-import procedure
to a file or a cluster by selecting the Log-Repository
Server option. The following error appears on the
Forensics screen: Internal Error:
Invalid input provided | Perform the following steps:
| |
When you upload a patch on the Web UI, the following
message appears on the Web UI. The file cannot be
uploaded as it may be infected |
| |
| The update of the antivirus database fails. | Complete the following steps:
| |
| The Proxy Authentication service is not visible on the Services screen. | Complete the following steps:
| |
| When you export a report, the following error
appears. Error Message There was an error on the server.
Try again or contact site administrators. or Internal server error occurred. Please contact your
system administrator. Details: Handler
processing failed; nested exception is
java.lang.NoClassDefFoundError: Could not initialize class
org.apache.batik.bridge.CursorManager | Complete the following steps:
| |
| The following error appears on the logs or the error is
observed when you add a new user. LDAP Failure: {'info':
'operation restricted', 'desc': Server is unwilling to
perform'} | The OS backup procedure was interrupted or not completed. | Restart the OS backup operation by running the following
command from the OS Console:/etc/opt/scripts/after-backup.sh |
| When you add an appliance to the cluster and remove them
immediately from the cluster, the following error appears on the
screen. /etc/init.d/appliance-queues-server: Exception
while calling -.-().Serialize(args=['<ESA IP Address>',
'<username>', '<password>', [u'<ESA IP
Address>', u'<hostname>']],kwargs={}) :#012Traceback
(most recent call last):#012 File
"/usr/local/lib/python/dist-packages/ksa/backend/server.py", line
232, in call_function#012 File
"/usr/local/lib/python/dist-packages/ksa/backend/server.py", line
120, in call_serialized_function#012 File "<string>", line
1, in <module>#012 File
"/opt/cluster/cluster_operations.py", line 144, in _join#012
password=target_password, comm_methods=communication_methods)#012
File "/etc/opt/Cluster/clustermgr.py", line 1066, in
JoinCluster#012 File "/etc/opt/Cluster/clustermgr.py", line 1400,
in _JoinCluster#012ClusterException: Failed to add the requested
cluster-node: Node id gZ68G4kWoOdMoWxj already
exists | The status of the nodes are not updated after you immediately add a remove an appliance from the cluster. | When you add or remove a node from a cluster, the updates are propagated across all appliances in the cluster. The wait time for this process is approximately one minute. You must wait for a minute before performing any action on the cluster. |
After performing a delete operation from the
Files screen, you are unable to reset the
following files:
| When you delete a file from the Files screen, the files are
backed up in the
/etc/configuration-files-backup directory.
You can restore them by copying the files from the backup
directory to the original directory. In the OS Console of the CLI
Manager, run the copy or
move command to restore the file from the
backup directory to the original directory. The original directory
of the files are as follows:
| |
| When the Appliance OS keys rotation process is run, the
following error appears. Failed to set admin password.
Error : LDAP Error: {'desc': Invalid credentials'} and
Failed to set viewer password. Error : LDAP Error: {'desc':
Invalid credentials'} | The appliance keys are rotated after the Set ESA communication process is performed. | Perform the following steps:
|
| On the Web UI, when you navigate Settings → Network → Web Settings and click Update under the
SSL Cipher Settings tab, the following
error appears. Fail to update Cipher Settings, please
check events | The DES-CBC3-SHA cipher suite is not supported | Perform one of the following steps:
|
| During the reinitialization of the finalization an
instance, the following message is displayed. Finalization is already in
progress. However, the finalization of the instance
is not completed. | During the finalization an instance, if the session was
interrupted, then the instance will become unstable. If you
reinitialize the finalization on the same instance, the system
will not be able to process the finalization process. | NA |
| While restoring a VM using the 'Creating a new virtual
machine' procedure, the following error is observed: UserErrorInvalidManagedDiskOperation | While restoring a virtual machine using recovery services vaults, the Instance size of VM inherits the Instance Size that is specified while creating the instance from which backup is taken. If this instance size that is used to create the instance is insufficient, the error is displayed. |
|
After a TAC is created, an status Unknown
is displayed. | The Authentication type on the SSH screen is set to Password. | Set the Authentication Type to Password + PublicKey or Public key |
On the ESA Web UI, navigate to System → Files. When you edit
exampleusers.txt the or
examplegroups.txt files, the following error
appears.Failed to retrieve product file from the
server | The files might contain a \U
character |
|
On the Web UI, reset password for the
ldap_bind_user account. When you refresh the
User Management screen, the following message appears:No
Users available Also, an LDAP user cannot log in to
the appliance from the CLI Manager or Web UI. | Perform the following steps:
| |
In a Primary ESA of a TAC, when you navigate to External
Groups screen, the following message appears.Failed to fetch data from External Groups. Try refreshing the page | The following JSON files in
/opt/externallookup/data whose size are 0
KB:
| Delete the mentioned files. This issue mainly occurs if the
size the /opt partition is full. Ensure that
you maintain the required space in the /opt
partition by keeping only the relevant files in it. |
When you run the Full OS Backup operation from the Web UI,
the following message appears.Unauthorised User | Perform the following steps:
| |
When removing a remote node from the cluster, uninstalling
the cluster services, or performing a leave cluster operation on
the Web UI, the following message appears.Error! Failed to leave cluster: LeaveCluster <IP address>: The node cannot leave the cluster as it has existing associated tasks. | Delete all the tasks associated with the node before removing the node from the cluster. | |
On the Azure and the GCP instances, when you reset the
password from the CLI manager for a user, you get the following
error message:Login failure - 'failed to authenticate user: Insufficient privileges' | Azure and GCP instances do not support reset password in the CLI manager. You must reset passwords only from the Web UI. | |
When the listening address of the SNMPD port is changed,
the following error appears on the Web UI:SNMP Service started failed | The assigned port is already configured for SNMPTRAPD. | It is recommended to not use the listening address which is already assigned and configured for other ports. |
When the listening address of the SNMPD port is set as an
invalid value (example: abcd), the following error appears on the
Web UI:SNMP Service started failed | It is recommended to not set invalid listening address for the ports. | |
When the cluster node label is updated in the CLI Manager
under Tools → TAC → Node Management → Update Cluster Information, the Appliance logs on the Web UI show the
following
traceback:/etc/init.d/appliance-cluster-status:
Cluster-AutoUpdate:Exception while updating cluster-status:
(<type 'exceptions.ValueError'>, ValueError('list.remove: x
not in list',), <traceback object at
0x7f26293a5d40> | To remove the traceback from the Appliance logs, remove
the custom labels added for the cluster nodes. To update the
cluster node label, perform the following steps:
The label for the cluster node is updated. | |
| When you try to revoke Two-Factor Authentication shared secret for per user shared secret setting, the operation fails | This may happen if the username
contains special characters. | To revoke the shared secrets, perform the following
steps.
|
The logrotate task fails
intermittently with the following error.
Cloud gateway logrorate failed with error: error renaming temp state file /var/lib/logrotate/status.tmpHowever,
the logs are rotated successfully. | The logrotate task maintains a
temporary file which is common for all logrotate operations.When the logrotate script is executed, it
updates the temporary file, renames the temporary file, and
rotates the logs successfully. Simultaneously, if another
logrotate operation is triggered, then it is
unable to find the temporary file as it was updated and renamed
during the previous logrotate operation. This
results in the logrotate task
failure. | To resolve the logrotate task fail
error, perform the following steps.
|
| When you access Help from the CLI Manager, you are not able to exit from the CLI Help menu. | To exit from the CLI Manager Help menu, you can:
| |
When you log in to the ESA instance in either AWS or GCP,
the following error appears.WARNING: Failed to find a usable hardware address from the network interfaces; using random bytes: 1b:1f:ff:64:9b:b6:ea:ce | The licenses generated are not locked to the MAC address of the ESA machine. | You must contact Protegrity support to generate a license file that is linked to the MAC address of the ESA machine. |
When you execute the Antivirus daily update, a high
severity log event is generated, and the following error message
appears.Anti-Virus database update has failed. | The Anti-virus program connects to the
clamav web and check for updates. If there
are no update available for download, then the task is executed
and a high severity log event is generated. | Run the task manually. Perform the
following steps:
|
| On ESA or appliance based product, after you reboot the
system, the service dispatcher stops. It does not starts even
after performing the operation manually. The status of
/etc/init.d/service_dispatcher shows
running on OS Console.
However, if you navigate to Administration → Services from the CLI Manager, then
the status appears as stopped. | This might occur when the
"/usr/local/pty-apache/var/run/apache2/httpd.pid"
file is present. | Perform the following steps:
|
When you rotate the appliance OS keys, no error log event
is generated, however, the following error message appears on the
screen.Failed to apply all the changes. Please accept all the changes from the Web UI | Perform the following steps:
| |
After creating the backup of the system, if you modify
the the authorized keys, then the ESA overwrites the updated keys
while performing the import operation. However, after
creating the backup of the system, if you add new users and their
authorized keys, then the ESA will include them in the system
after you perform the import operation. By default, the ESA will
append the new users and their corresponding keys. | Delete the new users and their corresponding keys from
the system, if they are not required. For more information
about deleting keys, refer to Deleting an Authorized
Key in the Protegrity Appliance Overview Guide
9.1.0.0. | |
| On the Azure and GCP cloud platforms, if a new machine is created using a snapshot of the disk, then the machine is not reachable. | When you create a machine using a snapshot of the disk, then the routing tables are not updated. | To resolve this issue, restart the network settings for the
new machine. To restart the network settings, perform the
following steps:
|
Unable to export the information while executing the
cluster task using the IP address of the
node. | This might occur if the task is executed using the
IP
address
of the cluster task instead of the
Hostname. | To resolve this issue, ensure that the IP
address of the cluster node is replaced with the
Hostname in the task.For more information
about executing the cluster task, refer to Scheduling
Configuration Export to Cluster Tasks in the
Protegrity Appliance Overview Guide 9.2.0.0. |
After upgrading the ESA, the
webservices stays in the
stop state and the WEB UI is
inaccessible. | This might happen due to duplicate entries of localhost and
ESA IP in the /etc/hosts file. | If the ESA IP, ESA domain name and FQDN are already present
in the /etc/hosts file, then do not add these
details in the /etc/ksa/hosts.append
file.Avoid editing the /etc/hosts file.
Changes should be done only in the
/etc/ksa/hosts.append file.Add the
details to the /etc/ksa/hosts.append file and
then restart the networking services. The changes will be
reflected in the /etc/hosts file. |
When upgrading the ESA, the upgrade fails with the
following error: Call to check key state failed. Please verify that all services are running. | This might happen due to the GPG Public Key used to sign
Debian packages embedded in Protegrity appliances expired on April
9, 2024. The appliances installed before this date will continue
to function, however issues will occur when upgrading or applying
any maintenance patches to these appliances. | To avoid this issue, it is recommended to apply the
PAP_PAP-ALL-64_x86-64_Generic.V-6.pty patch
to extend the expiry date of the GPG Public Key used to sign
Debian packages embedded in Protegrity appliances. This patch must
be applied before applying maintenance releases or upgrading the
ESA.For more information, refer the following GPG
Public Key Expiration announcement on
My.Protegrity.com portal. |
9.3.4 - Understanding the Insight indexes
All the Appliances and Protectors send logs to Insight. The logs from the Audit Store are displayed on the Discover screen of the Audit Store Dashboards. Here, you can view the different fields logged. In addition to viewing the data, these logs serve as input for Insight to analyze the health of the system and to monitor the system for providing security. These logs are stored in the Audit index with the name, such as, pty_insight_analytics_audit_9.2-*. To refer to old and new audit indexes, the alias pty_insight_*audit_* is used.
The /var/log/asdashboards.log file is empty. The init.d logs for the Audit Store Dashboards are available in /var/log/syslog. The container-related logs are available in /var/log/docker/auditstore_dashboards.log.
You can view the Discover screen by logging into the ESA and navigating to Audit Store > Dashboard > Open in new tab, select Discover from the menu, and select a time period such as Last 30 days. The Discover screen appears.

The following table lists the various indexes and information about the data contained in the index. You can view the index list by logging into the ESA, and navigating to Audit Store > Cluster Management > Overview > Indices. Indexes can be created or deleted. However, deleting an index will lead to a permanent loss of data in the index. If the index was not backed up earlier, then the logs from the index deleted cannot be recreated or retrieved.
| Index Name | Origin | Description |
|---|---|---|
| .kibana_1 | Audit Store | This is a system index created by the Audit Store. This hold information about the dashboards. |
| .opendistro_security | Audit Store | This is a system index created by the Audit Store. This hold information about the security, roles, mapping, and so on. |
| .opendistro-job-scheduler-lock | Audit Store | This is a system index created by the Audit Store. |
| .opensearch-notifications-config | Audit Store | This is a system index created by the Audit Store. |
| .opensearch-observability | Audit Store | This is a system index created by the Audit Store. |
| .plugins-ml-config | Audit Store | This is a system index created by the Audit Store. |
| .ql-datasources | Audit Store | This is a system index created by the Audit Store. |
| pty_auditstore_cluster_config | ESA | This index logs logs information about the Audit Store cluster. |
| pty_insight_analytics_audit | ESA | This index logs the audit data for all the URP operations and the DSG appliance logs. It also captures all logs with the log type protection, metering, audit, and security. |
| pty_insight_analytics_autosuggestion | ESA | This index holds the autocomplete information for querying logs in Insight. The index was used in earlier versions of ESA. |
| pty_insight_analytics_crons | ESA | This index logs information about the cron scheduler jobs. |
| pty_insight_analytics_crons_logs | ESA | This index logs for the cron scheduler when the jobs are executed. |
| pty_insight_analytics_dsg_error_metrics | DSG | This index logs the DSG error information. |
| pty_insight_analytics_dsg_transaction_metrics | DSG | This index logs the DSG transaction information. |
| pty_insight_analytics_dsg_usage_metrics | DSG | This index logs the DSG usage information. |
| pty_insight_analytics_encryption_store | ESA | This index encrypts and stores the password specified for the jobs. |
| pty_insight_analytics_forensics_custom_queries | ESA | This index stores the custom queries created for forensics. The index was used in earlier versions of ESA. |
| pty_insight_analytics_ilm_export_jobs | ESA | This index logs information about the running ILM export jobs. |
| pty_insight_analytics_ilm_status | ESA | This index logs the information about the running ILM import and delete jobs. |
| pty_insight_analytics_kvs | ESA | This is an internal index for storing the key-value type information. |
| pty_insight_analytics_miscellaneous | ESA | This index logs entries that are not categorized in the other index files. |
| pty_insight_analytics_policy | ESA | This index logs information about the ESA policy. It is a system index created by the ESA. |
| pty_insight_analytics_policy_log | ESA | This index logs for the ESA policy when the jobs are executed. |
| pty_insight_analytics_policy_status_dashboard | ESA | The index holds information about the policy of the protectors for the dashboard. |
| pty_insight_analytics_protector_status_dashboard | ESA | This index holds information about the 10.0.0 protectors for the dashboard. |
| pty_insight_analytics_protectors_status | Protectors | This index holds the status logs of version 10.0.0 protectors. |
| pty_insight_analytics_report | ESA | This index holds information for the reports created. The index was used in earlier version of ESA. |
| pty_insight_analytics_signature_verification_jobs | ESA | This index logs information about the signature verification jobs. |
| pty_insight_analytics_signature_verification_running_jobs | ESA | This index logs information about the signature verification jobs that are currently running. |
| pty_insight_analytics_troubleshooting | ESA | This index logs the log type application, kernel, system, and verification. |
9.3.5 - Understanding the index field values
Common Logging Information
These logging fields are common with the different log types generated by Protegrity products.
Note: These common fields are used across all log types.
| Field | Data Type | Description | Source | Example |
|---|---|---|---|---|
| cnt | Integer | The aggregated count for a specific log. | Protector | 5 |
| logtype | String | The type of log. For example, Protection, Policy, Application, Audit, Kernel, System, or Verification.For more examples about the log types, refer here. | Protector | Protection |
| level | String | The level of severity. For example, SUCCESS, WARNING, ERROR, or INFO. These are the results of the logging operation.For more information about the log levels, refer here. | Protector | SUCCESS |
| starttime | Date | This is an unused field. | Protector | |
| endtime | Date | This is an unused field. | Protector | |
| index_time_utc | Date | The time the log was inserted into the Audit Store. | Audit Store | Sep 8, 2024 @ 12:55:24.733 |
| ingest_time_utc | Date | The time the Log Forwarder processed the logs. | Log Forwarder | Sep 8, 2024 @ 12:56:22.027 |
| uri | String | The URI for the log. This is an unused field. | ||
| correlationid | String | A unique ID that is generated when the policy is deployed. | Hubcontroller | clo5nyx470bi59p22fdrsr7k3 |
| filetype | String | This is the file type, such as, regular file, directory, or device, when operations are performed on the file. This displays the value ISREG for files and ISDIR for directories. This is only used in File Protector. | File Protector | ISDIR |
| index_node | String | The index node that ingested the log. | Audit Store | protegrity-esa746/192.168.2.20 |
| operation | String | This is an unused field. | ||
| path | String | This field is provided for Protector-related data. | File Protector | /hmount/source_dir/postmark_dir/postmark/1 |
| system_nano_time | Long | This displays the time in nano seconds for the Signature Verification job. | Signature Verification | 255073580723571 |
| tiebreaker | Long | This is an internal field that is used with the index time to make a record unique across nodes for sorting. | Protector, Signature Verification | 2590230 |
| _id | String | This is the entry id for the record stored in the Audit Store. | Log Forwarder, td-agent | NDgyNzAwMDItZDI5Yi00NjU1LWJhN2UtNzJhNWRkOWYwOGY3 |
| _index | String | This is the index name of the Audit Store where the log is stored. | Log Forwarder, td-agent | pty_insight_analytics_audits_10.0-2024.08.30-000001 |
Additional_Info
These descriptions are used for all types of logs.
| Field | Data Type | Description | Source | Example |
|---|---|---|---|---|
| description | String | Description about the log generated. | All modules | Data protect operation was successful, Executing attempt_rollover for |
| module | String | The module that generated the log. | All modules | .signature.job_runner |
| procedure | String | The method in the module that generated the log. | All modules | create_job |
| title | String | The title for the audit log. | DSG | DSG’s Rule Name INFO : DSG Patch Installation - User has chosen to reboot system later., Cloud Gateway service restart, and so on.# |
Process
This section describes the properties of the process that created the log. For example, the protector or the rputils.
| Field | Data Type | Description | Source | Example |
|---|---|---|---|---|
| thread_id | String | The thread_id of the process that generated the log. | PEP Server | 3382487360 |
| id | String | The id of the process that generated the log. | PEP Server | 41710 |
| user | String | The user that runs the program that generated the log. | All modules | service_admin |
| version | String | The version of the program or Protector that generated the log. | All modules | 1.2.2+49.g126b2.1.2 |
| platform | String | The platform that the program that generated the log is running on. | PEP Server | Linux_x64 |
| module | String | The module that generated the log. | ESA, Protector | rpstatus |
| name | String | The name of the process that generated the log. | All modules | Protegrity PEP Server |
| pcc_version | String | The core pcc version. | PEP Server | 3.4.0.20 |
Origin
This section describes the origin of the log, that is, from where the log came from and when it was generated.
| Field | Data Type | Description | Source | Example |
|---|---|---|---|---|
| time_utc | Date | The time in the Coordinated Universal Time (UTC) format when the log was generated. | All modules | Sep 8, 2024 @ 12:56:29.000 |
| hostname | String | The hostname of the machine where the log was generated. | All modules | ip-192-16-1-20.protegrity.com |
| ip | IP | The IP of the machine where the log was generated. | All modules | 192.168.1.20 |
Protector
This section describes the Protector that generated the log. For example, the vendor and the version of the Protector.
Note: For more information about the Protector vendor, family, and version, refer here.
| Field | Data Type | Description | Source | Example |
|---|---|---|---|---|
| vendor | String | The vendor of the Protector that generated the log. This is specified by the Protector. | Protector | DSG |
| family | String | The Protector family of the Protector that generated the logs. This is specified by the Protector. For more information about the family, refer here. | Protector | gwp |
| version | String | The version of the Protector that generated the logs. This is specified by the Protector. | Protector | 1.2.2+49.g126b2.1.2 |
| core_version | String | This is the Core component version of the product. | Protector | 1.2.2+49.g126b2.1.2 |
| pcc_version | String | This is the PCC version. | Protector | 3.4.0.20 |
Protection
This section describes the protection that was done, what was done, the result of the operation, where it was done, and so on.
| Field | Data Type | Description | Source | Example |
|---|---|---|---|---|
| policy | String | The name of the policy. This is only used in File Protector. | Protector | aes1-rcwd |
| role | String | This field is not used and will be deprecated. | Protector | |
| datastore | String | The name of the datastore used for the security operation. | Protector | Testdatastore |
| audit_code | Integer | The return code for the operation. For more information about the return codes, refer to Log return codes. | Protector | 6 |
| session_id | String | The identifier for the session. | Protector | |
| request_id | String | The ID of the request that generated the log. | Protector | |
| old_dataelement | String | The old dataelement value before the reprotect to a new dataelement. | Protector | AES128 |
| mask_setting | String | The mask setting used to protect data. | Protector | Mask Left:4 Mask Right:4 Mark Character: |
| dataelement | String | The dataelement used when protecting or unprotecting data. This is passed by the Protector performing the operation. | Protector | PTY_DE_CCN |
| operation | String | The operation, for example Protect, Unprotect, or Reprotect. This is passed in by the Protector performing the operation. | Protector | Protect |
| policy_user | String | The policy user for which the operation is being performed. This is passed in by the Protector performing the operation. | Protector | exampleuser1 |
| devicepath | String | The path to the device. This is only used in File Protector. | Protector | /hmount/fuse_mount |
| filetype | String | The type of file that was protected or unprotected. This displays the value ISREG for files and ISDIR for directories. This is only used in File Protector. | Protector | ISREG |
| path | String | The path to the file protected or unprotected by the File Protector. This is only used in File Protector. | Protector | /testdata/src/ez/audit_log(13).csv |
Client
This section describes from where the log came from.
| Field | Data Type | Description | Source | Example |
|---|---|---|---|---|
| ip | String | The IP of the client that generated the log. | DSG | 192.168.2.10 |
| username | String | The username that ran the Protector or Server on the client that created the log. | Hubcontroller | johndoe |
Policy
This section describes the information about the policy.
| Field | Data Type | Description | Source | Example |
|---|---|---|---|---|
| audit_code | Integer | This is the policy audit code for the policy log. | PEP Server | 198 |
| policy_name | String | This is the policy name for the policy log. | PEP Server | AutomationPolicy |
| severity | String | This is the severity level for the policy log entry. | PEP Server | Low |
| username | String | This is the user who modified the policy. | PEP Server | johndoe |
Metering
This section describes the metering log information.
Note: These fields are applicable for Protectors up to v7.2.1. If you upgraded your ESA from v7.2.1 to v9.1.0.0 and migrated the metering audits, then these fields contain data.
Metering is not supported for Protectors v8.0.0.0 and above and these are fields will be blank.
| Field | Data Type | Description | Source | Example |
|---|---|---|---|---|
| meteringmode | String | This is the mode for metering logs, such as, delta or total. | PEP Server | total |
| origin | String | This is the IP from where metering data originated. | PEP Server | 192.168.0.10 |
| protection_count | Double | This is the number of protect operations metered. | PEP Server | 10 |
| reprotection_count | Double | This is the number of reprotect operations metered. | PEP Server | 5 |
| timestamp | Date | This is the UTC timestamp when the metering log entry was generated. | PEP Server | Sep 8, 2020 @ 12:56:29.000 |
| uid | String | This is the unique ID of the metering source that generated the log. | PEP Server | Q2XJPGHZZIYKBPDX5K0KEISIV9AX9V |
| unprotection_count | Double | This is the number of unprotect operations metered. | PEP Server | 10 |
Signature
This section handles the signing of the log. The key that was used to sign the log and the actual checksum that was generated.
| Field | Data Type | Description | Source | Example |
|---|---|---|---|---|
| key_id | String | The key ID of the signingkey that signed the log record. | Protector | cc93c930-2ba5-47e1-9341-56a8d67d55d4 |
| checksum | String | The checksum that was the result of signing the log. | Protector | 438FE13078719ACD4B8853AE215488ACF701ECDA2882A043791CDF99576DC0A0 |
| counter | Double | This is the chain of custody value. It helps maintain the integrity of the log data. | Protector | 50321 |
Verification
This section describes the log information generated for a failed signature verification job.
| Field | Data Type | Description | Source | Example |
|---|---|---|---|---|
| doc_id | String | This is the document ID for the audit log where the signature verification failed. | Signature Verification | N2U2N2JkM2QtMDhmYy00OGJmLTkyOGYtNmRhYzhhMGExMTFh |
| index_name | String | This is the index name where the log signature verification failed. | Signature Verification | pty_insight_analytics_audits_10.0-2024.08.30-000001 |
| job_id | String | This is the job ID of the signature verification job. | Signature Verification | 1T2RaosBEEC_iPz-zPjl |
| job_name | String | This is the job name of the signature verification job. | Signature Verification | System Job |
| reason | String | This is the audit log specifying the reason of the signature verification failure. | Signature Verification | INVALID_CHECKSUM | INVALID_KEY_ID | NO_KEY_AND_DOC_UPDATED |
9.3.6 - Index entries
Audit index
The log types of protection, metering, audit, and security are stored in the audit index. These log are generated during security operations. The logs generated by protectors are stored in the audit index with the name as shown in the following table for the respective version.
| ESA version | Index pattern | Description | Example |
|---|---|---|---|
| ESA v10.2.0 | pty_insight_analytics_*audits* | Use in the Audit Store Dashboards for viewing v10.2.0 logs on the dashboard. | pty_insight_analytics_audits_10.0-2024.08.30-000001 |
| v9.2.0.0 and earlier | pty_insight_*audit_* | Use in the Audit Store Dashboards for viewing older release logs on the dashboard. | pty_insight_analytics_audit_9.2-2024.08.07-000001, pty_insight_audit_v9.1-2028.02.10-000019, pty_insight_audit_v2.0-2022.02.19-000006, pty_insight_audit_v1.1-2021.02.17-000001, pty_insight_audit_v1-2020.12.21-000001 |
| v8.0.0.0 and above | pty_insight_*audit* | Use in the Audit Store Dashboards for viewing all logs. | pty_insight_analytics_audits_10.0-2024.08.30-000001, pty_insight_analytics_audit_9.2-2024.08.07-000001, pty_insight_audit_v9.1-2028.02.10-000019, pty_insight_audit_v2.0-2022.02.19-000006, pty_insight_audit_v1.1-2021.02.17-000001, pty_insight_audit_v1-2020.12.21-000001 |
The following parameters are configured for the index rollover in v10.2.0:
- Index age: 30 days
- Document count: 200,000,000
- Index size: 5 GB
Protection logs
These logs are generated by protectors during protecting, unprotecting, and reprotecting data operations. These logs are generated by protectors, such as, DSG.
Use the following query in Discover to view these logs.
logtype:protection
A sample log is shown here:
 {
    "process": {
      "thread_id": "1227749696",
      "module": "coreprovider",
      "name": "java",
      "pcc_version": "3.6.0.1",
      "id": "4190",
      "user": "user4",
      "version": "10.0.0-alpha+13.gef09.10.0",
      "core_version": "2.1.0+17.gca723.2.1",
      "platform": "Linux_x64"
    },
    "level": "SUCCESS",
    "signature": {
      "key_id": "11a8b7d9-1621-4711-ace7-7d71e8adaf7c",
      "checksum": "43B6A4684810383C9EC1C01FF2C5CED570863A7DE609AE5A78C729A2EF7AB93A"
    },
    "origin": {
      "time_utc": "2024-09-02T13:55:17.000Z",
      "hostname": "hostname1234",
      "ip": "10.39.3.156"
    },
    "cnt": 1,
    "protector": {
      "vendor": "Java",
      "pcc_version": "3.6.0.1",
      "family": "sdk",
      "version": "10.0.0-alpha+13.gef09.10.0",
      "core_version": "2.1.0+17.gca723.2.1"
    },
    "protection": {
      "dataelement": "TE_A_S13_L1R2_Y",
      "datastore": "DataStore",
      "audit_code": 6,
      "operation": "Protect",
      "policy_user": "user1"
    },
    "index_node": "protegrity-esa399/10.39.1.23",
    "tiebreaker": 210,
    "logtype": "Protection",
    "additional_info": {
      "description": "Data protect operation was successful"
    },
    "index_time_utc": "2024-09-02T13:55:24.766355224Z",
    "ingest_time_utc": "2024-09-02T13:55:17.678Z",
    "client": {},
    "correlationid": "cm0f1jlq700gbzb19cq65miqt"
  },
  "fields": {
    "origin.time_utc": [
      "2024-09-02T13:55:17.000Z"
    ],
    "index_time_utc": [
      "2024-09-02T13:55:24.766Z"
    ],
    "ingest_time_utc": [
      "2024-09-02T13:55:17.678Z"
    ]
  },
  "sort": [
    1725285317000
  ]
The above example contains the following information:
- additional_info
- origin
- protector
- protection
- process
- client
- protector
- signature
For more information about the various fields, refer here.
Metering logs
These logs are generated by protectors of prior to 8.0.0.0. These logs are not generated by latest protectors.
Use the following query in Discover to view these logs.
logtype:metering
For more information about the various fields, refer here.
Audit logs
These logs are generated when the rule set of the DSG protector gets updated.
Use the following query in Discover to view these logs.
logtype:audit
A sample log is shown here:
 {
   "additional_info.description": "User admin modified default_80 tunnel successfully ",
   "additional_info.title": "Gateway : Tunnels : Tunnel 'default_80' Modified",
   "client.ip": "192.168.2.20",
   "cnt": 1,
   "index_node": "protegrity-esa746/192.168.1.10",
   "index_time_utc": "2024-01-24T13:30:17.171646Z",
   "ingest_time_utc": "2024-01-24T13:29:35.000000000Z",
   "level": "Normal",
   "logtype": "Audit",
   "origin.hostname": "protegrity-cg406",
   "origin.ip": "192.168.2.20",
   "origin.time_utc": "2024-01-24T13:29:35.000Z",
   "process.name": "CGP",
   "process.user": "admin",
   "tiebreaker": 2260067,
   "_id": "ZTdhNzFmMTUtMWZlOC00MmY4LWJmYTItMjcwZjMwMmY4OGZh",
   "_index": "pty_insight_audit_v9.1-2024.01.23-000006"
 }
This example includes data from each of the following groups defined in the index:
- additional_info
- client
- origin
- process
For more information about the various fields, refer here.
Security logs
These logs are generated by security events of the system.
Use the following query in Discover to view these logs.
logtype:security
For more information about the various fields, refer here.
Troubleshooting index
The log types of application, kernel, system, and verification logs are stored in the troubleshooting index. These logs helps you understand the working of the system. The logs stored in this index are essential when the system is down or has issues. This is the pty_insight_analytics_troubleshooting index. The index pattern for viewing these logs in Discover is pty_insight_*troubleshooting_*.
The following parameters are configured for the index rollover:
- Index age: 30 days
- Document count: 200,000,000
- Index size: 5 GB
Application Logs
These logs are generated by Protegrity servers and Protegrity applications.
Use the following query in Discover to view these logs.
logtype:application
A sample log is shown here:
{
    "process": {
      "name": "hubcontroller"
    },
    "level": "INFO",
    "origin": {
      "time_utc": "2024-09-03T10:02:34.597000000Z",
      "hostname": "protegrity-esa503",
      "ip": "10.37.4.12"
    },
    "cnt": 1,
    "index_node": "protegrity-esa503/10.37.4.12",
    "tiebreaker": 16916,
    "logtype": "Application",
    "additional_info": {
      "description": "GET /dps/v1/deployment/datastores | 304 | 127.0.0.1 | Protegrity Client | 8ms | "
    },
    "index_time_utc": "2024-09-03T10:02:37.314521452Z",
    "ingest_time_utc": "2024-09-03T10:02:36.262628342Z",
    "correlationid": "cm0m9gjq500ig1h03zwdv6kok"
  },
  "fields": {
    "origin.time_utc": [
      "2024-09-03T10:02:34.597Z"
    ],
    "index_time_utc": [
      "2024-09-03T10:02:37.314Z"
    ],
    "ingest_time_utc": [
      "2024-09-03T10:02:36.262Z"
    ]
  },
  "highlight": {
    "logtype": [
      "@opensearch-dashboards-highlighted-field@Application@/opensearch-dashboards-highlighted-field@"
    ]
  },
  "sort": [
    1725357754597
  ]
The above example contains the following information:
- additional_info
- origin
- process
For more information about the various fields, refer here.
Kernel logs
These logs are generated by the kernel and help you analyze the working of the internal system. Some of the modules that generate these logs are CRED_DISP, KERNEL, USER_CMD, and so on.
Use the following query in Discover to view these logs.
logtype:Kernel
For more information and description about the components that can generate kernel logs, refer here.
For a list of components and modules and the type of logs they generate, refer here.
A sample log is shown here:
{
    "process": {
      "name": "CRED_DISP"
    },
    "origin": {
      "time_utc": "2024-09-03T10:02:55.059999942Z",
      "hostname": "protegrity-esa503",
      "ip": "10.37.4.12"
    },
    "cnt": "1",
    "index_node": "protegrity-esa503/10.37.4.12",
    "tiebreaker": 16964,
    "logtype": "Kernel",
    "additional_info": {
      "module": "pid=38236",
      "description": "auid=4294967295 ses=4294967295 subj=unconfined msg='op=PAM:setcred grantors=pam_rootok acct=\"rabbitmq\" exe=\"/usr/sbin/runuser\" hostname=? addr=? terminal=? res=success'\u001dUID=\"root\" AUID=\"unset\"",
      "procedure": "uid=0"
    },
    "index_time_utc": "2024-09-03T10:02:59.315734771Z",
    "ingest_time_utc": "2024-09-03T10:02:55.062254541Z"
  },
  "fields": {
    "origin.time_utc": [
      "2024-09-03T10:02:55.059Z"
    ],
    "index_time_utc": [
      "2024-09-03T10:02:59.315Z"
    ],
    "ingest_time_utc": [
      "2024-09-03T10:02:55.062Z"
    ]
  },
  "highlight": {
    "logtype": [
      "@opensearch-dashboards-highlighted-field@Kernel@/opensearch-dashboards-highlighted-field@"
    ]
  },
  "sort": [
    1725357775059
  ]
This example includes data from each of the following groups defined in the index:
- additional_info
- origin
- process
For more information about the various fields, refer here.
System logs
These logs are generated by the operating system and help you analyze and troubleshoot the system when errors are found.
Use the following query in Discover to view these logs.
logtype:System
For a list of components and modules and the type of logs they generate, refer here.
A sample log is shown here:
 {
    "process": {
      "name": "ESAPAP",
      "version": "10.0.0+2412",
      "user": "admin"
    },
    "level": "Low",
    "origin": {
      "time_utc": "2024-09-03T10:00:34.000Z",
      "hostname": "protegrity-esa503",
      "ip": "10.37.4.12"
    },
    "cnt": "1",
    "index_node": "protegrity-esa503/10.37.4.12",
    "tiebreaker": 16860,
    "logtype": "System",
    "additional_info": {
      "description": "License is due to expire in 30 days. The validity of license has been acknowledged by the user. (web-user 'admin' , IP: '10.87.2.32')",
      "title": "Appliance Info : License is due to expire in 30 days. The validity of license has been acknowledged by the user. (web-user 'admin' , IP: '10.87.2.32')"
    },
    "index_time_utc": "2024-09-03T10:01:10.113708469Z",
    "client": {
      "ip": "10.37.4.12"
    },
    "ingest_time_utc": "2024-09-03T10:00:34.000000000Z"
  },
  "fields": {
    "origin.time_utc": [
      "2024-09-03T10:00:34.000Z"
    ],
    "index_time_utc": [
      "2024-09-03T10:01:10.113Z"
    ],
    "ingest_time_utc": [
      "2024-09-03T10:00:34.000Z"
    ]
  },
  "highlight": {
    "logtype": [
      "@opensearch-dashboards-highlighted-field@System@/opensearch-dashboards-highlighted-field@"
    ]
  },
  "sort": [
    1725357634000
  ]
This example includes data from each of the following groups defined in the index:
- additional_info
- origin
- process
For more information about the various fields, refer here.
Verification logs
These log are generated by Insight on the ESA when a signature verification fails.
Use the following query in Discover to view these logs.
logtype:Verification
For a list of components and modules and the type of logs they generate, refer here.
A sample log is shown here:
{
    "process": {
      "name": "insight.pyc",
      "id": 45277
    },
    "level": "Info",
    "origin": {
      "time_utc": "2024-09-03T10:14:03.120342Z",
      "hostname": "protegrity-esa503",
      "ip": "10.37.4.12"
    },
    "cnt": 1,
    "index_node": "protegrity-esa503/10.37.4.12",
    "tiebreaker": 17774,
    "logtype": "Verification",
    "additional_info": {
      "module": ".signature.job_executor",
      "description": "",
      "procedure": "__log_failure"
    },
    "index_time_utc": "2024-09-03T10:14:03.128435514Z",
    "ingest_time_utc": "2024-09-03T10:14:03.120376Z",
    "verification": {
      "reason": "SV_VERIFY_RESPONSES.INVALID_CHECKSUM",
      "job_name": "System Job",
      "job_id": "9Vq1opEBYpV14mHXU9hW",
      "index_name": "pty_insight_analytics_audits_10.0-2024.08.30-000001",
      "doc_id": "JI5bt5EBMqY4Eog-YY7C"
    }
  },
  "fields": {
    "origin.time_utc": [
      "2024-09-03T10:14:03.120Z"
    ],
    "index_time_utc": [
      "2024-09-03T10:14:03.128Z"
    ],
    "ingest_time_utc": [
      "2024-09-03T10:14:03.120Z"
    ]
  },
  "highlight": {
    "logtype": [
      "@opensearch-dashboards-highlighted-field@Verification@/opensearch-dashboards-highlighted-field@"
    ]
  },
  "sort": [
    1725358443120
  ]
This example includes data from each of the following groups defined in the index:
- additional_info
- process
- origin
- verification
For more information about the various fields, refer here.
Policy log index
The log type of policy is stored in the policy log index. They include logs for the policy-related operations, such as, when the policy is updated. The index pattern for viewing these logs in Discover is pty_insight_*policy_log_*.
The following parameters are configured for the policy log index:
- Index age: 30 days
- Document count: 200,000,000
- Index size: 5 GB
Use the following query in Discover to view these logs.
logtype:policyLog
For a list of components and modules and the type of logs they generate, refer here.
A sample log is shown here:
{
    "process": {
      "name": "hubcontroller",
      "user": "service_admin",
      "version": "1.8.0+6.g5e62d8.1.8"
    },
    "level": "Low",
    "origin": {
      "time_utc": "2024-09-03T08:29:14.000000000Z",
      "hostname": "protegrity-esa503",
      "ip": "10.37.4.12"
    },
    "cnt": 1,
    "index_node": "protegrity-esa503/10.37.4.12",
    "tiebreaker": 10703,
    "logtype": "Policy",
    "additional_info": {
      "description": "Data element created. (Data Element 'TE_LASCII_L2R1_Y' created)"
    },
    "index_time_utc": "2024-09-03T08:30:31.358367506Z",
    "client": {
      "ip": "10.87.2.32",
      "username": "admin"
    },
    "ingest_time_utc": "2024-09-03T08:29:30.017906235Z",
    "correlationid": "cm0m64iap009r1h0399ey6rl8",
    "policy": {
      "severity": "Low",
      "audit_code": 150
    }
  },
  "fields": {
    "origin.time_utc": [
      "2024-09-03T08:29:14.000Z"
    ],
    "index_time_utc": [
      "2024-09-03T08:30:31.358Z"
    ],
    "ingest_time_utc": [
      "2024-09-03T08:29:30.017Z"
    ]
  },
  "highlight": {
    "additional_info.description": [
      "(Data Element '@opensearch-dashboards-highlighted-field@DE@/opensearch-dashboards-highlighted-field@' created)"
    ]
  },
  "sort": [
    1725352154000
  ]
The example contains the following information:
- additional_info
- origin
- policy
- process
For more information about the various fields, refer here.
Policy Status Dashboard index
The policy status dashboard index contains information for the Policy Status Dashboard. It holds the policy and trusted application deployment status information. The index pattern for viewing these logs in Discover is pty_insight_analytics*policy_status_dashboard_*.
{
    "logtype": "Status",
    "process": {
      "thread_id": "2458884416",
      "module": "rpstatus",
      "name": "java",
      "pcc_version": "3.6.0.1",
      "id": "2852",
      "user": "root",
      "version": "10.0.0-alpha+13.gef09.10.0",
      "core_version": "2.1.0+17.gca723.2.1",
      "platform": "Linux_x64"
    },
    "origin": {
      "time_utc": "2024-09-03T10:24:19.000Z",
      "hostname": "ip-10-49-2-49.ec2.internal",
      "ip": "10.49.2.49"
    },
    "cnt": 1,
    "protector": {
      "vendor": "Java",
      "datastore": "DataStore",
      "family": "sdk",
      "version": "10.0.0-alpha+13.gef09.10.0"
    },
    "ingest_time_utc": "2024-09-03T10:24:19.510Z",
    "status": {
      "core_correlationid": "cm0f1jlq700gbzb19cq65miqt",
      "package_correlationid": "cm0m1tv5k0019te89e48tgdug"
    },
    "policystatus": {
      "type": "TRUSTED_APP",
      "application_name": "APJava_sample",
      "deployment_or_auth_time": "2024-09-03T10:24:19.000Z",
      "status": "WARNING"
    }
  },
  "fields": {
    "policystatus.deployment_or_auth_time": [
      "2024-09-03T10:24:19.000Z"
    ],
    "origin.time_utc": [
      "2024-09-03T10:24:19.000Z"
    ],
    "ingest_time_utc": [
      "2024-09-03T10:24:19.510Z"
    ]
  },
  "sort": [
    1725359059000
  ]
The example contains the following information:
- additional_info
- origin
- protector
- policystatus
- policy
- process
Protectors status index
The protector status logs generated by protectors of v10.0.0 are stored in this index. The index pattern for viewing these logs in Discover is pty_insight_analytics_protectors_status_*.
The following parameters are configured for the index rollover:
- Index age: 30 days
- Document count: 200,000,000
- Index size: 5 GB
Use the following query in Discover to view these logs.
logtype:status
A sample log is shown here:
{
   "logtype":"Status",
   "process":{
      "thread_id":"2559813952",
      "module":"rpstatus",
      "name":"java",
      "pcc_version":"3.6.0.1",
      "id":"1991",
      "user":"root",
      "version":"10.0.0.2.91.5ec4b8b",
      "core_version":"2.1.0-alpha+24.g7fc71.2.1",
      "platform":"Linux_x64"
   },
   "origin":{
      "time_utc":"2024-07-30T07:22:41.000Z",
      "hostname":"ip-10-39-3-218.ec2.internal",
      "ip":"10.39.3.218"
   },
   "cnt":1,
   "protector":{
      "vendor":"Java",
      "datastore":"ESA-10.39.2.7",
      "family":"sdk",
      "version":"10.0.0.2.91.5ec4b8b"
   },
   "ingest_time_utc":"2024-07-30T07:22:41.745Z",
   "status":{
      "core_correlationid":"clz79lc2o004jmb29neneto8k",
      "package_correlationid":"clz82ijw00037k790oxlnjalu"
   }
}
The example contains the following information:
- additional_info
- origin
- policy
- protector
Protector Status Dashboard index
The protector status dashboard index contains information for the Protector Status Dashboard. It holds the protector status information. The index pattern for viewing these logs in Discover is pty_insight_analytics*protector_status_dashboard_.
A sample log is shown here:
{
    "logtype": "Status",
    "process": {
      "thread_id": "2458884416",
      "module": "rpstatus",
      "name": "java",
      "pcc_version": "3.6.0.1",
      "id": "2852",
      "user": "root",
      "version": "10.0.0-alpha+13.gef09.10.0",
      "core_version": "2.1.0+17.gca723.2.1",
      "platform": "Linux_x64"
    },
    "origin": {
      "time_utc": "2024-09-03T10:24:19.000Z",
      "hostname": "ip-10-49-2-49.ec2.internal",
      "ip": "10.49.2.49"
    },
    "cnt": 1,
    "protector": {
      "vendor": "Java",
      "datastore": "DataStore",
      "family": "sdk",
      "version": "10.0.0-alpha+13.gef09.10.0"
    },
    "ingest_time_utc": "2024-09-03T10:24:19.510Z",
    "status": {
      "core_correlationid": "cm0f1jlq700gbzb19cq65miqt",
      "package_correlationid": "cm0m1tv5k0019te89e48tgdug"
    },
    "protector_status": "Warning"
  },
  "fields": {
    "origin.time_utc": [
      "2024-09-03T10:24:19.000Z"
    ],
    "ingest_time_utc": [
      "2024-09-03T10:24:19.510Z"
    ]
  },
  "sort": [
    1725359059000
  ]
The example contains the following information:
- additional_info
- origin
- protector
- process
DSG transaction metrics
The table in this section lists the details for the various parameters generated by DSG transactions. The DSG transaction logs are stored in the pty_insight_analytics_dsg_transaction_metrics_9.2 index file. The index pattern for viewing these logs in Discover is pty_insight_analytics_dsg_transaction_metrics_*. The following parameters are configured for the index rollover:
- Index age: 1 day
- Document count: 10,000,000
- Index size: 1 GB
This index stores the following fields.
* -The origin_time_utc and logtype parameters will only be displayed on the Audit Store Dashboards.
For more information about the transaction metric logs, refer to the section Transaction Metrics Logging in the Protegrity Data Security Gateway User Guide 3.2.0.0.
Scheduled tasks are available for deleting this index. You can configure and enable the scheduled task to free up the space used by old index files that you do not require.
For more information about scheduled tasks, refer here.
DSG usage metrics
This section describes the codes associated with the following DSG usage metrics:
- Tunnels usage data (Version 0)
- Service usage data (Version 0)
- Profile usage data (Version 0)
- Rules usage data (Version 0)
The table in this sub sections lists the details for the various parameters generated while using the DSG. The DSG usage metrics logs are stored in the pty_insight_analytics_dsg_usage_metrics_9.2 index file. The index pattern for viewing these logs in Discover is pty_insight_analytics_dsg_usage_metrics_*. The following parameters are configured for the index rollover:
- Index age: 1 day
- Document count: 3,500,000
- Index size: 1 GB
For more information about the usage metrics, refer to the Protegrity Data Security Gateway User Guide 3.2.0.0.
Scheduled tasks are available for deleting this index. You can configure and enable the scheduled task to free up the space used by old index files that you do not require.
For more information about scheduled tasks, refer here.
Tunnels usage data
The table in this section describes the usage metric for Tunnels.
| Position | Name | Data Type | Description |
|---|---|---|---|
| 0 | metrics type | integer | 0 for Tunnels |
| 1 | metrics version | integer | 0 |
| 2 | tunnel-type | string | the tunnel type CIFS, HTTP, NFS, S3, SFTP, SMTP |
| 3 | timestamp | string | time usage is reported |
| 4 | tunnel-id | string | address of tunnel instance will be unique id generated when tunnel is created. |
| 5 | uptime | float | time in seconds since the tunnel loaded |
| 6 | bytes-processed | integer | frontend and backend bytes the tunnel processed since the last time usage was reported |
| 7 | frontend-bytes-processed | integer | frontend bytes the tunnel has processed since the last time usage was reported |
| 8 | backend-bytes-processed | integer | backend bytes the tunnel has processed since the last time usage was reported |
| 9 | total-bytes-processed | integer | total number of frontend and backend bytes the tunnel has processed during the time the tunnel has been loaded |
| 10 | frontend-bytes-processed | integer | total number of frontend bytes the tunnel has processed during the time the tunnel has been loaded |
| 11 | backend-bytes-processed | integer | total number of backend bytes the tunnel has processed during the time the tunnel has been loaded |
| 12 | message-count | integer | number of requests the tunnel received since the last time usage was reported |
| 13 | total-message-count | integer | total number of requests the tunnel received during the time the tunnel has been loaded |
| 14 | ingest_time_utc | string | Time in UTC at which this log is ingested |
| 15 | logtype | string | Value to identify type of metric –> dsg_metrics_usage_tunnel |
A sample is provided here:
{"metrics_type":"Tunnel","version":0,"tunnel_type":"HTTP","cnt":1,"logtype":"Application","origin":{"time_utc":"2023-04-13T12:28:18Z"},"previous_timestamp":"2023-04-13T12:28:08Z","tunnel_id":"140361619513360","checksum":"4139677074","uptime":620.8048927783966,"bytes_processed":401,"frontend_bytes_processed":401,"backend_bytes_processed":0,"previous_bytes_processed":401,"previous_frontend_bytes_processed":401,"previous_backend_bytes_processed":0,"total_bytes_processed":1203,"total_frontend_bytes_processed":1203,"total_backend_bytes_processed":0,"message_count":1,"previouse_message_count":1,"total_message_count":3}
Services usage data
The table in this section describes the usage metric for Services.
| Position | Name | Data Type | Description |
|---|---|---|---|
| 0 | metrics type | integer | 1 for Services |
| 1 | metrics version | integer | 0 |
| 2 | service-type | string | the service type HTTP-GW, MOUNTED-OOB, REST-API, S3-OOB, SMTP-GW, SFTP-GW, WS-GW |
| 3 | timestamp | string | time usage is reported |
| 4 | service-id | string | UUID of service name |
| 5 | tunnel-id | string | UUID of tunnel name |
| 6 | calls | integer | number of times service processed frontend and backend requests since the time usage was last reported |
| 7 | frontend-calls | integer | number of times service processed frontend requests since the time usage was last reported |
| 8 | backend-calls | integer | number of times service processed backend requests since the time usage was last reported |
| 9 | total-calls | integer | total number number of times service processed frontend and backend requests since the service has been loaded |
| 10 | total-frontend-calls | integer | total number number of times service processed frontend and backend requests since the service has been loaded |
| 11 | total-backend-calls | integer | total number number of times service processed frontend and backend requests since the service has been loaded |
| 12 | bytes-processed | integer | frontend and backend bytes the service processed since the last time usage was reported |
| 13 | frontend-bytes-processed | integer | frontend bytes the tunnel processed since the last time usage was reported |
| 14 | backend-bytes-processed | integer | backend bytes the tunnel processed since the last time usage was reported |
| 15 | total-bytes-processed | integer | total number of frontend and backend bytes the service has processed during the time the service has been loaded |
| 16 | total-frontend-bytes-processed | integer | total number of frontend bytes the tunnel has processed during the time the tunnel has been loaded |
| 17 | total-backend-bytes-processed | integer | total number of backend bytes the tunnel has processed during the time the tunnel has been loaded |
| 18 | ingest_time_utc | string | Time in UTC at which this log is ingested |
| 19 | logtype | string | Value to identify type of metric –> dsg_metrics_usage_service |
A sample is provided here:
{"metrics_type":"Service","version":0,"service_type":"REST-API","cnt":1,"logtype":"Application","origin":{"time_utc":"2023-04-13T12:28:18Z"}, "previous_timestamp":"2023-04-13T12:28:08Z", "service_id":"140361548704016","checksum":"3100121694","tunnel_checksum":"4139677074","calls":401,"frontend_calls":401,"backend_calls":0,"previous_calls":401,"previous_frontend_calls":401,"previous_backend_calls":0,"total_calls":1203,"total_frontend_calls":1203,"total_backend_calls":0,"bytes_processed":2,"frontend_bytes_processed":1,"backend_bytes_processed":1,"previous_bytes_processed":2,"previous_frontend_bytes_processed":1,"previous_backend_bytes_processed":1,"total_bytes_processed":6,"total_frontend_bytes_processed":3,"total_backend_bytes_processed":3}
Profile usage data
The table in this section describes the usage metric for Profile.
| Position | Name | Data Type | Description |
|---|---|---|---|
| 0 | metrics type | integer | 2 for Profile |
| 1 | metrics version | integer | 0 |
| 2 | timestamp | string | time usage is reported |
| 3 | prev-timestamp | string | the previous time usage was reported |
| 4 | profile-id | string | address of profile instance will be unique id generated when profile is created |
| 5 | parent-id | string | checksum of profile or service calling this profile |
| 6 | calls | integer | number of times the profile processed a request since the time usage was last reported |
| 7 | total-calls | integer | total number of times the profile processed a request since profile has been loaded |
| 8 | profile-ref-count | integer | the number of times this profile has been called via a profile reference since the time usage was last reported |
| 9 | prev-profile-ref-count | integer | the number of times this profile has been called via a profile reference the last time usage was last reported |
| 10 | total-profile-ref-count | integer | total number of times this profile has been called via a profile reference since the profile has been loade |
| 11 | bytes-processed | integer | bytes the profile processed since the last time usage was reported |
| 12 | total-bytes-processed | integer | total bytes the profile processed since the profile has been loaded |
| 13 | elapsed-time-sample-count | integer | the number of times the profile was sampled since the last time usage was reported |
| 14 | elapsed-time-mean | integer | the average amount of time in nano-seconds it took to process a request based on elapsed-time-sample-count |
| 15 | total-elapsed-time-sample-count | integer | the number of times the profile was sampled since the profile has been loaded |
| 16 | total-elapsed-time-sample-mean | integer | the average amount of time in nano-seconds it took to process a request based on total-elapsed-time-sample-count |
| 17 | ingest_time_utc | string | Time in UTC at which this log is ingested |
| 18 | logtype | string | Value to identify type of metric –> dsg_metrics_usage_profile |
A sample is provided here:
{"metrics_type":"Profile","version":0,"cnt":1,"logtype":"Application","origin":{"time_utc":"2023-04-13T12:28:18Z"},"previous_timestamp":"2023-04-13T12:28:08Z","profile_id":"140361548999248","checksum":"3504922421","parent_checksum":"3100121694","calls":2,"previous_calls":2,"total_calls":6,"profile_reference_count":0,"previous_profile_reference_count":0,"total_profile_reference_count":0,"bytes_processed":802,"previous_bytes_processed":802,"total_bytes_processed":2406,"elapsed_time_sample_count":2,"elapsed_time_average":221078.5,"total_elapsed_time_sample_count":6,"total_elapsed_time_sample_average":245797.0}
Rules usage data
The table in this section describes the usage metric for Rules.
| Position | Name | Data Type | Description |
|---|---|---|---|
| 0 | metrics type | integer | 3 for Rules |
| 1 | metrics version | integer | 0 |
| 2 | rule-type | string | rule is one of Dynamice Injection, Error, Exit, Extract, Log, Profile Reference, Set Context Variable, Set User Identity, Transform |
| 3 | codec | string | only applies to Extract |
| 4 | timestamp | string | time usage is reported |
| 5 | flag | boolean | Broken rule or is domain name rewrite |
| 6 | rule-id | string | address of rule instance will be unique id generated when rule is created. |
| 7 | parent-id | string | checksum of rule or profile calling this rule |
| 8 | calls | integer | number of times the rule processed a request since the time usage was last reported |
| 9 | total-calls | integer | total number of times the rule processed a request since rule has been loaded |
| 10 | profile-ref-count | integer | the number of times this rule has been called via a profile reference since the time usage was last reported |
| 11 | prev-profile-ref-count | integer | the number of times this rule has been called via a profile reference the last time usage was last reported |
| 12 | total-profle-ref-count | integer | total number of times this rule has been called via a profile reference since the rule has been loaded |
| 13 | bytes-processed | integer | bytes the rule processed since the last time usage was reported |
| 14 | total-bytes-processed | integer | total bytes the rule processed since the rule has been loaded |
| 15 | elapsed-time-sample-count | integer | the number of times the rule was sampled since the last time usage was reported |
| 16 | elapsed-time-sample-mean | integer | the average amount of time in nano-seconds it took to process a data based on elapsed-time-sample-count |
| 17 | total-elapsed-time-sample-count | integer | the number of times the rule was sampled since the rule has been loaded |
| 18 | total-elapsed-time-sample-mean | integer | the average amount of time in nano-seconds it took to process a data based on total-elapsed-time-sample-count |
| 19 | ingest_time_utc | string | Time in UTC at which this log is ingested |
| 20 | logtype | string | Value to identify type of metric –> dsg_metrics_usage_rule |
A sample is provided here:
{"metric_type":"Rule","version":0,"rule_type":"Extract","codec":"Set User Identity","cnt":1,"logtype":"Application","origin":{"time_utc":"2023-04-13T12:28:18Z"},"previous_timestamp":"2023-04-13T12:28:08Z","broken":false,"domain_name_rewrite":false,"rule_id":"140361553016464","rule_checksum":"932129179","parent_checksum":"3504922421","calls":1,"previous_calls":1,"total_calls":3,"profile_reference_count":0,"previous_profile_reference_count":0,"total_profile_reference_count":0,"bytes_processed":1,"previous_bytes_processed":1,"total_bytes_processed":3,"elapsed_time_sample_count":1,"elapsed_time_sample_average":406842.0,"total_elapsed_time_sample_count":3,"total_elapsed_time_sample_average":451163.6666666667}
DSG error metrics
The table in this section lists the details for the various parameters generated for the DSG Error Metrics. The DSG Error Metrics logs are stored in the pty_insight_analytics_dsg_error_metrics_9.2 index file. The index pattern for viewing these logs in Discover is pty_insight_analytics_dsg_error_metrics_*. The following parameters are configured for the index rollover:
- Index age: 1 day
- Document count: 3,500,000
- Index size: 1 GB
This index stores the following fields.
* -The origin_time_utc and logtype parameters will only be displayed on the Audit Store Dashboards.
For more information about the error metric logs, refer to the Protegrity Data Security Gateway User Guide 3.2.0.0.
Scheduled tasks are available for deleting this index. You can configure and enable the scheduled task to free up the space used by old index files that you do not require.
For more information about scheduled tasks, refer here.
Miscellaneous index
The logs that are not added to the other indexes are captured and stored in the miscellaneous index. The index pattern for viewing these logs in Discover is pty_insight_analytics_miscellaneous_*.
This index should not contain any logs. If any logs are visible in this index, then kindly contact Protegrity support.
The following parameters are configured for the index rollover:
- Index age: 7 days
- Document count: 3,500,000
- Index size: 200 mb
Use the following query in Discover to view these logs.
logtype:miscellaneous;
Scheduled tasks are available for deleting this index. You can configure and enable the scheduled task to free up the space used by old index files that you do not require.
For more information about scheduled tasks, refer here.
9.3.7 - Log return codes
| Return Code | Description |
|---|---|
| 0 | Error code for no logging |
| 1 | The username could not be found in the policy |
| 2 | The data element could not be found in the policy |
| 3 | The user does not have the appropriate permissions to perform the requested operation |
| 4 | Tweak is null |
| 5 | Integrity check failed |
| 6 | Data protect operation was successful |
| 7 | Data protect operation failed |
| 8 | Data unprotect operation was successful |
| 9 | Data unprotect operation failed |
| 10 | The user has appropriate permissions to perform the requested operation but no data has been protected/unprotected |
| 11 | Data unprotect operation was successful with use of an inactive keyid |
| 12 | Input is null or not within allowed limits |
| 13 | Internal error occurring in a function call after the provider has been opened |
| 14 | Failed to load data encryption key |
| 15 | Tweak input is too long |
| 16 | The user does not have the appropriate permissions to perform the unprotect operation |
| 17 | Failed to initialize the PEP: this is a fatal error |
| 19 | Unsupported tweak action for the specified fpe data element |
| 20 | Failed to allocate memory |
| 21 | Input or output buffer is too small |
| 22 | Data is too short to be protected/unprotected |
| 23 | Data is too long to be protected/unprotected |
| 24 | The user does not have the appropriate permissions to perform the protect operation |
| 25 | Username too long |
| 26 | Unsupported algorithm or unsupported action for the specific data element |
| 27 | Application has been authorized |
| 28 | Application has not been authorized |
| 29 | The user does not have the appropriate permissions to perform the reprotect operation |
| 30 | Not used |
| 31 | Policy not available |
| 32 | Delete operation was successful |
| 33 | Delete operation failed |
| 34 | Create operation was successful |
| 35 | Create operation failed |
| 36 | Manage protection operation was successful |
| 37 | Manage protection operation failed |
| 38 | Not used |
| 39 | Not used |
| 40 | No valid license or current date is beyond the license expiration date |
| 41 | The use of the protection method is restricted by license |
| 42 | Invalid license or time is before license start |
| 43 | Not used |
| 44 | The content of the input data is not valid |
| 45 | Not used |
| 46 | Used for z/OS query default data element when policy name is not found |
| 47 | Access key security groups not found |
| 48 | Not used |
| 49 | Unsupported input encoding for the specific data element |
| 50 | Data reprotect operation was successful |
| 51 | Failed to send logs, connection refused |
| 52 | Return code used by bulkhandling in pepproviderauditor |
9.3.8 - Policy Management Errors
Nodes Connectivity Status of the nodes is displayed as Error under Policy Management > Data Stores in ESA Web UI
Issue : In a multi-site ESA configuration, if the protectors are at or below v9.1.0.0, then the Node Connectivity Status on the Primary site ESAs might display Error status. This behavior is observed for all the protector nodes after performing failover and fail back operations between Primary and the Disaster Recovery sites.
Description : This may occur because the PEP server attempts to send status using a Node ID which is not present in the ESA’s repository. This repository is responsible for maintaining the status of all the registered pep server nodes.
Additionally, the following warning log in PEP server logs appears(WARNING) Failed to send node status: The requested URL was not found on the serverTo access PEP server logs, navigate to Discover, by logging into the ESA and navigating to Audit Store > Dashboard > Open in new tab, select Discover from the menu and select a time period.
Workaround : Perform the following steps to reset the node’s status to Green ("OK").
- Log in to ESA Web UI of the Primary ESA.
- Navigate to Policy Management > Data Stores
- Select nodes showing status as Red
("Error")and click on delete button to remove entry.
If there are many PEP server nodes registered, ensure to delete the nodes in a batch of 200. After deleting the registered nodes successfully, the PEP server nodes are re-registered with ESA and status updates to Green
("OK").
The following section provides information about the resultant errors when trying to fetch the members from a member source.
Error/Problem | This may happen because… | Recovery |
|---|---|---|
When working with the member source on the ESA Web UI, a connection timeout error is observed while fetching the members or syncing a group in a role. If you get a connection timeout error, then check the hubcontroller.log and the mbs.log files to check for error messages.
| The timeout period exceeds the default values specified for the following parameters:
| Perform the following steps to fix the timeout error.
|
When working with the member source using the DevOps API, a connection timeout error is observed in the DevOps API while fetching members or syncing a group in a role. If you get a connection timeout error, then check the devops.log file to check for the error message. DevOps log - | The timeout period exceeds the default values specified for the following parameters:
| Perform the following steps to fix the timeout error:
|
9.3.9 - Protectors security log codes
The security logging level can be configured when a data security policy is created in the Policy management in ESA. If logging level is set to audit successful and audit failed, then both successful and failed Unprotect/Protect/Reprotect/Delete operations will be logged.
You can define the server where these security audit logs will be sent to. You can do that by modifying the Log Server configuration section in pepserver.cfg file.
If you configure to send protector security logs to ESA, you will be able view them in Discover, by logging into the ESA and navigating to Audit Store > Dashboard > Open in new tab, select Discover from the menu, and select a time period such as Last 30 days. The following table displays the logs sent by protectors.
| Log Code | Severity | Description | Error Message | DB / AP Operations | MSSQL | Teradata | Oracle | DB2 | XC API Definitions | Recovery Actions |
|---|---|---|---|---|---|---|---|---|---|---|
| 0 | S | Internal ID when audit record should not be generated. | - | - | - | - | - | - | XC_LOG_NONE | No action is required. |
| 1 | W | The username could not be found in the policy in shared memory. | No such user | URPD | 1 | 01H01 or U0001 | 20101 | 38821 | XC_LOG_USER_NOT_FOUND | Verify that the user that calls a PTY function is in the policy. Ensure that your policy is synchronized across all Teradata nodes. Make sure that the ESA connectivity information is correct in the pepserver.cfg file. |
| 2 | W | The data element could not be found in the policy in shared memory. | No such data element | URPD | 2 | U0002 | 20102 | 38822 | XC_LOG_DATA_ELEMENT_NOT_FOUND | Verify that you are calling a PTY function with data element that exists in the policy. |
| 3 | W | The data element was found, but the user does not have the appropriate permissions to perform the requested operation. | Permission denied | URPD | 3 | 01H03 or U0003 | 20103 | 38823 | XC_LOG_PERMISSION_DENIED | Verify that you are calling a PTY function with a user having access permissions to perform this operation according to the policy. |
| 4 | E | Tweak is null. | Tweak null | URPD | 4 | 01H04 or U0004 | 20104 | 38824 | XC_LOG_TWEAK_NULL | Ensure that the tweak is not a null value. |
| 5 | W | The data integrity check failed when decrypting using a Data Element with CRC enabled. | Integrity check failed | U— | 5 | U0005 | 20105 | 38825 | XC_LOG_INTEGRITY_CHECK_FAILED | Check that you use the correct data element to decrypt. Check that your data was not corrupted, restore data from the backup. |
| 6 | S | The data element was found, and the user has the appropriate permissions for the operation. Data protection was successful. | -RP- | 6 | U0006 | 20106 | 38826 | XC_LOG_PROTECT_SUCCESS | No action is required. | |
| 7 | W | The data element was found, and the user has the appropriate permissions for the operation. Data protection was NOT successful. | -RP- | 7 | U0007 | 20107 | 38827 | XC_LOG_PROTECT_FAILED | Failed to create Key ID crypto context. Verify that your data is not corrupted and you use valid combination of input data and data element to encrypt. | |
| 8 | S | The data element was found, and the user has the appropriate permissions for the operation. Data unprotect operation was successful. If mask was applied to the DE, then the appropriate record is added to the audit log description. | U— | 8 | U0008 | 20108 | 38828 | XC_LOG_UNPROTECT_SUCCESS | No action is required. | |
| 9 | W | The data element was found, and the user has the appropriate permissions for the operation. Data unprotect operation was NOT successful. | U— | 9 | U0009 | 20109 | 38829 | XC_LOG_UNPROTECT_FAILED | Failure to decrypt data with Key ID by data element without Key ID. Verify that your data is not corrupted and you use valid combination of input data and data element to decrypt. | |
| 10 | S | Policy check OK. The data element was found, and the user has the appropriate permissions for the operation. NO protection operation is done. | —D | 10 | U0010 | 20110 | 38830 | XC_LOG_OK_ACCESS | No action is required. Successful DELETE operation was performed. | |
| 11 | W | The data element was found, and the user has the appropriate permissions for the operation. Data unprotect operation was successful with use of an inactive key ID. | U— | 11 | U0011 | 20111 | 38831 | XC_LOG_INACTIVE_KEYID_USED | No action is required. Successful UNPROTECT operation was performed. | |
| 12 | E | Input parameters are either NULL or not within allowed limits. | URPD | 12 | U0012 | 20112 | 38832 | XC_LOG_INVALID_PARAM | Verify the input parameters are correct. | |
| 13 | E | Internal error occurring in a function call after the PEP Provider has been opened. For instance: - failed to get mutex/semaphore, - unexpected null parameter in internal (private) functions, - uninitialized provider, etc. | URPD | 13 | U0013 | 20113 | 38833 | XC_LOG_INTERNAL_ERROR | Restart PEP Server and re-deploy the policy. | |
| 14 | W | A key for a data element could not be loaded from shared memory into the crypto engine. | Failed to load data encryption key - Cache is full, or Failed to load data encryption key - No such key, or Failed to load data encryption key - Internal error. | URP- | 14 | U0014 | 20114 | 38834 | XC_LOG_LOAD_KEY_FAILED | If return message is ‘Cache is full’, then logoff and logon again, clear the session and cache. For all other return messages restart PEP Server and re-deploy the policy. |
| 15 | Tweak input is too long. | |||||||||
| 16 | The user does not have the appropriate permissions to perform the unprotect operation. | |||||||||
| 17 | E | A fatal error was encountered when initializing the PEP. | URPD | 17 | U0017 | 20117 | 38837 | XC_LOG_INIT_FAILED | Re-install the protector, re-deploy policy. | |
| 19 | Unsupported tweak action for the specified fpe data element. | |||||||||
| 20 | E | Failed to allocate memory. | URPD | 20 | U0020 | 20120 | 38840 | XC_LOG_OUT_OF_MEMORY | Check what uses the memory on the server. | |
| 21 | W | Supplied input or output buffer is too small. | Buffer too small | URPD | 21 | U0021 | 20121 | 38841 | XC_LOG_BUFFER_TOO_SMALL | Token specific error about supplied buffers. Data expands too much, using non-length preserving Token element. Check return message for specific error, and verify you use correct combination of data type (encoding), and token element. Verify supported data types according to Protegrity Protection Methods Reference 7.2.1. |
| 22 | W | Data is too short to be protected or unprotected. E.g. Too few characters were provided when tokenizing with a length-preserving token element. | Input too short | URPD | 22 | U0022 | 20122 | 38842 | XC_LOG_INPUT_TOO_SHORT | Provide the longer input data. |
| 23 | W | Data is too long to be protected or unprotected. E.g. Too many characters were provided. | Input too long | URPD | 23 | U0023 | 20123 | 38843 | XC_LOG_INPUT_TOO_LONG | Provide the shorter input data. |
| 24 | The user does not have the appropriate permissions to perform the protect operation. | |||||||||
| 25 | W | Unauthorized Username too long. | Username too long. | UPRD | - | U0025 | - | - | Run query by user with Username up to 255 characters long. | |
| 26 | E | Unsupported algorithm or unsupported action for the specific data element or unsupported policy version. For example, unprotect using HMAC data element. | URPD | 26 | U0026 | 20126 | 38846 | XC_LOG_UNSUPPORTED | Check the data elements used for the crypto operation. Note that HMAC data elements cannot be used for decrypt and re-encrypt operations. | |
| 27 | Application has been authorized. | |||||||||
| 28 | Application has not been authorized. | |||||||||
| 29 | The JSON type is not serializable. | |||||||||
| 30 | W | Failed to save audit record in shared memory. | Failed to save audit record | URPD | 30 | U0030 | 20130 | 38850 | XC_LOG_AUDITING_FAILED | Check if PEP Server is started. |
| 31 | E | The policy shared memory is empty. | Policy not available | URPD | 31 | U0031 | 20131 | 38851 | XC_LOG_EMPTY_POLICY | No policy is deployed on PEP Server. |
| 32 | Delete operation was successful. | |||||||||
| 33 | Delete operation failed. | |||||||||
| 34 | Create operation was successful. | |||||||||
| 35 | Create operation failed. | |||||||||
| 36 | Manage protection operation was successful. | |||||||||
| 37 | Manage protection operation failed. | |||||||||
| 39 | E | The policy in shared memory is locked. This is the result of a disk full alert. | Policy locked | URPD | 39 | U0039 | 20139 | 38859 | XC_LOG_POLICY_LOCKED | Fix the disk space and restart the PEP Server. |
| 40 | E | No valid license or current date is beyond the license expiration date. | License expired | -RP- | 40 | U0040 | 20140 | 38860 | XC_LOG_LICENSE_EXPIRED | ESA System Administrator should request and obtain a new license. Re-deploy policy with renewed license. |
| 41 | E | The use of the protection method is restricted by the license. | Protection method restricted by license. | URPD | 41 | U0041 | 20141 | 38861 | XC_LOG_METHOD_RESTRICTED | Perform the protection operation with the protection method that is not restricted by the license. Request license with desired protection method enabled. |
| 42 | E | Invalid license or time is before license start time. | License is invalid. | URPD | 42 | U0042 | 20142 | 38862 | XC_LOG_LICENSE_INVALID | ESA System Administrator should request and obtain a new license. Re-deploy policy with renewed license. |
| 44 | W | Content of the input data to protect is not valid (e.g. for Tokenization). E.g. Input is alphabetic when it is supposed to be numeric. | Invalid format | -RP- | 44 | U0044 | 20144 | 38864 | XC_LOG_INVALID_FORMAT | Verify the input data is of the supported alphabet for specified type of token element. |
| 46 | E | Used for z/OS Query Default Data element when policy name is not found. | No policy. Cannot Continue. | 46 | n/a | n/a | n/a | XC_LOG_INVALID_POLICY | Specify the valid policy. Policy name is case sensitive. | |
| 47 | Access Key security groups not found. | |||||||||
| 48 | Rule Set not found. | |||||||||
| 49 | Unsupported input encoding for the specific data element. | |||||||||
| 50 | S | The data element was found, and the user has the appropriate permissions for the operation. The data Reprotect operation is successful. | -R- | n/a | n/a | n/a | n/a | No action is required. Successful REPROTECT operation was performed. | ||
| 51 | Failed to send logs, connection refused! |
9.3.10 - Additional log information
These are values for understanding the values that are displayed in the log records.
Log levels
Most events on the system generate logs. The level of the log helps you understand whether the log is just an information message or denotes some issue with the system. The log message and the log level allows you to understand more about the working of the system and also helps you identify and troubleshoot any system issues.
Protection logs: These logs are generated for Unprotect, Reprotect, and Protect (URP) operations.
- SUCCESS: This log is generated for a successful URP operation.
- WARNING: This log is generated if a user does not have access and the operation is unprotect.
- EXCEPTION: This log is generated if a user does not have access, the operation is unprotect, and the return exception property is set.
- ERROR: This log is generated for all other issues.
Application logs: These logs are generated by the application. The log level denotes the severity level of the log, however, levels 1 and 6 are used for the log configuration.
- 1: OFF. This level is used to turn logging off.
- 2: SEVERE. This level indicates a serious failure that prevents normal program execution.
- 3: WARNING. This level indicates a potential problem or an issue with the system.
- 4: INFO. This level is used to display information messages about the application.
- 5: CONFIG. This level is used to display static configuration information that is useful during debugging.
- 6: ALL. This level is used to log all messages.
Policy logs: These logs are used for the policy logs.
- LOWEST
- LOW
- NORMAL
- HIGH
- CRITICAL
- N/A
Protector information
The information displayed in the Protector-related fields of the audit log are listed in the table.
| protector.family | protector.vendor | protector.version |
|---|---|---|
| DATA SECURITY GATEWAY | ||
| gwp | DSG | 3.3.0.0.x |
| APPLICATION PROTECTORS | ||
| sdk | C | 9.1.0.0.x |
| sdk | Java | 10.0.0+x, 9.1.0.0.x |
| sdk | Python | 9.1.0.0.x |
| sdk | Go | 9.1.0.0.x |
| sdk | NodeJS | 9.1.0.0.x |
| sdk | DotNet | 9.1.0.0.x |
| TRUSTED APPLICATION LOGS IN APPLICATION PROTECTORS | ||
| <process.name> | C | 9.1.0.0.x |
| <process.name> | Java | 9.1.0.0.x |
| <process.name> | Python | 9.1.0.0.x |
| <process.name> | Go | 9.1.0.0.x |
| <process.name> | NodeJS | 9.1.0.0.x |
| <process.name> | DotNet | 9.1.0.0.x |
| DATABASE PROTECTOR | ||
| dbp | SqlServer | 9.1.0.0.x |
| dbp | Oracle | 9.1.0.0.x |
| dbp | Db2 | 9.1.0.0.x |
| dwp | Teradata | 10.0.0+x, 9.1.0.0.x |
| dwp | Exadata | 9.1.0.0.x |
| BIG DATA PROTECTOR | ||
| bdp | Impala | 9.2.0.0.x, 9.1.0.0.x |
| bdp | Mapreduce | 9.2.0.0.x, 9.1.0.0.x |
| bdp | Pig | 9.2.0.0.x, 9.1.0.0.x |
| bdp | HBase | 9.2.0.0.x, 9.1.0.0.x |
| bdp | Hive | 9.2.0.0.x, 9.1.0.0.x |
| bdp | Spark | 9.2.0.0.x, 9.1.0.0.x |
| bdp | SparkSQL | 9.2.0.0.x, 9.1.0.0.x |
Protectors having CORE version 1.2.2+42.g01eb3.1.2 and higher are compatible with ESA v10.2.0. For more version-related information, refer to the Product Compatibility on My.Protegrity. The protector family might display the process.name for some protectors. This will be fixed in a later release.
Modules and components and the log type
Some of the components and modules and the logtype that they generate are provided in the following table.
| Module / Component | Protection | Policy | Application | Audit | Kernel | System | Verification |
|---|---|---|---|---|---|---|---|
| as_image_management.pyc | ✓ | ||||||
| as_memory_management.pyc | ✓ | ||||||
| asmanagement.pyc | ✓ | ||||||
| buffer_watch.pyc | ✓ | ||||||
| devops | ✓ | ||||||
| DSGPAP | ✓ | ||||||
| ESAPAP | ✓ | ||||||
| fluentbit | ✓ | ||||||
| hubcontroller | ✓ | ||||||
| imps | ✓ | ||||||
| insight.pyc | ✓ | ||||||
| insight_cron_executor.pyc | ✓ | ||||||
| insight_cron_job_method_executor.pyc | ✓ | ||||||
| kmgw_external | ✓ | ||||||
| kmgw_internal | ✓ | ||||||
| logfacade | ✓ | ||||||
| membersource | ✓ | ||||||
| meteringfacade | ✓ | ||||||
| PIM_Cluster | ✓ | ||||||
| Protegrity PEP Server | ✓ | ||||||
| TRIGGERING_AGENT_policy_deploy.pyc | ✓ |
For more information and description about the components that can generate kernel logs, refer here.
Kernel logs
This section lists the various kernel logs that are generated.
Note: This list is compiled using information from https://pmhahn.github.io/audit/.
User and group account management:
- ADD_USER: A user-space user account is added.
- USER_MGMT: The user-space management data.
- USER_CHAUTHTOK: A user account attribute is modified.
- DEL_USER: A user-space user is deleted.
- ADD_GROUP: A user-space group is added.
- GRP_MGMT: The user-space group management data.
- GRP_CHAUTHTOK: A group account attribute is modified.
- DEL_GROUP: A user-space group is deleted.
User login live cycle events:
- CRYPTO_KEY_USER: The cryptographic key identifier used for cryptographic purposes.
- CRYPTO_SESSION: The parameters set during a TLS session establishment.
- USER_AUTH: A user-space authentication attempt is detected.
- LOGIN: The user log in to access the system.
- USER_CMD: A user-space shell command is executed.
- GRP_AUTH: The group password is used to authenticate against a user-space group.
- CHUSER_ID: A user-space user ID is changed.
- CHGRP_ID: A user-space group ID is changed.
- Pluggable Authentication Modules (PAM) Authentication:
- USER_LOGIN: A user logs in.
- USER_LOGOUT: A user logs out.
- PAM account:
- USER_ERR: A user account state error is detected.
- USER_ACCT: A user-space user account is modified.
- ACCT_LOCK: A user-space user account is locked by the administrator.
- ACCT_UNLOCK: A user-space user account is unlocked by the administrator.
- PAM session:
- USER_START: A user-space session is started.
- USER_END: A user-space session is terminated.
- Credentials:
- CRED_ACQ: A user acquires user-space credentials.
- CRED_REFR: A user refreshes their user-space credentials.
- CRED_DISP: A user disposes of user-space credentials.
Linux Security Model events:
- DAC_CHECK: The record discretionary access control (DAC) check results.
- MAC_CHECK: The user space Mandatory Access Control (MAC) decision is made.
- USER_AVC: A user-space AVC message is generated.
- USER_MAC_CONFIG_CHANGE:
- SELinux Mandatory Access Control:
- AVC_PATH: dentry and vfsmount pair when an SELinux permission check.
- AVC: SELinux permission check.
- FS_RELABEL: file system relabel operation is detected.
- LABEL_LEVEL_CHANGE: object’s level label is modified.
- LABEL_OVERRIDE: administrator overrides an object’s level label.
- MAC_CONFIG_CHANGE: SELinux Boolean value is changed.
- MAC_STATUS: SELinux mode (enforcing, permissive, off) is changed.
- MAC_POLICY_LOAD: SELinux policy file is loaded.
- ROLE_ASSIGN: administrator assigns a user to an SELinux role.
- ROLE_MODIFY: administrator modifies an SELinux role.
- ROLE_REMOVE: administrator removes a user from an SELinux role.
- SELINUX_ERR: internal SELinux error is detected.
- USER_LABELED_EXPORT: object is exported with an SELinux label.
- USER_MAC_POLICY_LOAD: user-space daemon loads an SELinux policy.
- USER_ROLE_CHANGE: user’s SELinux role is changed.
- USER_SELINUX_ERR: user-space SELinux error is detected.
- USER_UNLABELED_EXPORT: object is exported without SELinux label.
- AppArmor Mandatory Access Control:
- APPARMOR_ALLOWED
- APPARMOR_AUDIT
- APPARMOR_DENIED
- APPARMOR_ERROR
- APPARMOR_HINT
- APPARMOR_STATUS APPARMOR
Audit framework events:
- KERNEL: Record the initialization of the Audit system.
- CONFIG_CHANGE: The Audit system configuration is modified.
- DAEMON_ABORT: An Audit daemon is stopped due to an error.
- DAEMON_ACCEPT: The auditd daemon accepts a remote connection.
- DAEMON_CLOSE: The auditd daemon closes a remote connection.
- DAEMON_CONFIG: An Audit daemon configuration change is detected.
- DAEMON_END: The Audit daemon is successfully stopped.
- DAEMON_ERR: An auditd daemon internal error is detected.
- DAEMON_RESUME: The auditd daemon resumes logging.
- DAEMON_ROTATE: The auditd daemon rotates the Audit log files.
- DAEMON_START: The auditd daemon is started.
- FEATURE_CHANGE: An Audit feature changed value.
Networking related:
- IPSec:
- MAC_IPSEC_ADDSA
- MAC_IPSEC_ADDSPD
- MAC_IPSEC_DELSA
- MAC_IPSEC_DELSPD
- MAC_IPSEC_EVENT: The IPSec event, when one is detected, or when the IPSec configuration changes.
- NetLabel:
- MAC_CALIPSO_ADD: The NetLabel CALIPSO DoI entry is added.
- MAC_CALIPSO_DEL: The NetLabel CALIPSO DoI entry is deleted.
- MAC_MAP_ADD: A new Linux Security Module (LSM) domain mapping is added.
- MAC_MAP_DEL: An existing LSM domain mapping is added.
- MAC_UNLBL_ALLOW: An unlabeled traffic is allowed.
- MAC_UNLBL_STCADD: A static label is added.
- MAC_UNLBL_STCDEL: A static label is deleted.
- Message Queue:
- MQ_GETSETATTR: The mq_getattr and mq_setattr message queue attributes.
- MQ_NOTIFY: The arguments of the mq_notify system call.
- MQ_OPEN: The arguments of the mq_open system call.
- MQ_SENDRECV: The arguments of the mq_send and mq_receive system calls.
- Netfilter firewall:
- NETFILTER_CFG: The Netfilter chain modifications are detected.
- NETFILTER_PKT: The packets traversing Netfilter chains.
- Commercial Internet Protocol Security Option:
- MAC_CIPSOV4_ADD: A user adds a new Domain of Interpretation (DoI).
- MAC_CIPSOV4_DEL: A user deletes an existing DoI.
Linux Cryptography:
- CRYPTO_FAILURE_USER: A decrypt, encrypt, or randomize cryptographic operation fails.
- CRYPTO_IKE_SA: The Internet Key Exchange Security Association is established.
- CRYPTO_IPSEC_SA: The Internet Protocol Security Association is established.
- CRYPTO_LOGIN: A cryptographic officer login attempt is detected.
- CRYPTO_LOGOUT: A cryptographic officer logout attempt is detected.
- CRYPTO_PARAM_CHANGE_USER: A change in a cryptographic parameter is detected.
- CRYPTO_REPLAY_USER: A replay attack is detected.
- CRYPTO_TEST_USER: The cryptographic test results as required by the FIPS-140 standard.
Process:
- BPRM_FCAPS: A user executes a program with a file system capability.
- CAPSET: Any changes in process-based capabilities.
- CWD: The current working directory.
- EXECVE; The arguments of the execve system call.
- OBJ_PID: The information about a process to which a signal is sent.
- PATH: The file name path information.
- PROCTITLE: The full command-line of the command that was used to invoke the analyzed process.
- SECCOMP: A Secure Computing event is detected.
- SYSCALL: A system call to the kernel.
Special system calls:
- FD_PAIR: The use of the pipe and socketpair system calls.
- IPC_SET_PERM: The information about new values set by an IPC_SET control operation on an Inter-Process Communication (IPC) object.
- IPC: The information about a IPC object referenced by a system call.
- MMAP: The file descriptor and flags of the mmap system call.
- SOCKADDR: Record a socket address.
- SOCKETCALL: Record arguments of the sys_socketcall system call (used to multiplex many socket-related system calls).
Systemd:
- SERVICE_START: A service is started.
- SERVICE_STOP: A service is stopped.
- SYSTEM_BOOT: The system is booted up.
- SYSTEM_RUNLEVEL: The system’s run level is changed.
- SYSTEM_SHUTDOWN: The system is shut down.
Virtual Machines and Container:
- VIRT_CONTROL: The virtual machine is started, paused, or stopped.
- VIRT_MACHINE_ID: The binding of a label to a virtual machine.
- VIRT_RESOURCE: The resource assignment of a virtual machine.
Device management:
- DEV_ALLOC: A device is allocated.
- DEV_DEALLOC: A device is deallocated.
Trusted Computing Integrity Measurement Architecture:
- INTEGRITY_DATA: The data integrity verification event run by the kernel.
- INTEGRITY_EVM_XATTR: The EVM-covered extended attribute is modified.
- INTEGRITY_HASH: The hash type integrity verification event run by the kernel.
- INTEGRITY_METADATA: The metadata integrity verification event run by the kernel.
- INTEGRITY_PCR: The Platform Configuration Register (PCR) invalidation messages.
- INTEGRITY_RULE: A policy rule.
- INTEGRITY_STATUS: The status of integrity verification.
Intrusion Prevention System:
- Anomaly detected:
- ANOM_ABEND
- ANOM_ACCESS_FS
- ANOM_ADD_ACCT
- ANOM_AMTU_FAIL
- ANOM_CRYPTO_FAIL
- ANOM_DEL_ACCT
- ANOM_EXEC
- ANOM_LINK
- ANOM_LOGIN_ACCT
- ANOM_LOGIN_FAILURES
- ANOM_LOGIN_LOCATION
- ANOM_LOGIN_SESSIONS
- ANOM_LOGIN_TIME
- ANOM_MAX_DAC
- ANOM_MAX_MAC
- ANOM_MK_EXEC
- ANOM_MOD_ACCT
- ANOM_PROMISCUOUS
- ANOM_RBAC_FAIL
- ANOM_RBAC_INTEGRITY_FAIL
- ANOM_ROOT_TRANS
- Responses:
- RESP_ACCT_LOCK_TIMED
- RESP_ACCT_LOCK
- RESP_ACCT_REMOTE
- RESP_ACCT_UNLOCK_TIMED
- RESP_ALERT
- RESP_ANOMALY
- RESP_EXEC
- RESP_HALT
- RESP_KILL_PROC
- RESP_SEBOOL
- RESP_SINGLE
- RESP_TERM_ACCESS
- RESP_TERM_LOCK
Miscellaneous:
- ALL: Matches all types.
- KERNEL_OTHER: The record information from third-party kernel modules.
- EOE: An end of a multi-record event.
- TEST: The success value of a test message.
- TRUSTED_APP: The record of this type can be used by third-party application that require auditing.
- TTY: The TTY input that was sent to an administrative process.
- USER_TTY: An explanatory message about TTY input to an administrative process that is sent from the user-space.
- USER: The user details.
- USYS_CONFIG: A user-space system configuration change is detected.
- TIME_ADJNTPVAL: The system clock is modified.
- TIME_INJOFFSET: A Timekeeping offset is injected to the system clock.
9.4 - Known Issues for the td-agent
Known Issue: The Buffer overflow error appears in the /var/log/td-agent/td-agent.log file.
Description: When the total size of the files in td-agent buffer /opt/protegrity/td-agent/es_buffer directory reaches the default maximum limit of 64 GB, then the Buffer overflow error appears.
Resolution:
Add the total_limit_size parameter to increase the buffer limit in the OUTPUT.conf file using the following steps.
Log in to the ESA Web UI.
Navigate to System > Services.
Under Misc, stop the td-agent service.
Log in to the CLI Manager of the ESA node.
Navigate to Administration > OS Console.
Navigate to the
/opt/protegrity/td-agent/config.ddirectory.Open the
OUTPUT.conffile.Add the total_limit_size parameter in the buffer section of the
OUTPUT.conffile.In this example, the total_limit_size is doubled to 128 GB.


Save the file.
Log in to the ESA Web UI.
Navigate to System > Services.
Under Misc, start the td-agent service.
Known Issue: The Too many open files error appears in the /var/log/td-agent/td-agent.log file.
Description: When the total number of files in the td-agent buffer /opt/protegrity/td-agent/es_buffer directory reaches the maximum limit, then the Too many open files error appears.
Resolution:
Change the limit for the maximum number of open files for the td-agent service in the /etc/init.d/td-agent file using the following steps.
Log in to the ESA Web UI.
Navigate to System > Services.
Under Misc, stop the td-agent service.
Log in to the CLI Manager of the ESA node.
Navigate to Administration > OS Console.
Navigate to the
/etc/init.ddirectory.Open the
td-agentfile.Change the ulimit.
In this example, the ulimit is increased to 120000.


Save the file.
Log in to the ESA Web UI.
Navigate to System > Services.
Under Misc, start the td-agent service.
9.5 - Known Issues for Protegrity Analytics
Known Issue: Client side validation is missing on the Join an existing Audit Store Cluster page.
Issue:
Log in to the ESA Web UI and navigate to the Audit Store > Cluster Management > Overview page >Join Cluster. When you specify an invalid IP, enter a username or password more than the 36-character limit that is accepted on the Appliance, and click Join Cluster, then no errors are displayed and the request is processed.
Observation:
The Join an existing Audit Store Cluster page request is processed without any client-side validation, hence, an invalid IP address or a username or password more than 36 characters does not display any error.
Known Issue: High memory usage on the ESA.
Issue:
When using the Audit Store, the memory usage is high on the ESA.
Workaround:
Reduce the memory usage by updating the memory allocated to the Audit Store on the ESA to 4 GB using the Set Audit Store Repository Total Memory CLI option.
For more information about the Set Audit Store Repository Total Memory CLI option, refer to Setting the total memory for the Audit Store Repository.
Known Issue: In Analytics, on the Index Lifecycle Management page, after exporting, importing, or deleting an index one of the following scenarios occurs:
- The index operation performed does not appear in the other operation lists. For example, an exported index does not appear in the import index list.
- Performing the same operation on the same index again displays an error message.
- If the index appears in another operation list, performing the operation displays an error message. For example, an exported index appears in the delete index list and deleting the index displays an error.
Issue: After performing an operation, the index list for the export, import, and delete operations does not refresh automatically.
Workaround: Refresh the Index Lifecycle Management page after performing an export, import, or delete operation.
Known Issue: The
Specifying types in document update requests is deprecated, use the endpoint /{index}/_update/{id} instead.error message might appear during an upgrade.Issue: While upgrading, the error trace is logged while disabling the rollover index.
Resolution: Ignore this message. It is a deprecation message and does not affect the upgrade or the functionality of the product.
Known Issue: The
Info: During upgrade, ignore errors related to unicast hosts file being empty.message might appear during an upgrade.Issue: While upgrading, the following errors might appear:
- ERROR: Unicast hosts file does not contain the IP addresses of the nodes and is empty. Run the Audit Store Management Unicast Hosts scheduled task.
- ERROR: Unicast hosts file is empty. Please add the IP and hostname entries for all the nodes in the Audit Store cluster in the Unicast hosts file /opt/protegrity/config/unicast_hosts.txt
Resolution: Ignore this message. It does not affect the functionality of the product. The upgrade fixes the entries in the unicast hosts file and the upgrade completes successfully.
Known Issue: The
Info: While upgrading nodes in an Audit Store cluster, if the checks passed on one of the nodes, then ignore errors for the Audit Store cluster verification on the other nodes.message might appear during an upgrade.Issue: While upgrading, the following errors might appear:
- ERROR: Audit Store version of the node across the cluster are inconsistent: {version}. Ensure the nodes are on the same ESA version.
- ERROR: Expecting appliance version {Version number}.
- ERROR: Expecting appliance version 10.1.X/10.0.X/9.2.0.X/9.1.0.X got {appliance_version}.
- ERROR: Cluster health check failed. Current status: {cluster_status}.Resolve the cluster health to stabilize the cluster.
- ERROR: Initializing shards check failed. Current value: {initializing_shards}. Wait till the shards are initialized and the value reaches zero.
- ERROR: Relocating shards check failed. Current value: {relocating_shards}. Wait till the shards are automatically rebalanced and the value reaches zero.
- ERROR: Unassigned shards check failed. Current value : {unassigned_shards}. Wait till the shards are processed and the value reaches zero.
Resolution: If the checks passed on one of the nodes while upgrading nodes in an Audit Store cluster, then ignore the message if it appears on the other nodes. It does not affect the functionality of the product. The upgrade of the muilti-cluster nodes will complete successfully.
9.6 - Known Issues for the Log Forwarder
Known Issue: The Protector is unable to reconnect to a Log Forwarder after it is restarted.
Description: This issue occurs whenever you have a Proxy server between a Protector and a Log Forwarder. When the Log Forwarder is stopped, the connection between the Protector and the Proxy server is still open, even though the connection between the Proxy server and the Log Forwarder is closed. As a result, the Protector continues sending audit files to the Proxy server. This results in loss of the audit files. Whenever the Log Forwarder is restarted, the Protector is unable to reconnect to the Log Forwarder.
This issue is applicable to all the Protectors where the Log Forwarder is not running on the local host machine. For example, this issue is applicable to AIX or z/OS protectors because the Log Forwarder is not running on the same machine where the Protectors have been installed. This issue also occurs if you have a Load Balancer or a Firewall between the Protector and the Log Forwarder, instead of a Proxy server.
Resolution: Remove the Proxy server or ensure that you configure the Proxy server in a way that the connection between the Protector and the Proxy server is stopped as soon as the Log Forwarder is stopped. This ensures that whenever the Log Forwarder is restarted, the Protector reconnects with the Log Forwarder and continues to send the audits to the Log Forwarder without any data loss.
For more information about configuring the Proxy server, contact your IT administrator.
9.7 - Deprecations
Deprecated Functions
Extract KeyID from Data getCurrentKeyId getDefaultDataElement Byte API
Database Protector
- native database access control
Deprecated Products
- Protection Server
- File Protector Gateway
- File Protector: Linux Kernel Implementation
- File Protector: Windows Bases Volume Encryption
- File Protector for AIX
- XC Client, XC Server, XC Lite
- Solaris operating system on all the Protectors
- HAWQ Big Data Component
- Linux Based Volume Encryption
Deprecated Capabilities
- HDFS FP
- ESA OS Based High Availability
- Samba
- Protegrity Storage Unit (PSU)
- Change in Insight behavior (from v9.0.0.0)
- Jasper Reporting
- Metering
- MapReduce
- HMAC API in BDP
- Gate in Upgrade
Deprecated Data Elements
Deprecated data elements can still be used. However, users will be unable to create these data elements using the GUI. Users can use the DevOps APIs to create these data elements. In this case, the system triggers a warning and create a log entry. This is to indicate that the data element is deprecated. In addition, the system triggers a notification if the policy contains any of the deprecated datatypes. The system triggers this notification while the hubcontroller service starts.
- Printable Characters Tokenization
- Unicode Gen 1 Tokenization
- Date Tokenization
- DTP 2 Encryption
- 3DES Encryption
- CUSP 3DES Encryption
- SHA1 Hashing
- Date tokens (DATE-YYYY-MM-DD, DATE-DD/MM/YYYY, DATE-MM/DD/YYYY )
- UNICODE tokens
- PRINTABLE tokens
- UNICODE-Base 64 tokens
- SHA1
- 3DES
Removed Data Elements
The support for the Format Preserving Encryption (FPE) data element was started in the ESA v7.2.x.
If the FPE left/right data element is created in any version of the ESA, from 7.2.x to 9.2.x, then there is a risk of data loss.
The data encoding can have an effect on the resulting token when the Left and Right properties are in use. This means that FPE tokens with this property cannot always be moved “as-is” to other systems where the encoding of the data changes.
In ESA v10.0.1,
- The upgrade is blocked if the FPE left/right data element is created.
- A new solution is created to support the FPE left/right data element. This solution works only when the protectors of version 10.0.0 or newer are used.
10 - Intellectual Property Attribution Statement
Copyright © 2004-2026 Protegrity Corporation. All rights reserved.
Protegrity products are protected by and subject to patent protections;
Patent: https://support.protegrity.com/patents/.
Protegrity® and the Protegrity logo are the registered trademarks of Protegrity Corporation.
NOTICE TO ALL PERSONS RECEIVING THIS DOCUMENT
Some of the product names mentioned herein are used for identification purposes only and may be trademarks and/or registered trademarks of their respective owners.
Windows, Azure, MS-SQL Server, Internet Explorer and Internet Explorer logo, Active Directory, and Hyper-V are registered trademarks of Microsoft Corporation in the United States and/or other countries.
Linux is a registered trademark of Linus Torvalds in the United States and other countries.
UNIX is a registered trademark of The Open Group in the United States and other countries.
SCO and SCO UnixWare are registered trademarks of The SCO Group.
Sun, Oracle, Java, and Solaris are the registered trademarks of Oracle Corporation and/or its affiliates in the United States and other countries.
Teradata and the Teradata logo are the trademarks or registered trademarks of Teradata Corporation or its affiliates in the United States and other countries.
Hadoop or Apache Hadoop, Hadoop elephant logo, Hive, Presto, and Pig are trademarks of Apache Software Foundation.
Cloudera and the Cloudera logo are trademarks of Cloudera and its suppliers or licensors.
Hortonworks and the Hortonworks logo are the trademarks of Hortonworks, Inc. in the United States and other countries.
Greenplum Database is the registered trademark of VMware Corporation in the U.S. and other countries.
Pivotal HD is the registered trademark of Pivotal, Inc. in the U.S. and other countries.
PostgreSQL or Postgres is the copyright of The PostgreSQL Global Development Group and The Regents of the University of California.
AIX, DB2, IBM and the IBM logo, and z/OS are registered trademarks of International Business Machines Corp., registered in many jurisdictions worldwide.
Utimaco Safeware AG is a member of the Sophos Group.
Jaspersoft, the Jaspersoft logo, and JasperServer products are trademarks and/or registered trademarks of Jaspersoft Corporation in the United States and in jurisdictions throughout the world.
Xen, XenServer, and Xen Source are trademarks or registered trademarks of Citrix Systems, Inc. and/or one or more of its subsidiaries, and may be registered in the United States Patent and Trademark Office and in other countries.
VMware, the VMware “boxes” logo and design, Virtual SMP and VMotion are registered trademarks or trademarks of VMware, Inc. in the United States and/or other jurisdictions.
Amazon Web Services (AWS) and AWS Marks are the registered trademarks of Amazon.com, Inc. in the United States and other countries.
HP is a registered trademark of the Hewlett-Packard Company.
HPE Ezmeral Data Fabric is the trademark or registered trademark of Hewlett Packard Enterprise in the United States and other countries.
Dell is a registered trademark of Dell Inc.
Novell is a registered trademark of Novell, Inc. in the United States and other countries.
POSIX is a registered trademark of the Institute of Electrical and Electronics Engineers, Inc.
Mozilla and Firefox are registered trademarks of Mozilla foundation.
Chrome and Google Cloud Platform (GCP) are registered trademarks of Google Inc.
Kubernetes is a registered trademark of the Linux Foundation in the United States and/or other countries.
OpenShift is a trademark of Red Hat, Inc., registered in the United States and other countries.
Docker and the Docker logo are trademarks or registered trademarks of Docker, Inc. in the United States and/or other countries.
11 - Policy Management
Data Security Policy is at the core of Protegrity’s platform. A policy is a set of rules that governs how sensitive data is protected, and who in the organization can see the data in the clear. Sensitive data can include Personally Identifiable Information (PII), financial information, health-related information, and so on. A Data Security Policy is enforced within different systems and environments in the enterprise, providing the same level of security regardless of the location of the sensitive data.
This section focuses on the policy management, specifically on how policies are created, maintained, and distributed within the enterprise. All features covered in this section are accessible through the ESA Web UI. You can also create, manage, and view policies using the Policy Management API.
For more information about the Policy Management API, refer to the section Protegrity REST APIs.
11.1 - Protegrity Data Security Methodology
Protegrity’s Data Security Methodology consists of the following stages:
- Classification
- Discovery
- Protection
- Enforcement
- Monitoring
The following diagram summarizes each stage:
Classification
In the Classification stage, determine which data is considered sensitive for the enterprise, and why it needs to be protected. At this stage, it is important to understand the regulatory landscape in which the company is operating and the risk measurement framework associated with the privacy risk. An enterprise may need to meet certain regulatory compliance requirements or laws, such as:
- Payment Card Industry Data Security Standard (PCI DSS)
- Health Information Portability and Accessibility Act (HIPAA)
Discovery
The Discovery stage aims to answer three questions:
- Where is the data?
- How do you want to protect it?
- Who is authorized to view it in the clear?
First, identify the systems storing and processing sensitive data. Obtain this information through manual investigation by utilizing information captured through a data catalog, or by a combination of both. After the overall system architecture is known, devise an integration path using Protegrity components to provide the deepest coverage for the environment. Then, capture business rules to understand the data transformations required, and define requirements for user-level access.
The systems storing and processing sensitive data are specified as Data Stores in the Policy.
Then, decide how the sensitive data that has been identified will be protected. Identify which cryptographic algorithm or protection method matches the sensitivity and type of data in scope. Some data types may require strict protection rules, such as tokenizing credit card numbers. Conversely, some data types such as email addresses may be protected by masking or access monitoring.
The rules protecting every data type are defined as Data Elements in the Policy.
Finally, define roles to identify the users requiring access to sensitive data, and the extent of this access. As a general rule, most users in the organization will not have the authorization to see the data in the clear. Only specific groups of users will require some visibility over sensitive data to perform their job functions. During the Discovery phase, these roles are defined and mapped to the corporate directory services such as LDAP.
Protection
The Protection stage implements the Protegrity Data Security Platform in the enterprise, based on the earlier defined architectural and system requirements.
Enforcement
The Data Security Policy enforcement stage is a critical stage of the process. This is when data security becomes an integral part of the organizational work flow, ensuring its end-to-end protection and access are seamless across systems.
Monitoring
All operations on data generate audit logs that are sent near-real time to the specified collection points. The Security Administrator or Officer must monitor the logs to ensure that the rules are enforced as designed and look for any anomalies. Auditing provides an overview of how the data is being used by the organization. All system and policy-related changes are also captured and made available.
11.2 - Policy Components
A Policy contains multiple components that work together to enforce data security at the protection endpoints. The following components can exist in the Policy:
Some of these components have dependencies between each other. Masks and Alphabets are referenced from Data Elements. For example, if you want to create a Gen2 Unicode tokenization Data Element that covers all French characters, then you first need to create an Alphabet. Trusted Applications are attached to Data Stores, as they enable deploying the policy to named applications. Member Sources are referenced within Roles, which in turn pull them into the Policy. Hence, only the parent components such as Data Elements, Roles, and Data Stores are referenced at the Policy level.
The following section provides a walkthrough of a typical process of creating a Policy, from creating Data Elements to Roles. You can follow a different sequence, if preferred, understanding the dependencies between the components.
11.2.1 - Data Elements
Data Elements are the most critical elements of data protection. Data Elements determine how cryptographic algorithms are applied to data.
Typically, there is one Data Element per data type. For example, name, address, or credit card number. This allows for granular enforcement of control over sensitive data.
Protegrity supports two types of Data Elements:
- Structured: Used for fine-grained field- and column-level protection. For example, a name attribute in a JSON file, or a column in a database table storing customer names.
- Unstructured: Used for course-grained file protection. It is only applicable to the Protegrity File Protector.
To create, view and manage Data Elements, navigate to Policy Management from the main menu, and choose Data Elements & Masks. The Data Elements tab opens by default.
Creating Data Elements
Before creating a Data Element, understand the type and format of data that you are protecting, and what is your desirable output. For example, if length and format preservation are required, tokenization or Format Preserving Encryption (FPE) are the recommended methods.
For guidance regarding the protection methods, refer to the section Protection Method Reference.
To add a new Data Element:
On the ESA Web UI, navigate to Policy Management > Data Elements & Masks.
The Data Elements tab appears by default.
Click Add New Data Element.
The New Data Element screen appears.
Specify the following common properties for each Data Element:
Property Description Type Type of the Data Element to be created.
For example, structured or unstructured.Name Unique name identifying the data element.
The maximum length of the data element is 55 characters.Description Text describing the Data Element. Method Types of data protection to apply: - Tokenization
- Encryption
- Format Preserving Encryption (FPE)
- Hashing
- Masking
- Monitoring
Depending on the chosen protection method, additional configuration options appear. For example, Encryption has an option to use Initialization Vectors, while Tokenization shows different tokenization options depending on the data type.
For more information about the available protection methods and their properties, refer to the section Protection Methods Reference.Click Save.
Note: You can use the Policy Management REST API to create Data Elements.
Managing Data Elements
After a Data Element is created, it cannot be modified. You can only provide a new description for the Data Element.
Deleting Data Elements
A Data Element can be deleted. It must first be removed from all policies where it has been attached before it can be removed.
To remove a Data Element:
On the ESA Web UI, navigate to Policy Management > Data Elements & Masks.
The Data Elements tab appears by default.
Select the Data Element from the list, and click the Delete action.
A confirmation dialog box appears.
Click OK.
A message Data Element has been deleted successfully appears.
Warning: The Delete action cannot be reversed. By deleting a Data Element, you are effectively removing the cryptographic material associated with that Data Element. You will lose the ability to re-identify the data protected with that Data Element. You can only restore Data Elements by restoring the Policy from a backup file.
11.2.1.1 - Example - Creating a Token Data Element
Note: You create token data elements for all protectors, except for the FileProtector.
To create a structured data element:
On the ESA Web UI, navigate to Policy Management > Data Elements & Masks > Data Elements.
Click Add New Data Element.
The New Data Element screen appears.
Select Structured from Type.
Type a unique name for the data element in the Name textbox.
Note: Ensure that the length of the data element name does not exceed 55 characters.
Type the description for the data element in the Description textbox.
Select the protection method from the Method drop-down. In this example, select Tokenization.
Select the tokenization data type from the Data Type drop down. In this example, select Numeric (0-9).
For more information about the different data types, refer to the section Protection Methods Reference.
Select the tokenizer from the Tokenizer drop-down.
For more information about the different token elements, refer to the section Protection Methods Reference.
If the Tokenizer should leave characters in clear, then set the number of characters from left and from right in the From Left and From Right text boxes.
For more information on the maximum and minimum input values for these fields, refer to the section Minimum and Maximum Input Length in the section Protection Methods Reference.
If the token length needs to be equal to the provided input, then select the Preserve length check box.
If you select the Preserve length option, then you can also choose the behavior for short data tokenization in the Allow Short Data drop-down.
- Click Save.
A message Data Element has been saved successfully appears.
11.2.1.2 - Example - Creating a FPE Data Element
To create a structured FPE data element:
On the ESA Web UI, navigate to Policy Management > Data Elements & Masks > Data Elements.
Click Add New Data Element.
The New Data Element screen appears.
Select Structured from Type.
Enter a unique name for the data element in the Name textbox.
Note: Ensure that the length of the data element name does not exceed 55 characters.
Type the description for the data element in the Description textbox.
Select FPE NIST 800-38G from the Method drop-down.
Select a data type from the Plaintext Alphabet drop-down.
Configure the minimum input length from the Minimum Input Length text box.
Select the tweak input mode from the Tweak Input Mode drop-down.
For more information about the tweak input mode, refer to the section Tweak Input in the Protection Methods Reference Guide.
Select the short data configuration from the Allow Short Data drop-down.
Note: FPE does not support data less than 2 bytes, but you can set the minimum message length value accordingly.
For more information about length preservation and short tokens, refer to section Length Preserving.
Note: If you create a short data token in a policy and then deploy the policy, the Forensics displays a policy deployment warning indicating that the data element has unsupported settings.
Enter the required input characters to be retained in the clear in the From Left and From Right text box.
For more information about this setting, refer to the section Left and Right Settings.
Configure any special numeric data handling request, such as Credit Card Number (CCN), in the Special numeric alphabet handling drop-down.
For more information about handling special numeric data, refer to the section Handling Special Numeric Data.
Click Save.
A message Data Element has been created successfully appears.
11.2.1.3 - Example - Creating a Data Element for Unstructured Data
Note: Unstructured data elements are exclusively applicable to Protegrity File Protector.
To create an unstructured data element:
On the ESA Web UI, navigate to Policy Management > Data Elements & Masks > Data Elements.
Click Add New Data Element.
The New Data Element screen appears.
Select Unstructured from Type.
Type a unique name for the data element in the Name textbox.
Note: Ensure that the length of the data element name does not exceed 55 characters.
Type the required description for the data element in the Description textbox.
Select AES-256 from the Method drop-down list.
If you want to enable multiple instances of keys with the data element, then check the Use Key ID (KID) checkbox.
Click Save.
A message Data Element has been saved successfully appears.
11.2.2 - Alphabets
Alphabets are groupings of Unicode character sets. Their main purpose is to support additional languages or character input domains that exist in the user’s environment, such as Spanish, Polish, or Korean. The ESA includes some pre-defined alphabets. Users can create their own custom alphabets.
The alphabets are supported with the Tokenization Data Elements of the Unicode Gen2 type.
For more information about the code points and considerations around creating alphabets, refer to the section Considerations while creating custom Unicode alphabets.
Creating Alphabets
To create an alphabet:
On the ESA Web UI, navigate to Policy Management > Data Elements & Masks > Alphabets.
Click Add New Alphabet.
The New Alphabet screen appears.
Enter a unique name for the alphabet in the Name text box.
Under the Alphabet tab, click Add to add existing alphabets or custom code points to the new alphabet.
The Add Alphabet entry screen appears.
If you plan to use multiple alphabet entries to create a token alphabet, then click Add again to add other alphabet entries.
Ensure that code points in the alphabet are supported by the protectors using this alphabet.
Select an existing alphabet, a custom code point, or a range of custom code points.
The following options are available for creating an alphabet.
Important: For the SLT_1_3 tokenizer, you must include a minimum of 10 code points and a maximum of 160 code points.
Important: For the SLT_X_1 tokenizer, you must include a minimum of 161 code points and a maximum of 100k code points.
Alphabet Option Description Existing Alphabets Select one of the existing alphabets. The list includes internal and custom alphabets. Custom code point in hex (0020-3FFFF) Add custom code points that will be used to generate the token value. Custom code point range in hex (0020-3FFFF) Add a range of code points that will be used to generate the token value.
Note: When creating an alphabet using the code point range option, note that the code points are not validated.
For more information about consideration related to defining code point ranges, refer to the section Considerations while creating custom Unicode alphabets.Click Add to add the alphabet entry to the alphabet.
Click Save to save the alphabet.
Important: Only the alphabet characters that are supported by the Operating System fonts are rendered properly on the Web UI.
A message Alphabet has been created successfully appears.
Managing Alphabets
After an Alphabet is created, it cannot be modified.
Deleting Alphabets
To remove an Alphabet:
On the ESA Web UI, navigate to Policy Management > Data Elements & Masks > Alphabets.
The Alphabets tab appears.
Select the Alphabet from the list, and click the Delete action.
A confirmation dialog box appears.
Click OK.
A message Alphabet has been deleted successfully appears.
11.2.3 - Masks
Masks are patterns of symbols or characters that can be applied to obfuscate the content of a field. Masks can obfuscate data completely or partially. For example, a partial mask might display the last four digits of a credit card number on a grocery store receipt, while masking the first twelve digits.
You can combine Masks with Data Elements. In this scenario, Masks are applied during presentation to the end-user, after the data has been unprotected. You can also apply Masks on their own, through a Masking Data Element.
You can create, view, and manage Masks by navigating to Policy Management from the main menu, and choosing Data Elements & Masks.
For more information about the properties and behavior of Masks, refer to the section Masking.
Creating Masks
To add a new Data Element:
On the ESA Web UI, navigate to Policy Management > Data Elements & Masks > Masks.
The Masks tab appears by default.
Click Add New Mask.
The New Mask screen appears.
Specify the following common properties for the Mask:
Property Description Name Unique name to identify the mask. Description Text describing the mask. Mask Template A pre-defined mask template to use.
For detailed characteristics of each Mask Template, refer to the section Masking.Mask Options Detailed characteristics of how a mask is applied on data. From Left / From Right The number of characters from left and right for additional configuration. Mask mode Mask or clear the characters specified in the From Left / From Right property. Mask character The character used for masking. Sample Output Mask simulation based on mask options. Click Save.
Managing Masks
Masks can be fully modified after they have been created.
To modify a Mask:
On the ESA Web UI, navigate to Policy Management > Data Elements & Masks > Masks.
The Masks tab appears.
Click the name of the Mask that you want to modify from the list.
A screen appears displaying the Mask details.
Edit the required details.
Click Save.
A message Mask has been updated successfully appears.
Deleting Masks
To remove a Mask:
On the ESA Web UI, navigate to Policy Management > Data Elements & Masks > Masks.
The Masks tab appears.
Select the name of the Mask from the list, and click the Delete action.
A confirmation dialog box appears.
Click OK.
A message Mask has been deleted successfully appears.
11.2.3.1 - Example - Creating a Mask from a Template
To create a mask:
On the ESA Web UI, navigate to Policy Management > Data Elements & Masks > Masks.
Click Add New Mask.
The New Mask screen appears.
Enter a unique name for the mask in the Name text box.
Enter the description for the mask in the Description textbox.
Select CCN 6X4 from the Mask Template drop-down.
Select Clear from Mask Mode.
Select the masking character from the Character drop-down.
Click Save.
A message Mask has been saved successfully appears.
11.2.4 - Trusted Applications
Note: Trusted Applications are applicable only for Application Protector. Skip this section if you are not using the Application Protector.
A Trusted Application is an entity that defines which system users and applications are authorized to run the Application Protector. Using a Trusted Application adds another layer of security for operating the system.
A single Trusted Application instance covers a single application and its corresponding system user. Multiple users and applications are not supported under a single Trusted Application and must be created separately.
Creating Trusted Applications
To create a Trusted Application:
On the ESA Web UI, navigate to Policy Management > Policies & Trusted Applications > Trusted Applications.
Click Add New Trusted Application.
The New Trusted Application screen appears.
Type a unique name to the trusted application in the Name textbox.
Type the required description to the trusted application in the Description textbox.
Type the name of the application in the Application Name textbox.
The maximum length of an Application Name is up to 63 characters.
Important: In case of AP Java and AP Go applications, ensure that you specify the complete module or package name.
In the application name, you can type the asterisk (*) wild card character to represent multiple characters or the question mark (?) wild card character to represent a single character. You can also use multiple wild card characters in the application name.
For example, if you specify Test_App* as the application name, then you can use applications with names, such as, Test_App1 or Test_App123 to perform security operations.
Caution: Use wild card characters with discretion, as they can potentially lead to security threats.
Type the name of the application user in the Application User textbox.
In the application user name, you can type the asterisk (*) wild card character to represent multiple characters or the question mark (?) character to represent a single character. You can also use multiple wild card characters in the application user name.
For example, if you specify User* as the application user name, then you can have users with names, such as, User1 or User123 to perform security operations.
Caution: Use wild card characters with discretion, as they can potentially lead to security threats.
Click Save.
A message Trusted Application has been created successfully appears.
Managing Trusted Applications
Trusted Applications can be fully modified after they have been created.
Deleting Trusted Applications
To remove a Trusted Application:
On the ESA Web UI, navigate to Policy Management > Policies & Trusted Applications > Trusted Applications.
The Trusted Applications tab appears.
Select the name of the Trusted Application from the list, and click the Delete action.
A confirmation dialog box appears.
Click OK.
A message Trusted Application has been deleted successfully appears.
11.2.4.1 - Linking Data Store to a Trusted Application
To link a trusted application to a data store:
On the ESA Web UI, navigate to Policy Management > Policies & Trusted Applications > Trusted Applications.
The list of all the trusted applications appear.
Select the required trusted application.
The screen to edit the trusted application appears.
Under the Data Stores tab, click Add.
The screen to add the data stores appears.
Select the required data stores.
Click Add.
A message Select Data Stores have been added to Trusted Application successfully appears.
11.2.5 - Data Stores
A Data Store is a central concept in Policy Management. It is another built-in safety mechanism for operating the system securely. Data Stores group the Protector locations and the relevant Policies. Only the allowed servers are able to pull the Policy and enforce it.
If more flexibility is required, you can create a default Data Store that deploys the Policy to any Protector that requests it from ESA. This is a valid strategy for Cloud Protectors, such as serverless functions and containers, that frequently update their IP ranges.
You can create, view, and manage Data Stores by navigating to Policy Management from the main menu, and choosing Data Stores.
Note: The maximum length of the data store name is 55 characters.
You cannot create multiple data stores with the same names. You can create only one default data store for a single instance of ESA.
Creating Data Stores
Perform the following steps to create a data store. The Policy Management REST API can also be used to create data stores. For those steps, refer to the Policy Management REST API.
To create a data store:
On the ESA Web UI, navigate to Policy Management > Data Stores.
The list of all the data stores appear.
Click Add New Data Store.
The New Data Store screen appears.
Enter a unique name identifying the data store in the Name textbox.
Enter the description describing the data store in the Description textbox.
Determine if the new Data Store should be a default Data Store by setting the value to Yes or No.
If a default data store already exists and you are updating another data store as the default data store, then the following message appears.
A default Data Store already exists, Please confirm to make this the new default Data Store.
Click Ok.
Click Save.
A message Data Store has been created successfully appears.
Managing Data Stores
Data Stores can be fully modified after they have been created.
Deleting Data Stores
To remove a Data Store:
On the ESA Web UI, navigate to Policy Management > Data Stores.
The Data Stores tab appears.
Select the name of the Data Store from the list, and click the Delete action.
A confirmation dialog box appears.
Click OK.
A message Data Store has been deleted successfully appears.
11.2.5.1 - Configuring Allowed Servers
A non-default Data Store will only allow specified servers to pull the dynamically deployed policy or package from it. The policies are applicable for protectors earlier than 10.0.x, while packages are applicable for 10.0.x protectors and later. The list of servers is controlled in the Allowed Servers section.
You may specify a single IP address or a range of IP addresses as Allowed Servers.
Note: Make sure to use IP addresses that are reachable from ESA.
To add Allowed Servers to a Data Store:
On the ESA Web UI, navigate to Policy Management > Data Stores.
The list of all the data stores appear.
From the Allowed Servers tab for the data store, click Add.
The Add Allowed Servers screen appears.
If you want to add a single server, then select Single Server and specify the server IP address.
If you want to add a range of servers, then Multiple Servers. Enter the range in the From and To text boxes.
Click Add.
The servers are added to the list of Allowed Servers.
11.2.5.2 - Export Keys
The data store export key is used to identify the data store and encrypt the resilient package. It is also used by the Node Administrator, who runs the DevOps API, to export the encrypted package. The export key is the public part of an asymmetric public-private key pair. A Key Management System (KMS) administrator, who is responsible for managing the cryptographic keys in your system, creates this public-private key pair in a Key Store. The KMS administrator then shares the public key with the user who has the Security Officer permission in the ESA. The Security Officer adds the public key to the data store. This step is required only if you are distributing the resilient package to Immutable Resilient protectors.
For more information, and example, of using the DevOps process in Immutable Resilient protectors, refer to the section DevOps Approach for Application Protector.
The Security Officer shares the fingerprint of the public key to the Node Administrator.
Adding Export Key
Use the following instructions to add a Public Key to a Data Store.
To add a Public Key to a Data Store:
On the ESA Web UI, navigate to Policy Management > Data Stores.
The list of all the data stores appear.
From the Export Keys tab for the data store, click Add.
The Add Export Key screen appears.
In the Algorithm drop-down list, specify one of the following options:
- RSA-OAEP-256
- RSA-OAEP-512
In case of AWS, the algorithm must be the same one that was selected by the KMS Administrator while creating the asymmetric key pair in the Key Store. Currently, AWS only supports RSA-OAEP-256.
In the Description field, add a description to reference the key pair. For example, specify the key name or the key ID.
In the Public key drop-down list, choose the PEM file that you have downloaded from the Key Store. The contents of the PEM file appear in the text box below. Alternatively, you can paste the contents of the PEM file in the text box.
Click Add.
The public key is added to the list of keys. A public key can be assigned to only one data store. However, a data store can contain multiple public keys.Click the Copy Fingerprint icon to copy the fingerprint of the public key without the colon separators.
The user exporting the resilient package uses this fingerprint in the DevOps API that is used to download the resilient package. Note that the DevOps API works even when the fingerprint contains colon separators.
Managing Export Key
After an export key is created, it cannot be modified. However, you can update the RSA algorithm to be used with the key and the description of the key. Only a user with Security Officer permissions can modify an export key.
To modify an export key:
On the ESA Web UI, navigate to Policy Management > Data Stores.
The list of all the data stores appear.
From the Export Keys tab for the data store, click the Edit Export Key icon for the specified key.
The Edit Export Key screen appears.
In the Algorithm drop-down list, modify the RSA algorithm to be used with the export key.
Note: In case of AWS, the algorithm must be the same one that was selected by the KMS Administrator while creating the asymmetric key pair in the Key Store. Currently, AWS only supports RSA-OAEP-256.
In the Description field, update the description as required.
Click Save to save the changes.
Deleting Export Key
Only a user with Security Officer permissions can delete an export key.
To remove an export key:
On the ESA Web UI, navigate to Policy Management > Data Stores.
The list of all the data stores appear.
From the Export Keys tab for the data store, click the Delete Export Key icon for the specified key.
A confirmation dialog appears.
Click OK.
A message Export Key has been removed from the Data Store successfully appears.
11.2.5.3 - Adding Trusted Applications to the Data Store
For more information about Trusted Applications, refer to the section Trusted Applications.
To add Trusted Application to a Data Store:
On the ESA Web UI, navigate to Policy Management > Data Stores.
The list of all the data stores appear.
Select the data store.
The screen to edit the data store appears.
Click the Trusted Applications tab.
Click Add.
The list of trusted applications created appear.
Select the trusted applications.
Click Add.
A message Selected Trusted Applications have been added to the Data Store successfully appears.
11.2.5.4 - Adding Policies to the Data Store
To add policy to a data store:
On the ESA Web UI, navigate to Policy Management > Data Stores.
The list of all the data stores appear.
Select the data store.
The screen to edit the data store appears.
Click the Policies tab.
Click Add.
The list of policies created appear.
Select the policies.
Click Add.
A message Selected Polices have been added to the Data Store successfully appears.
For more information on creating policies, refer to section Creating Policies.
11.2.6 - Member Sources
Member Sources specify the source location of users and groups that will be attached to the Policy Roles.
The following Member Sources are supported:
- User directory, such as:
- LDAP
- Posix LDAP
- Active Directory
- Azure AD
- Database
- Teradata
- Oracle
- SQL Server
- DB2
- PostgreSQL
- File
A Member Source configuration specifies the connection to the chosen directory for retrieving information on user and groups.
Creating Member Sources
The steps to create a member source depend on the source type, as shown in the following table.
| Source Type | Steps to Create Member Source |
|---|---|
| Active Directory | Configuring Active Directory Member Source |
| File | Configuring File Member Source |
| LDAP | Configuring LDAP Member Source |
| POSIX | Configuring POSIX Member Source |
| Azure AD | Configuring Azure AD Member Source |
| Database | Configuring Database Member Source |
Managing Member Sources
Member Sources can be fully modified after they have been created.
Deleting Member Sources
To remove a Member Source:
On the ESA Web UI, navigate to Policy Management > Roles & Member Sources > Member Sources.
The Member Sources tab appears.
Select the name of the member source from the list, and click the Delete action.
A confirmation dialog box appears.
Click OK.
A message Member Source has been deleted successfully appears.
Testing Connection
Before configuring the Member Source, it is advised to test that a connection to the specified directory can be established.
To test the connection, click Test adjacent to the Member Source entry from the list or from the respective Member Source screen. The Test Member Source Connection dialog box displays the status along with the following information:
- connection
- authentication
- groups
- users
Note: The password length of a member source on some platforms may have a limitation.
11.2.6.1 - Configuring Member Sources
Configure the Member Sources based on the source type, as shown in the following table.
| Source Type | Steps to Configure Member Source |
|---|---|
| Active Directory | Configuring Active Directory Member Source |
| File | Configuring File Member Source |
| LDAP | Configuring LDAP Member Source |
| POSIX | Configuring POSIX Member Source |
| Azure AD | Configuring Azure AD Member Source |
| Database | Configuring Database Member Source |
11.2.6.1.1 - Configuring Active Directory Member Source
To create an Active Directory member source:
On the ESA Web UI, navigate to Policy Management > Roles & Member Source > Member Sources.
Click Add New Member Source.
The New Member Source screen appears.
Enter a unique name of the file member source in the Name textbox.
Type the description in the Description textbox.
Select Active Directory from the Source Type drop-down list.
The Active Directory Member Source screen appears.
Enter the information in the directory fields.
The following table describes the directory fields for Active Directory member sources.
Field Name Description Host The Fully Qualified Domain Name (FQDN), or IP of the directory server. Port The network port on the directory server where the service is listening. TLS Options - The Use TLS option can be enabled to create secure communication to the directory server.
- The Use LDAPS option can be enabled to create secure communication to the directory server. LDAPS uses TLS/SSL as a transmission protocol.
Note: Selection of the LDAPS option is dependent on selecting the TLS option. If the TLS option is not selected, then the LDAPS option is not available for selection.Recursive Search The recursive search can be enabled to search the user groups in the active directory recursively. For example, consider a user group U1 with members User1, User2, and Group1, and Group1 with members User3 and User4. If you list the group members in user group U1 with recursive search enabled, then the search result displays User1, User2, User3, and User4. Base DN The base distinguished name where users can be found in the directory. Username The username of the Active Directory server. Password/Secret The password of the user binding to the directory server. Click Save.
A message Member Source has been created successfully appears.
11.2.6.1.2 - Configuring File Member Source
In Policy Management, the exampleusers.txt and examplegroups.txt are sample member source files that contain a list of users or groups respectively. These files are available on the ESA Web UI. You can edit them to add multiple user name or user groups. You can also create a File Member source by adding a custom file.
The examplegroups.txt has the following format.
[Examplegroups]
<groupusername1>
<groupusername2>
<groupusername3>
Note: Ensure that the file has read permission set for Others.
Important: The exampleusers.txt or examplegroups.txt files do not support the Unicode characters, which are characters with the
\Uprefix.
Viewing the List of Users and Groups in the Sample Files
This sections describes the steps to view the list of users and groups in the sample files.
To view list of users and groups in the sample files:
On the ESA Web UI, navigate to Settings > Systems > Files.
Click View, corresponding to
exampleusers.txtorexamplegroups.txtunder Policy Management-Member Source Service User Files and Policy Management-Member Source Service Group Files respectively.
The list of users in the exampleuser.txt file or examplegroups.txt file appear.
Creating File Member Source
This section describes the procedure on how to create a file member source.
To create file member source:
On the ESA Web UI, navigate to Policy Management > Roles & Member Source > Member Sources.
Click Add New Member Source.
The New Member Source screen appears.
Enter a unique name of the file member source in the Name textbox.
Type the description in the Description textbox.
Select File from the Source Type drop-down list.
Select Upload file from the User File drop-down list.
Click the Browse.. icon to open the file browser.
Select the user file.
Click Upload File icon.
A message User File has been uploaded successfully appears.
Select Upload file from the Group File drop-down list.
Click the Browse.. icon to open the file browser.
Select the group file.
Click Upload File icon.
A message Group File has been uploaded successfully appears.
Click Save.
A message Member Source has been created successfully appears.
11.2.6.1.3 - Configuring LDAP Member Source
To create an LDAP member source:
On the ESA Web UI, navigate to Policy Management > Roles & Member Source > Member Sources.
Click Add New Member Source.
The New Member Source screen appears.
Enter a unique name of the file member source in the Name textbox.
Type the description in the Description textbox.
Select LDAP from the Source Type drop-down list.
The LDAP Member Source screen appears.
Enter the information in the LDAP member source fields.
The following table describes the directory fields for LDAP member sources.
Field Name Description Host The Fully Qualified Domain Name (FQDN), or IP of the directory server. Port The network port on the directory server where the service is listening. Use TLS The TLS is enabled to create a secure communication to the directory server. LDAPS, which is deprecated, is no longer the supported protocol. TLS is the only supported protocol. User Base DN The base distinguished name where users can be found in the directory. The user Base DN is used as the user search criterion in the directory. Group Base DN The base distinguished name where groups can be found in the directory. The group base dn is used as a group search criterion in the directory. User Attribute The Relative Distinguished Name (RDN) attribute of the user distinguished name. Group Attribute The RDN attribute of the group distinguished name. User Object Class The object class of entries where user objects are stored. Results from a directory search of users are filtered using user object class. Group Object Class The object class of entries where group objects are stored. Results from a directory search of groups are filtered using group object class. User Login Attribute The attribute intended for authentication or login. Group Members Attribute The attribute that enumerates members of the group. Group Member is DN The members may be listed using their fully qualified name, for example, their distinguished name or as in the case with the Posix user attribute (cn) value. Timeout The timeout value when waiting for a response from the directory server. Bind DN The DN of a user that has read access, rights to query the directory. Password/Secret The password of the user binding to the directory server Parsing users from a DN instead of querying the LDAP server: By default, a user is not resolved by querying the external LDAP server. Instead, the user is resolved by parsing the User Login Attribute from the Distinguished Name that has been initially retrieved by the Member Source Service. This option is applicable only if the Group Member is DN option is enabled while configuring the Member Source. In this case, the members must be listed using their fully qualified name, such as their Distinguished Name. If the ESA is unable to parse the DN or the DN is not available in the specified format, the user is resolved by querying the external LDAP server.
Click Save.
A message Member Source has been created successfully appears.
11.2.6.1.4 - Configuring POSIX Member Source
You can retrieve users and user groups from any external LDAP and Posix LDAP. The internal LDAP available on ESA, uses the Posix schema. Thus, when using ESA, it is recommended to use Posix LDAP to configure the connection with the internal ESA LDAP.
To create a Posix LDAP member source:
On the ESA Web UI, navigate to Policy Management > Roles & Member Source > Member Sources.
Click Add New Member Source.
The New Member Source screen appears.
Enter a unique name of the file member source in the Name textbox.
Type the description in the Description textbox.
Select Posix LDAP from the Source Type drop-down list.
The Posix LDAP Member Source screen appears.
Enter the information in the directory fields.
The following table describes the directory fields for Posix LDAP member source.
Field Name Description Host The Fully Qualified Domain Name (FQDN), or IP of the directory server. Port The network port on the directory server where the service is listening. Use TLS The TLS can be enabled to create a secure communication to the directory server. Base DN The base distinguished name where users can be found in the directory. Username The username of the Posix LDAP server. Password/Secret The password of the user binding to the directory server. Click Save.
A message Member Source has been created successfully appears.
11.2.6.1.5 - Configuring Azure AD Member Source
To create an Azure AD member source:
On the ESA Web UI, navigate to Policy Management > Roles & Member Sources > Member Sources.
Click Add New Member Source.
The New Member Source screen appears.
Enter a unique name of the Azure AD member source in the Name textbox.
Type the description in the Description textbox.
Select Azure AD from the Source Type drop-down list.
The Azure AD Member Source screen appears.
Enter the information in the directory fields.
The following table describes the directory fields for the Azure Active Directory member sources.
Field Name Description Recursive Search The recursive search can be enabled to search the user groups in the Azure AD recursively. Tenant ID The unique identifier of the Azure AD instance Client ID The unique identifier of an application created in Azure AD Environment The Azure cloud environment used for the Azure AD Member Source.
Default value is “Public Cloud”.User Attribute The Relative Distinguished Name (RDN) attribute of the user distinguished name. The following user attributes are available:
- displayName - The name displayed in the address book for the user.
- userPrincipalName - The user principal name (UPN) of the user.
- givenName - The given name (first name) of the user.
- employeeId - The employee identifier assigned to the user by the organization.
- id - The unique identifier for the user.
- mail - The SMTP address for the user.
- onPremisesDistinguishedName - Contains the on-premises Active Directory distinguished name (DN).
- onPremisesDomainName - Contains the on-premises domainFQDN, also called dnsDomainName, synchronized from the on-premises directory.
- onPremisesSamAccountName - Contains the on-premises samAccountName synchronized from the on-premises directory.
- onPremisesSecurityIdentifier - Contains the on-premises security identifier (SID) for the user that was synchronized from the on-premises setup to the cloud.
-onPremisesUserPrincipalName - Contains the on-premises userPrincipalName synchronized from the on-premises directory.
- securityIdentifier - Security identifier (SID) of the user, used in Windows scenarios.Group Attribute The RDN attribute of the group distinguished name. The following group attributes are available:
- displayName - The display name for the group.
- id - The unique identifier for the group.
- mail - The SMTP address for the group.
- onPremisesSamAccountName - Contains the on-premises SAM account name synchronized from the on-premises directory.
- onPremisesSecurityIdentifier - Contains the on-premises security identifier (SID) for the group that was synchronized from the on-premises setup to the cloud.
- securityIdentifier - Security identifier of the group, used in Windows scenarios.Group Members Attribute The attribute that enumerates members of the group.
Note: Ensure to select the same Group Members Attribute as the User Attribute.
The following group members attributes are available:
- displayName - The name displayed in the address book for the user.
- userPrincipalName - The user principal name (UPN) of the user.
- givenName - The given name, or first name, of the user.
- employeeId - The employee identifier assigned to the user by the organization.
- id - The unique identifier for the user.
- mail - The SMTP address for the user.
- onPremisesDistinguishedName - Contains the on-premises Active Directory distinguished name (DN).
- onPremisesDomainName - Contains the on-premises domainFQDN, also called dnsDomainName, synchronized from the on-premises directory.
- onPremisesSamAccountName - Contains the on-premises samAccountName synchronized from the on-premises directory.
- onPremisesSecurityIdentifier - Contains the on-premises security identifier (SID) for the user that was synchronized from the on-premises setup to the cloud.
- onPremisesUserPrincipalName - Contains the on-premises userPrincipalName synchronized from the on-premises directory.
- securityIdentifier - Security identifier (SID) of the user, used in Windows scenarios.Password/Secret The client secret is the password/secret of the Azure AD application. Click Save.
A message Member Source has been created successfully appears.
11.2.6.1.6 - Configuring Database Member Source
You use the Database type to obtain users from database, such as, SQL Server, Teradata, DB2, PostgreSQL, or Oracle. An ODBC connection to the database must be setup to retrieve user information.
The following table describes the connection variable settings for the databases supported in Policy Management.
| Database Type | Database |
|---|---|
| SQLSERVER | System DSN Name (ODBC). For example, SQLSERVER_DSN. |
| TERADATA | System DSN Name (ODBC). For example, TD_DSN. |
| ORACLE | Transport Network Substrate Name (TNSNAME). |
| DB2 | System DSN Name (ODBC). For example, DB2DSN. |
| POSTGRESQL | System DSN Name. For example, POSTGRES. |
Creating Database Member Source
This section describes the procedure on how to create a database member source.
To create a Database Member Source:
On the ESA Web UI, navigate to Policy Management > Roles & Member Source > Member Sources.
Click Add New Member Source.
The New Member Source screen appears.
Enter a unique name for the file member source in the Name text box.
Type the description in the Description text box.
Select Database from the Source Type drop-down list.
Select one of the following database from the Source drop-down list.
- Teradata
- Oracle
- SQL Server
- DB2
- PostgreSQL
To enable the usage of a custom data source name, switch the Use Custom DSN toggle.
- Enter the custom data source name in the DSN text box.
- Ensure that the specified DSN is present in the odbc.ini configuration file located in the /opt/protegrity/mbs/conf/ directory.
If you are selecting the Oracle database as the source database, then enter the service name in the Service Name text box.
Note: This step is applicable for the Oracle database only.
If you are not using Custom DSN, then the following steps are applicable.
Enter the database name in the Database text box.
Enter the host name in the Host text box.
Enter the port to connect to the database in the Port text box.
Enter the username in the Username text box.
Enter the password in the Password text box.
Click Save.
The message Member Source has been created successfully appears.
11.2.7 - Roles
A Role is a grouping of users that interacts with data in Protegrity Data Security Platform. A Role can consist of users, groups, or a combination of both. It can be configured for Manual, Automatic, or Semi-Automatic retrieval of its members. Each Role is associated with specific data access privileges in the policy.
You can create, view, and manage Roles by navigating to Policy Management from the main menu, and choosing Roles & Member Sources.
Creating Roles
To create a role:
On the ESA Web UI, navigate to Policy Management > Roles & Member Source > Roles.
Click Add New Role.
The New Role screen appears.
Enter a unique name for the role in the Name textbox.
Note: Ensure that the length of the role name does not exceed 55 characters.
Enter the required description for the role in the Description textbox.
In the Mode drop-down, select a refresh mode.
For more information about about mode types for a role, refer to section Role Refresh Modes.
If you want to apply this role to all members in all the member sources, click Applicable to all members. If enabled, the role is applied to all members in users or groups that do not belong to any other role.
Note: It is recommended to enable Applicable to all members option only for unauthorized user roles. Using it for authorized roles may result in unintentionally open access level to sensitive data.
Click Save.
Managing Roles
Roles can be fully modified after they have been created.
Deleting Roles
To remove a Role:
On the ESA Web UI, navigate to Policy Management > Roles & Member Sources.
The Roles tab appears by default.
Select the name of the role from the list, and click the Delete action.
A confirmation dialog box appears.
Click OK.
A message Role has been deleted successfully appears.
11.2.7.1 - Role Refresh Modes
The Member Sources that you have configured will change over time, as users and groups are added and removed. You can control how those changes are deployed to the Policy by choosing your preferred Refresh Mode.
The following three refresh modes are supported for the Roles:
Manual Mode
In Manual Mode, you manually synchronize the Role members and manually deploy the Policy. For more information on synchronizing members, please refer to the section Managing Members in a Role.After the synchronization is done, you must set the Policies linked to the Role as Ready to Deploy, followed by deploying the Policy manually.
The Manual Mode accepts both groups and users.
Semi-Automatic Mode
In Semi-Automatic Mode, you manually synchronize the Role members, whilst the Policy deployment is automatic. For more information on synchronizing members, please refer to the section Managing Members in a Role.The updated Policy is deployed automatically after the synchronization.
The Semi-Automatic Mode accepts groups only.
Automatic Mode
In Automatic Mode, both the Role member synchronization and the Policy deployment are automatic. The updated Policy is deployed automatically after the synchronization.The Automatic Mode accepts groups only.
Automatic Synchronization and Deployment
Synchronization is performed by the Member Source component. Every hour it pulls the latest changes made in the external Member Sources such as LDAP, AD, file, or database. HubController communicates with the Member Source to update the policy with any changes detected in Roles.
Role Conflicts
The HubController checks for conflicts in the user name capitalization. If there are users of the same name, but different capitalization, that are configured within different roles, an error will be generated in the Hub Controller logs.
This error appears in the Notifications section of the ESA dashboard to inform you that such conflicting users have been found. The error specifies the correlation ID of the HubController audit log that has been generated. To identify the conflicting users, navigate to the Discover page in the Audit Store Dashboards and search for the specified correlation ID.
11.2.7.2 - Adding Members to a Role
To add Members to a Role:
On the ESA Web UI, navigate to Policy Management > Roles & Member Source > Roles.
Click on the role name link to which you want to add members.
The selected role screen appears.
In the Members tab, click Add.
The Add Members screen appears.
In the Choose Member Source drop-down, select the Member Source.
In the Display Member Type drop-down, select the member type.
Automatic or Semi-Automatic mode causes the removal of members of type Users from the role. The Display Member Type drop-down is disabled in this case with default Group member type.
Enter the filter parameter in the Filter Members text box.
It accepts characters such as
*to display all results or word search to search with a word.For more information about filtering members from AD and LDAP member sources, refer to the sections Filtering Members from AD and LDAP Member Sources and Filtering Members from Azure AD Member Source.
Select the number of display results in the Display Number of Results spin box.
Click Next.
The step 2 of Add Members dialog box appears.
Select the check box next to each member you want to add.
Click Add.
The selected members are added to the role.
**Note:** The **ID** column displays the unique identifier for the Azure AD, Posix LDAP and Active Directory member sources.
- Click Save to save the role.
11.2.7.2.1 - Filtering Members in a Role
By using filtering, you can add specific members to a Role. The filtering mechanism uses search filters based on user-provided criteria for filtering the Member Sources.
11.2.7.2.1.1 - Filtering Members from AD and LDAP Member Sources
You can filter members from Active Directory, LDAP, and POSIX LDAP using the following search convention.
| Search Criteria | Description |
|---|---|
| * | Retrieves all users and groups |
| Character or word search | Retrieves the results that contain the specified character or word |
| (cn=*protegrity*) | Retrieves all common names that contain the term protegrity in it |
| (sn=abc*) | Retrieves all surnames that starts with abc |
| (objectClass=*) | Retrieves all the results |
| (&(objectClass=user)(!(cn=protegrity))) | Retrieves all the users without the common name as protegrity |
| (&(cn=protegrity)(objectClass=user)(email=*)) | Retrieves all the users with an email attribute and with common name as protegrity |
| (!(email=*)) | Retrieves all the users without an email attribute |
| (&(objectClass=user)(| (cn=protegrity*)(cn=admin*))) | Retrieves all the users with common name that starts with protegrity or admin |
If the input in the search filter includes special characters, then you must use the escape sequence in place of the special character to make it a valid input in the search filters.
The following table lists the escape sequence for each of the special characters.
| ASCII Character | Escape Sequence |
|---|---|
| ( | \28 |
| ) | \29 |
| * | \2A |
| \ | \5C |
The following table lists some examples of search filters with the usage of escape sequences to include special characters in the search input.
| Input with Special Character | Input with Escape Sequence | Description |
|---|---|---|
| (cn=protegrity*)) | (cn=protegrity\2A\29) | The search filter retrieves the values that contain protegrity*) In this case, the parenthesis requires an escape sequence because it is unmatched. |
| (cn= abc (xyz) abc) | The search filter retrieves the values that contain abc (xyz) abc In this case, the escape sequence is not required as the parenthesis are matched. |
11.2.7.2.1.2 - Filtering Members from Azure AD Member Source
You can filter members from Azure Active Directory using the following search convention.
| Search Criteria | Description |
|---|---|
| startsWith(displayname,‘xyz’) | Retrieves all groups and users that start with xyz Note: For more information and examples about the filter criteria for the Azure AD member source, search for the text Advanced query capabilities on Azure AD on Microsoft’s Technical Documentation site at: https://learn.microsoft.com/en-us/docs/ |
11.2.7.3 - Managing Members in a Role
Note: The ID column in the Members tab displays the unique identifier for the Azure AD, Posix LDAP and Active Directory member sources.
The following actions are available within the Members section of a Role.
| Task Name | Steps |
|---|---|
| Synchronize Members | 1. Select the role you want to update by clicking on it in the ESA Web UI, under Policy Management > Roles & Member Sources > Roles. The selected role screen appears. 2. In the Members tab, click the Synchronize Members icon in the Action column. A status message appears. |
| List Group Members | 1. Select the role you want to update by clicking on it in the ESA Web UI, under Policy Management > Roles & Member Sources > Roles. The selected role screen appears. 2. In the Members tab, click the List Group Members icon in the Action column. The dialog box appears with the list of all members in the group. |
| Remove Members | 1. Select the role you want to update by clicking on it in the ESA Web UI, under Policy Management > Roles & Member Sources > Roles. The selected role screen appears. 2. In the Members tab, click the Remove icon in the Action column. A confirmation dialog box appears. 3. Click Ok. |
11.2.7.4 - Searching Members
The Search Member tab from the Roles & Member Sources screen enables you to search for members within configured Roles. It provides additional information about the users, such as their added time, member source, and associated roles.
To search a member:
On the ESA Web UI, navigate to Policy Management > Roles & Member Source > Search Member.
Enter the search criteria in the Member Name textbox.
For more on valid search criteria, refer to Search Criteria.
- Click the Search icon.
The search results appear.
- Search Criteria
- Consider the following scenario:
- You have created a file member source named MemberSource1 which includes:
- Group File named examplegroups with users examplegroupuser1 and examplegroupuser2.
- User File named exampleusers with users exampleuser1 and exampleuser2.
- You have created a role named Role1.
- You have added all users from MemberSource1 to Role1.
For the given example, the following table lists the search results with different search criteria.
Table: Search Criteria
Search Criteria Description Output Wild card Search with *.It displays all the members. Character search Search with 1.It displays examplegroupuser1 and exampleuser1. Word search Search with group.It displays examplegroupuser1 and examplegroupuser2. You can perform additional actions on the search results such as:
- Clicking on the Role or Source column values redirects you to the Roles or Member Sources page respectively.
- Members can be sorted based on Name, Added Time, Role or Source columns.
- Search results also can be filtered with another search option, which is provided in the search results.
- You have created a file member source named MemberSource1 which includes:
11.2.7.5 - Searching Member Access
The Search Member Access tab on the Roles & Member Sources screen enables you to check effective permissions for a user. This can be done if a user is assigned a role and that role is linked to policies. It provides additional information about effective permissions for a user on data elements mapped in policies. It will also show permissions for each policy and the final permission when multiple policies are connected to the datastore.
Note: Ensure that the policies are deployed to view the permissions.
It provides options to view effective permissions.
Simple view: It shows the final permission granted to a user on data elements mapped in policies. This consolidated view is ideal for quickly understanding the user’s overall access.
Advanced view: It shows a detailed breakdown of permissions. It displays both the final effective permission and the individual permissions granted by each policy.
For example; a policy user can be associated with multiple roles, each configured with distinct Data Element permissions. The table below illustrates that role R1 is directly linked to Data Element DE1 across Policies P1, P2, and P3. These policies are deployed to the same data store. As a result, role R1 inherits a combined set of permissions, forming an effective policy that merges all applicable role permissions for DE1.
Table: Policy Structure in the ESA
Policy Role User Data Element Permission P1 R1 U1 DE1 Protect (P) P2 R1 U1 DE1 Unprotect (U) P3 R1 U1 DE1 Reprotect (R) The following table lists the effective permissions after deploying the policies to same datastore.
User Data Element Effective Permissions U1 DE1 P, U, R In the context of the policy structure and effective permissions, the Simple view presents the final, effective permissions a user has on a data element, regardless of how those permissions were granted. This tells us that User U1 has the ability to Protect, Unprotect, and Reprotect data in DE1, without showing how those permissions were assigned.
The Advanced View breaks down the underlying policy structure, showing how permissions are granted through roles and policies. It’s useful for auditing, debugging, or understanding permission inheritance. This shows that:
- Role R1 is assigned to User U1.
- R1 is granted different permissions on DE1 across three policies (P1, P2, P3).
- When these policies are deployed to the same data store, the permissions are merged, resulting in the effective permissions shown in the Simple view.
To search member access:
On the ESA Web UI, navigate to Policy Management > Roles & Member Source > Search Member Access.
Enter the search criteria in the Member Name textbox.
Click the Search icon.
The search results appear with the search member name, associated data store, member status, and view member permissions information.
Note: If multiple users have the same search member name, only the first 10 results will be displayed. For example, the search member name “test” will return results for the provided name, with variations like “test”, “testuser”, and so on. The search will display the first 10 matching results.
To avoid this, use an exact username instead of a common name for the search member name.In the View Member Permissions column, click the View Member Permissions icon. The Permissions dialog box appears.
Note: The Permissions dialog box displays information in the Simple View mode. It shows the member access set on Data Elements for the associated Data Store. It is displayed after policies and role permissions has been merged. You will also see how data is returned in the Output column.
Click the Advanced View button. The Permissions dialog box appears in the Advanced View mode.
Note: This mode includes a Role column that displays permissions derived from merged policies connected to the Data Store. It also includes a Policy [Role] column, showing the permission set for a role on a specific policy.
11.3 - Policy Management
Policies group together Data Elements, Masks, and Roles to create security configurations that reflect your organization’s data security strategy. Policies are deployed to the locations specified under Data Stores. This is applicable to the policies that are dynamically deployed and not to the immutable policies that are deployed using the DevOps approach. The mapping between Roles and Data Elements is unique to each Policy and needs to be configured.
Note: The Deploy Status is only applicable for 9.x.x.x Protectors and earlier. For 10.0.x protectors and later, you can access the information about the deploy statuses from the Protegrity Dashboard.
Protegrity supports two types of Policies:
- Structured: using structured Data Elements for fine-grained protection.
- Unstructured: using unstructured data elements for course-grained file protection. Used exclusively with Protegrity File Protector.
Policy Changes
Policies must be deployed to take effect in the system.
Any updates made to any of the policy components result in a policy change. These updates may be related to administrative changes in the policy definition, such as an addition of a data element. These updates may also be an effect of a change coming from the organization’s Directory Service that is automatically pulled into the ESA.
User-originated changes made through the ESA UI require a manual policy deployment from the Web UI. User-originated changes made via the ESA Policy Management API are automatically deployed. Finally, any changes coming from the LDAP Member Sources that are configured in automatic refresh mode in the Role definition are also immediately deployed.
For more information about the available Policy Deployment mechanisms, refer to the Deploying Policies section.
11.3.1 - Creating Policies
Creating a Structured Policy
This section describes the steps to create a structured policy.
To create a structured policy:
On the ESA Web UI, navigate to Policy Management > Policies & Trusted Applications > Policies.
The list of all the policies appears.
Click Add New Policy.
The New Policy screen appears.
Select Structured from Type.
Type a unique name for the policy in the Name textbox. The maximum length of the policy name is 55 characters.
Type the description for the policy in the Description textbox.
Under the Permissions tab, select the required permissions.
For more information about adding permissions, refer to the section Configuring Policy Permissions.
Under the Data Elements tab, add the required data elements.
For more information about adding data elements, refer to the section Data Elements.
Under the Roles tab, add the required roles.
For more information about adding roles, refer to the section Roles.
Under the Data Stores tab, add the required Data Stores.
For more information about adding data stores, refer to the section Data Stores.
Click Save.
A message Policy has been created successfully appears.
Creating an Unstructured Policy
This section describes the steps to create an unstructured policy.
To create an unstructured policy:
On the ESA Web UI, navigate to Policy Management > Policies & Trusted Applications > Policies.
The list of all the policies appear.
Click Add New Policy.
The New Policy screen appears.
Select Unstructured from Type.
Type a unique name for the policy in the Name textbox.
The maximum length of the policy name is 55 characters.
Type the description for the policy in the Description textbox.
Under the Permissions tab, select the required permissions.
For more information about adding permissions, refer to the section Configuring Policy Permissions.
Under the Data Elements tab, add the required data elements.
For more information about adding data elements, refer to the section Data Elements.
Under the Roles tab, add the required roles.
For more information about adding roles, refer to the section Roles.
Under the Data Stores tab, add the required Data Stores.
For more information about adding data stores, refer to the section Data Stores.
Click Save.
A message Policy has been created successfully appears.
11.3.2 - Adding Data Elements to Policy
Adding Data Elements for Structured Policies
This section describes the steps to add data elements for structured policies.
To add data elements for structured policies:
On the ESA Web UI, navigate to Policy Management > Policies & Trusted Applications > Policies.
The list of all the policies appear.
Select the policy.
The screen to edit the policy appears.
Click the Data Elements tab.
Click Add.
The list of all the available data elements appears.
Select the data elements.
Click Add.
A message Selected Data Elements have been added to the policy successfully appears.
Adding Data Elements for Unstructured Policies
This section describes the steps to add data elements for unstructured policies.
To add data elements for unstructured policies:
On the ESA Web UI, navigate to Policy Management > Policies & Trusted Applications > Policies.
The list of all the policies appear.
Select the policy.
The screen to edit the policy appears.
Click the Data Elements tab.
Click Add.
The list of data elements created for unstructured data appears.
Select the data elements.
Click Add.
A message Selected Data Elements have been added to the policy successfully appears.
11.3.3 - Adding Roles to Policy
Adding Roles to Policies
You add roles to a policy to enforce user access to data. The roles can be set up to enable granular access control on sensitive enterprise data. You can add one or more roles to a policy.
To add roles to policies:
On the ESA Web UI, navigate to Policy Management > Policies & Trusted Applications > Policies.
The list of all the policies appear.
Select the policy.
The screen to edit the policy appears.
Click the Roles tab.
Click Add.
The list of roles created appears.
Select the roles.
Click Add.
A message Selected Roles have been added to the policy successfully appears.
11.3.4 - Configuring Policy Permissions
Policy Permissions define how your end users will interact with sensitive data. Permissions specify if the members of a Role have the ability to protect or unprotect a given Data Element. Permissions govern the format of data to return for authorized and unauthorized unprotect operations.
Permissions can be set using the ESA Web UI or the Policy Management API.
Available Permissions vary depending on whether the Policy is Structured or Unstructured.
For Structured Policies, the following Permissions are configurable for each Data Element:
- Unprotect: Allows Role members to unprotect data.
- Protect: Allows Role members to protect data.
- Reprotect: Allows Role members to reprotect data.
Note: From 10.0.x, if you have selected the HMAC-SHA256 data elements, then only the Protect option is enabled. The other options, such as, Reprotect and Unprotect are grayed out.
For Unstructured Policies, the following Permissions are configurable for each Data Element:
- Unprotect Content: Allows Role members to unprotect data.
- Protect Content: Allows Role members to protect data.
- Reprotect Content: Allows Role members to reprotect data.
- Create Object: Allows Role members to create a file or directory.
- Admin Permissions: Allows Role members to add or remove protection.
Access and No-Access Operations
You can control the data output during unprotect operations:
- For authorized unprotect operations, you can decide to return the data in the clear or with an applied Mask.
- For unauthorized unprotect operations, you can decide to return the data in its protected form if it is available, as null, or generate an error.
The following table specifies the behavior during Unprotect operations.
| No-Access Operation | Operation Description |
|---|---|
| Null | A null value is returned when the user tries to access the data. |
| Protected Value | The tokenized or encrypted value is returned when the user tries to access the data. |
| Exception | An exception is returned when the user tries to access the data. |
Note: Masks can only be applied during unprotect operations.
For more information about how no-access operations work for users in multiple roles, refer to the section No-Access Operations for Users in Multiple Roles.
You can also set permissions or rules using the Policy Management API.
Setting Default Permissions for a Policy
By default, every new Policy is created with most restrictive permissions, disallowing all operations for Policy members. Changes to Permissions will have to be made on a granular level, by modifying Data Element Permissions or Role Permissions.
To set default permissions for a policy:
On the ESA Web UI, navigate to Policy Management > Policies & Trusted Applications > Policies.
The list of all the policies appear.
Select the required policy.
The screen to edit the policy appears.
Click the Permissions tab.
- Select the required permissions.
- Click Save.
The permissions are set for the policy. The default Permissions are inherited by every new Role added to the Policy. Roles added before the Permission change are not modified.
Modifying Data Element Permissions
You can modify Permissions of Roles for each individual Data Element. The new Permissions override the default Permission configuration.
To customize permissions for each data element:
On the ESA Web UI, navigate to Policy Management > Policies & Trusted Applications > Policies.
The list of all the policies appear.
Select the required policy.
The screen to edit the policy appears.
Click the Data Elements tab.
Click Edit Permissions.
The Permissions screen appears.
Select the required permissions.
You can choose the Permissions of each Policy Role on the Data Element you are modifying.
Note: If you are using masks with any data element, then ensure that masks are created before editing permissions.
Click Save.
A message Permissions have been updated successfully appears.
Note: The customized permissions, if any, override the default permissions for any policy.
Modifying Role Permissions
You can modify Permissions over Data Elements for each individual Role. The new Permissions will override the default Permission configuration.
To customize permissions for each role:
On the ESA Web UI, navigate to Policy Management> Policies & Trusted Applications> Policies.
The list of all the policies appear.
Select the policy.
The screen to edit the policy appears.
Click the Roles tab.
Click Edit Permissions.
The Permissions screen appears.
Select the permissions.
You can choose the Permissions of each Policy Data Element for the Role you are modifying.
Click Save.
A message Permissions have been updated successfully appears.
11.3.4.1 - Permission Conflicts
Policy users can be assigned to multiple roles with different Data Element permission settings. This section guides you through conflict resolution applied by the software. As a general rule, the least restrictive permissions are applied. If the conflict is unsolvable, access may be revoked. If multiple policies exist in one data store, then the effective merged policies and merged role permissions are applied when the Data Store is deployed.
Masking Conflicts
In case of Masking conflicts, the general rule of applying least restrictive permission is typically applied, with some exceptions.
Study the following table to understand all possible conflict permutations and their outputs. In this table, User U1 with a policy P is associated with roles R1, R2, and R3. The user is also connected with the data element DE1 containing Left and Right masks, and output formats.
| Role | User | Data Element | Output Format | Mask Settings | Resultant Output |
| R1 | U1 | DE1 | MASK | Left: 1, Right: 2 | Left: 1, Right: 2 |
| R1 | U1 | DE1 | MASK | Left: 1, Right: 2 | Left: 1, Right: 2 |
| R2 | U1 | DE1 | MASK | Left: 1, Right: 2 | |
| R1 | U1 | DE1 | MASK | Left: 1, Right: 2 | There is conflict in the mask settings (Left, Right) and thus, the Unprotect access is revoked with NULL as the output. |
| R2 | U1 | DE1 | MASK | Left: 0, Right: 5 | |
| R1 | U1 | DE1 | MASK | Left: 1, Right: 2 with mask character ‘*’ | There is conflict in the mask character settings and thus, the Unprotect access is revoked with NULL as the output. |
| R2 | U1 | DE1 | MASK | Left: 1, Right: 2 with mask character ‘/’ | |
| R1 | U1 | DE1 | MASK | Left: 1, Right: 2 | There is conflict in the mask settings (Left, Right) and thus, the Unprotect access is revoked with NULL as the output. |
| R2 | U1 | DE1 | MASK | Left: 1, Right: 2 | |
| R3 | U1 | DE1 | MASK | Left: 0, Right: 5 | |
| R1 | U1 | DE1 | MASK | Left: 1, Right: 1 with masked mode | There is conflict in the mask
settings and thus, the Unprotect access is revoked with NULL as
the output. For example: If the value 12345 is masked with
Left: 1, Right: 1 settings in masked mode,
then it results in *234*.If the value 12345 is masked with
Left: 1, Right: 1 settings in clear mode,
then it results in 1***5.As the resultant values are
conflicting, the Unprotect access is revoked with NULL as the
output. |
| R2 | U1 | DE1 | MASK | Left: 1, Right: 1 with clear mode | |
| R1 | U1 | DE1 | MASK | Left: 1, Right: 2 | There is conflict in the output formats. The resultant output is most permissive, which is CLEAR. |
| R2 | U1 | DE1 | CLEAR | ||
| R1 | U1 | DE1 | MASK | Left: 1, Right: 2 | There is conflict in the output formats due to conflicting MASK settings. However, with the CLEAR setting applicable in the order of access as per the role R3, the resultant output is most permissive. In this case, it is CLEAR. |
| R2 | U1 | DE2 | MASK | Left: 0, Right: 5 | |
| R3 | U1 | DE3 | CLEAR |
Unprotect Permission Conflicts
Unprotect Permissions may be set to authorized or unauthorized. In the case of authorized access, the data can be returned as masked or in the clear. In the case of unauthorized access, the output may be set to null, exception, or protected string, if available for the specific Data Element.
In case of Authorized and Unauthorized Unprotect Permissions conflicts, the general rule of applying least restrictive permission is always applied. Study the following table to understand all possible conflict permutations and their outputs.
| Sr. No. | Role | User | Data Element | No-Access Operation | Output Format | Mask Settings | Resultant Output |
| 1 | R1 | U1 | DE1 | MASK | Left: 1, Right: 2 | There is conflict in the output formats. If one of the roles has access, then the output format is used. The resultant output is most permissive, which is MASK. | |
| R2 | U1 | DE1 | NULL | ||||
| 2 | R1 | U1 | DE1 | MASK | Left: 1, Right: 2 | ||
| R2 | U1 | DE1 | Protected | ||||
| 3 | R1 | U1 | DE1 | MASK | Left: 1, Right: 2 | ||
| R2 | U1 | DE1 | Exception | ||||
| 4 | R1 | U1 | DE1 | CLEAR | If one of the roles has access, then the output format is used. The resultant output is most permissive, which is CLEAR. | ||
| R2 | U1 | DE1 | NULL | ||||
| 5 | R1 | U1 | DE1 | CLEAR | |||
| R2 | U1 | DE1 | Protected | ||||
| 6 | R1 | U1 | DE1 | CLEAR | |||
| R2 | U1 | DE1 | Exception |
No-Access Operations for Users in Multiple Roles
In case of Unauthorized Unprotect Permissions conflicts, the general rule of applying least restrictive permission is always applied. Study the following below to understand all possible conflict permutations and their outputs.
| No-Access Operation 1 | No-Access Operation 2 | Resultant Permission on the Protector |
|---|---|---|
| Protected | NULL | Protected |
| Protected | EXCEPTION | Protected |
| Protected | Mask | Mask |
| Protected | Clear | Clear |
| NULL | EXCEPTION | EXCEPTION |
| NULL | Mask | Mask |
| NULL | Clear | Clear |
| EXCEPTION | Mask | Mask |
| EXCEPTION | Clear | Clear |
11.3.4.1.1 - Inheriting Permissions
A special case exists when a user is present in multiple roles, this creates a conflict. This section provides information about how the software resolves this conflict. As a general rule, the software applies the most restrictive permissions.
Typically, when a policy user is assigned a role that does not have a specific data element associated with the role, then the user cannot use the data element for performing security operations. If the user tries to use the data element, then an error is generated.
However, consider a policy where you have created a default role that is applicable to all users. You associate a specific data element with this default role. In this case, the policy user, who is included in another role that is not associated with the specific data element, inherits the permissions for this data element from the default role. This scenario is applicable only if the users are a part of the same policy or a part of multiple policies that are applied to the same data store.
When a user is part of multiple roles or policies, the system must resolve potential permission conflicts. The Search Member Access tab in the Roles & Member Sources section allows you to view the effective permissions a user has on data elements. This includes permissions inherited from multiple roles and policies.
For more information about effective permissions, refer to Searching Member Access.
Scenario:
Policy 1 contains the role R1, which is assigned to the user U1. The role R1 is associated with a data element DE1, which has the permissions Unprotect, Protect, and Reprotect. The user U1 can unprotect, protect, and reprotect the data using the data element DE1.
Policy 2 contains the role R2, which is assigned to the user U2. The role R2 is associated with a data element DE2. which has the permissions Unprotect, Protect, and Reprotect. The user U2 can unprotect, protect, and reprotect the data using the data element DE2.
Policy P3 contains the role R3, which is applicable to all the users. The role R3 role is associated with two data elements DE1 and DE2. Both the data elements have the Unprotect permissions associated with it.
Note: The ALL USERS denotes a default role which is applicable to all the users. To enable the default role, click the Applicable to all the members toggle button on the ESA web UI. For more information about Applicable to all the members, refer to the section Roles.
Use Case 1
The Use Case 1 table demonstrates that roles R1 and R2 have an indirect relationship with data elements DE1 and DE2. The roles are part of different policies that are deployed to the same data store. As a result, the roles R1 and R2 have inherited the permission of the default role for data elements DE1 and DE2.
Table 1. Use Case 1
| Policy structure in the ESA | Protector side permissions after deploying the policy | ||||||
| P1 | R1 | U1 | DE1 | URP | U1 | DE1 | URP |
| DE2 | U | ||||||
| P2 | R2 | U2 | DE2 | URP | U2 | DE1 | U |
| DE2 | URP | ||||||
| P3 | R3 | ALL USERS | DE1 | U | ALL USERS | DE1 | U |
| DE2 | U | DE2 | U | ||||
The Unprotect permission is highlighted in bold in the Protector side permissions after deploying the policy column. This Unprotect permission indicates that it has been inherited from the role R3, which is applicable to the data elements DE1 and DE2 for all the users.
Use Case 2
The Use Case 2 table demonstrates that if roles R1 and R2 have a direct relationship with data elements DE1 and DE2, then they will not inherit the permissions of the default role.
Table 2. Use Case 2
| Policy structure in the ESA | Protector side permissions after deploying the policy | ||||||
| P1 | R1 | U1 | DE1 | URP | U1 | DE1 | URP |
| DE2 | - | DE2 | - | ||||
| R3 | ALL USERS | DE1 | U | U2 | DE1 | - | |
| DE2 | U | DE2 | URP | ||||
| P2 | R2 | U2 | DE1 | - | ALL USERS | DE1 | UR |
| DE2 | URP | ||||||
| P3 | R4 | ALL USERS | DE1 | R | DE2 | UR | |
| DE2 | R | ||||||
Use Case 3
The Use Case 3 table demonstrates that if roles R1 and R2 have a direct relationship with data elements DE1 and DE2, then they will not inherit the permissions of the default role.
Table 3. Use Case 3
| Policy structure in the ESA | Protector side permissions after deploying the policy | ||||||
| P1 | R1 | U1 | DE1 | URP | U1 | DE1 | URP |
| DE2 | - | DE2 | - | ||||
| R2 | U2 | DE1 | - | U2 | DE1 | - | |
| DE2 | URP | DE2 | URP | ||||
| R3 | ALL USERS | DE1 | U | ALL USERS | DE1 | UR | |
| DE2 | U | ||||||
| R4 | ALL USERS | DE1 | R | DE2 | UR | ||
| DE2 | R | ||||||
Use Case 4
The Use Case 4 table demonstrates that as role R2 has an indirect relationship with data element DE1, it has inherited the permissions of the default role. The role R1 has a direct relationship with data element DE1, and it have not inherited the permissions of the default role.
Table 4. Use Case 4
| Policy structure in the ESA | Protector side permissions after deploying the policy | ||||||
| P1 | R1 | U1 | DE1 | - | U1 | DE1 | - |
| DE2 | - | ||||||
| R3 | ALL USERS | DE1 | U | U2 | DE1 | U | |
| DE2 | URP | ||||||
| P2 | R2 | U2 | DE2 | URP | ALL USERS | DE1 | U |
| DE2 | - | ||||||
The Unprotect permission is highlighted in bold in the Protector side permissions after deploying the policy column. This Unprotect permission indicates that it has been inherited from the role R3, which is applicable to the data element DE1 for all the users.
Use Case 5
The Use Case 5 table demonstrates that Role R1 has inherited the permissions of the default role for the data element DE2.
Table 5. Use Case 5
| Policy structure in the ESA | Protector side permissions after deploying the policy | ||||||
| P1 | R1 | U1 | DE1 | URP | U1 | DE1 | URP |
| DE2 | UP | ||||||
| P2 | R3 | ALL USERS | DE2 | U | ALL USERS | DE1 | - |
| P3 | R4 | ALL USERS | DE2 | P | DE2 | UP | |
The resultant permissions are highlighted in bold in the Protector side permissions after deploying the policy column. These permissions indicate that they have been inherited from the roles R3 and R4, which are applicable to the data element DE2 for all the users.
Use Case 6
The Use Case 6 table demonstrates that role R1 will inherit the permissions of the default role for the data element DE2.
Table 6. Use Case 6
| Policy structure in the ESA | Protector side permissions after deploying the policy | ||||||
| P1 | R1 | U1 | DE1 | U | U1 | DE1 | UP |
| DE2 | URP | ||||||
| P2 | R5 | U1 | DE1 | P | ALL USERS | DE1 | - |
| P3 | R3 | ALL USERS | DE2 | URP | DE2 | URP | |
The resultant permissions are highlighted in bold in the Protector side permissions after deploying the policy column. These permissions indicate the permissions that have been inherited from the role R3, which is applicable to the data element DE2 for all the users.
Use Case 7
In Use Case 7 table, role R1 is related to data element DE1 in policy P1 and and role R3 is related to data element DE1 in policy P3. In this case, roles R1 and R3 will not inherit the permissions of the default role.
Table 7. Use Case 7
| Policy structure in the ESA | Protector side permissions after deploying the policy | ||||||
| P1 | R1 | U1 | DE1 | U | U1 | DE1 | U |
| DE2 | - | ||||||
| P2 | R1 | U1 | DE2 | - | ALL USERS | DE1 | URP |
| P3 | R3 | ALL USERS | DE1 | URP | DE2 | - | |
11.3.5 - Deploying Policies
Policies must be deployed to take effect in the system.
There are two stages of deployment: Ready to Deploy and Deployed. The Ready to Deploy stage signals that the Policy configuration is finalized and the Policy can be deployed. The Deployed stage means that this version of the Policy is actively being made available to the Protectors. If you modify a Policy, then you need to repeat the deployment process.
Note that this behavior only applies to modifying Policies via ESA Web UI. If you are modifying a Policy using the Policy Management API, the deployment happens automatically after every change. For more information about the Policy Management API, please refer to the section Using the Policy Management REST APIs.
Marking the Policy as Ready to Deploy
To mark the Policy as Ready to Deployment:
On the ESA Web UI, navigate to Policy Management > Policies & Trusted Applications > Policies.
The list of all the policies appear.
Select the required policy.
The screen to edit the policy appears.
Click Ready to Deploy.
A message confirming the action appears. The Ready to Deploy is inactive and the Deploy is active. The ESA must be up and running to deploy the package to the protectors.
Deploying a Policy
This section describes how to deploy the policy after it has been marked as Ready to Deploy.
To deploy the policy:
On the ESA Web UI, navigate to Policy Management > Policies & Trusted Applications > Policies.
The list of all the policies appear.
Select the required policy.
The screen to edit the policy appears.
Click Deploy.
A message Policy has been deployed successfully appears.
Note: An error message appears if the deployment of the Policy is not linked to any Data Store.
If you deploy a policy to a data store, which contains additional policies that have already been deployed, then the policy user inherits the permissions from the multiple policies.
For more information about inherting permissions, refer to Inheriting Permissions.
Deploying Data Stores
You can choose to deploy a Policy to a specific Data Store only. That will allow the nodes associated with the Data Store to get the latest Policy. By deploying a Data Store, you deploy the Trusted Applications associated with it.
To deploy a Data Store:
On the ESA Web UI, navigate to Policy Management > Data Stores.
The list of all the data stores appear.
Select the data store.
The screen to edit the data store appears.
Click Deploy.
A message **Data Store has been deployed successfully** appears.
When the Protector pulls the package that contains a policy added to the data store, it connects to ESA to retrieve the necessary policy information. The policy information includes members for each role in the policy, token elements, and so on.
Deploying Trusted Applications
During deployment, the Application Protector validates the Trusted Application. If the validation fails, then the Protector generates an audit entry with the detailed information.
Marking a Trusted Application as Ready to Deploy
To mark a Trusted Application as Ready to Deploy:
On the ESA Web UI, navigate to Policy Management > Policies & Trusted Applications > Trusted Applications.
The list of all the trusted applications appear.
Select the required trusted application.
The screen to edit the trusted application appears.
Click Ready to Deploy.
A message Trusted Application has been marked ready to deploy appears.
The Deploy action is active.
Deploy the Trusted Application
To deploy the trusted application after it has been marked as Ready to Deploy:
On the ESA Web UI, navigate to Policy Management > Policies & Trusted Applications > Trusted Applications.
The list of all the trusted applications appear.
Select the required application that is in the ready to deploy state.
The screen to edit the trusted application appears.
Click Deploy. A message Trusted application has been successfully deployed appears.
Note: An error message appears if the deployment of the Trusted Application is not linked to any Data Store.
You can also deploy the trusted application by deploying the data store. In this case, all the policies and trusted applications that are linked to the data store are prepared to be distributed to the protection points.
For more information about deploying a data store, refer to Deploying Data Stores to Protectors.
11.4 - Policy Management Dashboard
The Policy Management dashboard consists of the following three areas:
- Summary
- Keys
- Statuses
Note: The Statuses area is a legacy feature that is not applicable for 10.0.x protectors and later. For 10.0.x protectors and later, you can access the information about the protector statuses from the Protegrity Dashboard.
Summary
The Summary area displays an overview of the number of policy components created using the Policy Management Web UI. The following policy components appear under the Summary area:
- Roles
- Data Elements
- Member Sources
You can navigate to the respective policy components by clicking the corresponding number.
Keys
The Keys tab displays an overview on the number of keys managed and created using the Key Management Web UI. The following key components appear under the Keys area:
- Keys Managed: Total number of keys present in the Policy Management system. This includes the Master Keys, Repository Keys, Signing Keys, Data Store Keys, and Data Element Keys. This number also includes all the rotated keys.
- Data Element Keys Managed: Total number of Data Element Keys currently present in the Policy Management system. Each key is connected to an existing Data Element. This number also includes the rotated Data Element Keys. It is important to note that a maximum number of 8191 keys can be present in the system.
- Data Element Keys Created: Total number of Data Element keys that have been ever created in the Policy Management system. This number also includes the keys that you have created earlier but have subsequently removed after deleting a data element. It is important to note that you can create a maximum number of 8191 keys.
11.5 - Package Deployment
Starting with version 10.0.x artifacts such as the Data Security Policy or the DSG CoP rulesets, are distributed to Protectors through Packages. Packages in the ESA are resilient. Protectors store the resilient Packages using dynamic memory allocation, allowing for high scalability and performance.
A Data Security Policy is deployed in the ESA either using the ESA Web UI or the Policy Management API. A deployed policy indicates that it is ready to be distributed to the Protectors. If multiple policies exist in one data store, then the policies are merged on deployment. A deployed policy can be distributed to the Protectors using one of the following methods:
- Dynamic distribution - Protectors send requests to the ESA to receive the latest Policies and other artifacts, and related metadata.
- DevOps-based distribution - The Resilient Package API is used to export an encrypted resilient package to a secure location. The encrypted resilient package can then be used by Immutable Resilient Protectors.
For more information about deploying Policies in the ESA, refer to Deploying Policies.
For more information about the DSG CoP Ruleset, refer to Ruleset reference.
The following image illustrates the dynamic distribution of resilient packages. It shows how the Data Security Policy that is defined in the ESA reaches the protectors as part of a package. A Data Security Policy is created and deployed in the ESA either using the ESA Web UI or the Policy Management API. When the protector sends a request to the ESA, the ESA creates a package containing the policy. The protector then pulls the package and the related metadata. If a change is made to any of the policies that are part of the package, the protector pulls the updated package from the ESA. There can be multiple scenarios when any change in policy is made.
Important: The deployment scenario explained in this section applies to 10.0.x protectors and later.

Resilient Package Deployment
A number of components participate in the Package distribution process from the ESA to Protectors. The ESA and Protector-based components communicate with each other using Time To Live (TTL) as the main metric to verify that their stored Packages are up to date.
The following table provides descriptions of each component:
| Abbreviation | Name | Description | TTL | Host |
|---|---|---|---|---|
| RPP | Resilient Package Proxy | A forward proxy that caches the Resilient Packages. | 60s | ESA |
| RPA | Resilient Package Agent | A component that connects to the ESA or the RPP to determine if a new Package exists for the data store. If a new Package exists, it is pulled by the RPA. | 60s | Protector |
| RPS API | Resilient Package REST API | An API used to pull packages from the ESA that can be used within DevOps pipelines. | N/A | ESA |
Resilient Package Deployment Architecture
The following diagram shows three sample use cases for downloading the resilient package from the ESA or an upstream server to the protectors.

Package Deployment Approaches for Standard Protectors
The various package deployment approaches are explained with a model architecture diagram for Standard Protectors. For more information about package deployment approaches for Standard protectors, refer to Standard Protectors.
Use Case 1: Static Approach
In the first use case, the users create a DevOps process that uses the RPS API to export the resilient package from the ESA to the Immutable protector.
For more information and example of using the DevOps process in Application Protectors, refer to DevOps Approach for Application Protector.
Use Case 2: Dynamic Approach using RPP
In the second use case, a Resilient Package Proxy (RPP) is used to download the resilient package from the ESA. An RPP is an HTTP Cache that retrieves the resilient package from the ESA and stores it in its cache. The short lived protector or node then connects to the RPP instead of the ESA to download the resilient package. If the policy is updated in the ESA, then the RPP connects to the ESA to download the updated package.
For more information and example of using the RPP in Protegrity REST Container, refer to Architecture and Components using Dynamic-based Deployment.
Use Case 3: Dynamic Approach using RPA
In the third use case, the Resilient Package Agent (RPA) is installed on the Protector node or pod. The RPA connects to the ESA and downloads the resilient package.
For more information and example of using the RP Agent in CDP-PVC-Base, refer to Understanding the architecture.
For more information and example of using the RP Agent in Application Protector, refer to Understanding the architecture.
Important: The preferred use case depends on the type of protector that you are using. Refer to the corresponding Protector documentation for more details.
12.2.2 - Deployment with Audit Logging Flow to External SIEM
The architecture also supports forwarding logs from protectors to the External SIEM.
The logging flow from protectors to the ESA and the External SIEM is shown in the following image.
Legends
| Component | Active Flow | Failover Flow |
|---|---|---|
| Policy download for v9.1.0.0 Protector | ______ | - - - - - - |
| Package download for v10.0.0 Standard Protector and v4.0.0 DSG | ______ | - - - - - - |
| Forwarding of Audit Events to External SIEM via ESA | ______ | - - - - - - |
12.2.3 - Network Architecture Overview
This section lists the various sites and their components, supported protector versions, communication flows, and key measurements for the recommended model architecture across various dimensions.
Table 1. Sites and Components
| Sites | Components | Description |
| Primary Site | ESA | ESA P1, ESA S1, ESA S2 |
| LTM | LTM-1: Manages resiliency within the Primary Site | |
| DR Site | ESA | ESA S3, ESA S4, ESA S5 |
| LTM | LTM-2: Manages resiliency within the DR Site | |
| GTM | GTM | GTM: Manages resiliency between the Primary and DR Sites |
Table 2. ESA Compatibility
| ESA | Supported Protectors |
| 10.2.0 |
|
Table 3. Communication Flows
The following table describes communication flows as depicted in diagrams in Deployment with Default Audit logging flow to ESA and Deployment with Audit logging flow to External SIEM.
| Flow | Request Initiator | Destination | Port | Protocol | Flow Sequence | LTM Configuration |
Policy Download for v9.1.0.0
Protector and v3.3.0.1 DSG | Pepserver in the Protector node | Service Dispatcher in ESA | 8443 | TLS |
| Primary Active Flow: Active connection to ESA P1 and
standby connection to other ESAs Protector 9.1/DSG 3.3.0.1 -> GTM
-> LTM-1 -> ESA P1 DR Flow: Active connection to ESA S3
and standby connections to other ESAs Protector 9.1/DSG 3.3.0.1 ->
GTM -> LTM-2 -> ESA S3 |
Package Download for v10.0.0 Standard
Protector and v4.0.0 DSG | RPAgent in the Protector node or RPP in the DSG node | RPP in ESA | 25400 | TLS |
| Primary Active Flow: Active connection to ESA P1 and
standby connection to other ESAs Protector 10.0.0/DSG 4.0.0 -> GTM
-> LTM-1 -> ESA P1 DR Flow: Active connection to ESA S3
and standby connection other ESAs Protector 10.0.0/DSG 4.0.0 -> GTM
-> LTM-2 -> ESA S3 |
Forwarding of Audit Events to
ESA | Log Forwarder in the Protector node | Insight in ESA | 9200 | TLS |
| Primary Active Flow: Routed to all ESAs in the Primary
Site Protector 9.1.0.0/10.0.0 or DSG 3.3.0.1/4.0.0 -> GTM -> LTM-1 -> ESA P1,
S1, S2 DR Flow: Routed to all ESAs in the DR
Site Protector 9.1.0.0/10.0.0 or DSG 3.3.0.1/4.0.0 -> GTM -> LTM-2 -> ESA S3,
S4, S5 |
Forwarding of Audit Events to External SIEM via
ESA | Log Forwarder in the Protector node | TD-Agent in ESA | 24224/ 24284 | Non-TLS/TLS |
| Primary Active Flow: Routed to all ESAs in the Primary
Site Protector 9.1.0.0/10.0.0 or DSG 3.3.0.1/4.0.0 -> GTM -> LTM-1-> ESA P1,
S1, S2-> External SIEM DR Flow: Routed to all ESAs in
the DR Site Protector 9.1.0.0/10.0.0 or DSG 3.3.0.1/4.0.0 -> GTM -> LTM-2-> ESA
S3, S4, S5 -> External SIEM |
Table 4. Key measurements for the recommended model architecture across various dimensions
The following table summarizes the key measurements for the recommended model architecture across various dimensions.
| Measurement | Policy | Insight | Criteria summary |
| Extensibility | √ | √ | The current architecture allows easy addition of new features, capabilities, or functionalities without requiring significant changes to the existing architecture. |
| Vertical Scalability | √ | √ | The current architecture allows enabling a node to expand its capacity by adding additional resources such as processing power, memory, or storage. |
| Horizontal Scalability | X | √ | The current architecture has the ability to distribute the load among multiple machines to improve the system's reliability and performance through a static consistent routing. However, for Policy, it is always recommended to perform authoring and modification only from Primary ESA. Hence, policy does not support horizontal scalability. |
| High Availability (HA) | X | √ | For Policy, HA is not supported as there is no real time replication of changes in policy to other ESAs from the Primary ESA. There is a dependency on a TAC replication job for replication. For Insight, audit logs are replicated to all the ESAs in a round robin fashion and there are replicas available in each of the ESAs handled by OpenSearch. |
| Disaster Recovery (DR) | √ | √ | The architecture meets the necessary criteria for DR, but it is important to understand that an appropriate DR plan is ready and tested by the user. The solution relies on the external SIEM for a complete log retention to be in place. |
| Federation | √ | √ | The current architecture has the ability to manage policy, monitor nodes, analyze events, and access logs. It can monitor performance and troubleshoot potential issues at the enterprise level, providing a single sheet of glass view. This criterion is met due to the use of an external SIEM. |
These measurements underscore the importance and effectiveness of adhering to a well-defined model architecture. Adherence ensures resiliency, fault tolerance, scalability, maintainability, and being adaptable to changes.
12.2.4 - Enterprise Security Administrator (ESA)
ESA handles the management of policies, keys, monitoring, auditing, and reporting of protected systems in the enterprise. ESA appliances have the Insight, and the td-agent service installed and are capable of hosting Docker containers.
The detailed Architecture diagram for ESA v10.2.0 is shown below.
12.2.4.1 - Infrastructure Requirements
12.2.4.2 - Installing and Configuring ESA
The ESA can be installed on-premise or a cloud platform such as AWS, GCP, or Azure. When upgrading from a previous version, the ESA installer is available as a patch.
Assumptions
This section assumes that there is no prior installation of protegrity product and installation is happening from scratch.
GTM and LTM are provisioned and installed.
For more information about the prescribed configurations, refer to Recommended Traffic Manager.
This section explains about Installation and Configuration of ESAs as per Architecture Diagram in Deployment with Default Audit logging flow to ESA.
For more information about installing ESA on on-premise or cloud platforms, refer to Installation.
Prerequisites
Before proceeding with the installation, ensure the following prerequisites are met.
Sites: Ensure that two sites are available — one designated for the Primary Site and another for the Disaster Recovery (DR) Site.
Network Connectivity: Ensure there is reliable network connectivity between the Primary and DR sites.
Installing and Configuring ESA
Install ESA (ESA P1) in the Primary Site.
For more information about detailed installation instructions for on-premise and cloud installation, refer to Installing ESA.
Initialize PIM in ESA P1.
For more information about initializing PIM in ESA, refer to Initializing the Policy Information Management.
Initialize Analytics in the Insight in ESA P1.
For more information about initializing Analytics, refer to Creating the Audit Store Cluster on the ESA.
Upload and apply Custom Certificates. Apply custom certificates for the following components:
- Management Server/Client
- Consul Server
- Audit Store Server/Client
- Audit Store REST Client
- Insight Analytics Client
- PLUG Client
For more information about recommendations related to certificates for various components, refer to Certificate Requirements.
For more information about steps to upload certificates in ESA, refer to Uploading Certificates.
For more information about steps to apply certificates in ESA, refer to Changing Certificates.
Define policies for Data Security. On ESA P1, define the necessary data elements, policies and configure external member source.
For creating and managing External Member Source, refer to Working With Member Sources.
For Creating and Deploying Policies, refer to Creating and Deploying Policies
Configure Proxy Authentication and External LDAP. On ESA P1, configure proxy authentication for configuration with External LDAP for managing ESA Administration.
For more information, refer to
Configuring ESA with External Keystore.
For more information about setting ESA to External Keystore, refer to Section Switching HSM Modules in the HSM Integration Guide for ESA.
Configure Rollover Index Insight Scheduler Parameters. Set the rollover index scheduler parameters according to specific requirements.
For more information about recommended configurations, refer to Index Rollover.
Configure Information Lifecycle Management (ILM) Export Insight Scheduler Parameters. Adjust the ILM export scheduler settings based on the requirements.
For more information about recommendation configurations for ILM Export, refer to ILM Export.
Configure ILM Multi Delete Insight Scheduler Parameters. Set the ILM Multi Delete insight scheduler parameters according to specific requirements.
For more information about recommendation configurations for ILM Multi Delete, refer to [ILM Delete](/docs/model_arch/model_arch/esa/insight.md#ilm-delete). <!-- fix link here -->
- Configure Alerts. Set up the required alerts to monitor system health and events.
For more information about recommendations related to configuration of alerts, refer to [Alerting](/docs/model_arch/model_arch/esa/insight.md#alerting). <!-- fix link here -->
Install additional ESAs.
In the Primary Site, install two additional ESAs: ESA S1 and ESA S2.
In the DR Site, install three ESAs: ESA S3, ESA S4, and ESA S5.
Create Trusted Appliances Cluster (TAC) between all ESAs in Primary and DR site. Create a TAC between ESAs P1, S1,S2 in Primary and ESAs S3,S4,S5 in DR Site.
For more information about creating TAC, refer to [Creating a TAC using the Web UI](/docs/aog/trusted_appliances_cluster/aog_creating_tac_ui/).
- Form an Insight Cluster: Join ESA S1 and ESA S2 to ESA P1 to form a robust and redundant Insight Cluster. Form Insight cluster in DR site between ESA S3,S4 and S5.
For more information about creating Insight cluster, refer to [Creating an Audit Store cluster](/docs/installation/upg_creating_audit_store_cluster/).
Create Replication Tasks. Establish a replication task on ESA P1 to replicate all ESA data—excluding SSH settings—to ESA S1, S2, S3, S4, and S5.
For more information, refer to ESA Primary to Secondary Replication Job in the Scheduler Tasks.
For more information about configuring scheduled task for cluster export, refer to Scheduling Configuration Export to Cluster Tasks.
Enable ILM Multi Export Scheduler task. By default, ILM Multi Export Scheduled task is disabled. So, it is necessary to enable this task and configure as per requirements.
For more information about ILM Multi Export, refer to Exporting logs.
Create Scheduled Tasks for copying ILM Exported Files from Primary Site to DR Site. Create a scheduled task in each of the ESAs in the primary site, that is, ESA P1, ESA S1, ESA S2. This task must copy ILM exported files from ESA P1, ESA S1, and ESA S2 to ESAs in DR site, that is, ESA S3, ESA S4, and ESA S5 in the DR Site.
For recommendations, refer to ESA Exported Indexes Purge in Scheduler Tasks.
For more information, refer to Creating a scheduled task.
Create Scheduled task for taking backup of ESA P1 to a file.
For recommendations, refer to Back up Primary ESA data to file in Scheduler Tasks.
Keep a detailed log and documentation of each step performed for future reference and troubleshooting.
Meticulously following these steps help establish a resilient and secure ESA infrastructure that aligns with the specified model architecture diagram.
12.2.4.3 - ESA Upgrade Scenarios
Overview
This section provides a comprehensive guidance for upgrading ESA deployments across different scenarios. The upgrade scenario you choose, depends on your current deployment architecture, including the presence of Protectors and DSGs.
Upgrade Scenarios
Select the appropriate upgrade scenario based on the current deployment configuration:
ESA with v9.1.0.0 or v10.x Protectors
This scenario addresses environments where ESA is deployed with Protector running version 9.1.0.0 or later.
ESA with DSG
This scenario covers deployments utilizing DSGs.
ESA with DSGs and v9.1.0.0 or v10.x Protectors
This scenario applies to deployments incorporating both DSGs and Protectors.
12.2.4.3.1 - Upgrading ESA
This section describes steps to upgrade ESAs.
To ensure compatibility and leverage new features, security fixes, and enhancements, it is necessary to upgrade the ESA to the latest version. This section outlines the required steps for upgrading from a previous version, applicable to both on-premise and cloud platforms.
Before you begin
Before beginning the upgrade, be sure to adhere to the following guidelines.
Freeze Policy and Ruleset Changes
Before upgrading the ESA, ensure all policy and ruleset changes are frozen.
No changes to the policies and rulesets should be made until the completion of the ESA upgrade.
Freeze Configurations in ESA
Prior to upgrading the ESA, freeze all configurations within the ESA. Ensure no configuration changes are made to any components in any of the ESAs until the upgrade is complete.
This section elaborates on the upgrade and configuration process for ESAs as per the Deployment with Default Audit logging flow to ESA Architecture diagram.
For more information about upgrading ESA, refer to Upgrading ESA to v10.
Upgrade Steps
On-Premise: Perform a full OS backup of all ESAs at both sites.
Cloud Premises: Take snapshots of each instance to ensure a restore point is available should any issues arise during the upgrade process.
For on-premise, refer to Working with OS Full Backup and Restore.
For AWS, refer to Backing up and Restoring Data on AWS.
For GCP, refer to Backing up and Restoring Data on GCP.
For Azure, refer to Backing up and Restoring VMs on Azure.
Disable the TAC replication job from Primary ESA P1.
Follow these steps to disable the TAC replication scheduled task:
- On the Primary ESA P1 Web UI, navigate to System > Task Scheduler.
- Click on the TAC replication scheduled task.
- Click Edit.
- Uncheck the Enable checkbox to disable the task.
- Click Save to save the changes.
- Click Apply to apply the changes.
Ensure all the prerequisites are followed before proceeding with the upgrade of each ESA.
For more information about the prerequisites, refer to Prerequisites.
Upgrade ESAs S3, S4, and S5 at the Disaster Recovery (DR) site in parallel.
For more information on upgrading ESA, refer to:
Validate DR Site ESAs post upgrade.
Conduct a thorough validation of the upgraded ESAs at the DR site to confirm operational integrity and successful upgrade.
Perform the following validations in all the ESAs.
Log in to ESA Web UI.
Check for correctness of the version under About.
Navigate to Key Management > Key Stores in ESA Web UI and ensure that External Keystore configurations are intact.
Navigate to Settings > Users and check that External Groups settings are intact.
Navigate to Audit Store > Cluster Management. Check if ESAs S3, S4, and S5 are visible under Nodes tab, and the Cluster Status is GREEN.
Upgrade ESAs P1, S1 and S2 at the Primary site in parallel.
For more information on upgrading ESA, refer to:
Validate Primary Site ESAs post upgrade.
Conduct a thorough validation of the upgraded ESAs at the primary site to confirm operational integrity and successful upgrade.
Perform the following validations in all the ESAs:
Log in to ESA Web UI.
Navigate to Key Management > Key Stores in ESA Web UI and ensure that External Keystore configurations are intact.
Navigate to Settings > Users and check that External Groups settings are intact.
Navigate to Audit Store > Cluster Management. Check if ESA P1, S1, and S2 are visible under Nodes tab, and the Cluster Status is GREEN.
Enable Scheduler tasks in Primary ESA P1.
Enable the TAC replication scheduler task in Primary ESA P1. For replicating scheduler tasks, refer to Scheduler Tasks.
Migrate Audit logs from DR site ESAs to Primary site ESAs.
When the traffic from protectors is redirected to the DR site ESAs, audit logs are generated in these ESAs. These audit logs must be migrated to Primary site ESAs.
Before proceeding with executing the steps, take a note of the following:
Take a note of the time in hours/days that the protectors were pointed to DR site ESAs.
Under Audit Store > Cluster Management, on the Indices tab, make note of the indices that were created during the time frame in the preceding step.
Take a note of the ILM exported indexes that are created under the directory /opt/protegrity/insight/archive in each of the ESAs in DR site for that time frame.
To migrate Audit logs from DR site ESAs to Primary site ESAs, perform the following steps:
Log in to the web UI of ESA S3 in the DR site.
Perform ILM Export of all the indexes noted at step 2.
For more information about performing ILM Export, refer to Exporting logs.
Log in to OS console of ESA S3. Navigate to the directory /opt/protegrity/insight/archive.
Copy all the exported index files generated by ILM Export operation at step 2. Transfer these index files to ESA S2 in primary site under directory /opt/protegrity/insight/archive.
Additionally, log in to all the ESAs containing ILM exported index files noted at step 3 above and copy them to ESA S2 under directory /opt/protegrity/insight/archive.
Finally, perform ILM Import of all the index files copied from ESAs in DR site as per step 4 and step 5.
For more information related to ILM Import, refer to Importing logs.
Additional Considerations
Documentation: Maintain detailed records of the upgrade procedure for future reference.
Troubleshooting: Have contingency plans in place to address potential issues arising during the upgrade. For more information on troubleshooting, refer to Troubleshooting.
Support: Utilize Protegrity support services for guidance or troubleshooting assistance as needed. For assistance, contact Protegrity Support at
support@protegrity.com.
By following these structured steps, the upgrade and configuration of ESAs will be executed effectively, ensuring minimal downtime, and maintaining system integrity.
12.2.4.4 - External Keystore Configuration
To enhance security, Protegrity products can be integrated with external Key Stores. For more information to configure ESA with External Key Store, refer section Configuring ESA Appliance or DSG Appliance to Communicate with Safenet HSM in the HSM Integration Guide on the My.Protegrity portal.
12.2.4.5 - Scheduler Tasks
To maintain the resiliency, efficiency, and reliability of the ESA, it is essential to set up scheduled tasks.
The recommended scheduled tasks to configure on the ESA is provided here.
Task Summary and Description
1. ESA Primary to Secondary Replication Job
Description: This task must be configured in primary ESA P1. It performs replication of data from the Primary ESA P1 to all the secondary ESAs, that is, ESA S1, ESA2, ESA S3, ESA S4, ESA S5.
Frequency: Recommended to run daily at midnight. It is important that this task must be executed immediately after a change in policy or rulesets. It must also be performed in case of changes made to any of the keys under Key Management menu in ESA Web UI.
Important: Ensure only the following items are selected as part of this Cluster Export task.
Appliance OS Configuration: Export OS configuration
- Web Settings
- Firewall Settings
- Appliance Authentication Settings
- Appliance JWT Configuration
- Appliance AZURE AD Configuration (If Azure AD is being used)
- Time-zone and NTP settings
- OS Services Status
- Appliance FIM Policies and Settings
- User custom list of files (If custom files are present)
Directory Server And Settings: Export directory services and related settings
- LDAP Server
Export Consul Configuration and Data
- Import Consul Certificates and keys
Cloud Utility AWS: Cloud Utility AWS CloudWatch configuration files
- Import Cloud Utility AWS CloudWatch configuration files
Backup Policy-Management for Trusted Appliances Cluster: Backup All Policy-Management Configs, Keys, Certs and Data for Trusted Appliance Cluster
- Import All Policy-Management Configs and Data for Trusted Appliance Cluster
Policy Manager Web UI Settings: Export policy manager web ui settings
- Import policy manager web ui settings
Export Gateway Configuration Files: Gateway Config Files Export
- Gateway Config Files Import
Do not select the below options as part of this cluster export task
- SSH settings
- Management and WebServices Certificates
- Certificates
- Import All Policy-Management Configs, Keys, Certs, Data but without Key Store files for Trusted Appliance Cluster
Important: Scheduled tasks are not replicated as part of cluster export.
2. ESA Exported Indexes Move
Description: This task must be configured in all the ESAs in primary site, that is, ESA P1, ESA S1, and ESA2. It moves the ILM exported index files from respective ESAs, that is, ESA P1, ESA S1 and ESA S2 to ESA S5 in DR site.
Frequency: Recommended to run weekly.
3. Back up Primary ESA data to file.
Description: This task must be configured in primary ESA P1. It backs up data from Primary ESA to a file and moves it to a remote machine.
Frequency: Recommended to run weekly.
Important: Ensure only the following items are selected as part of this File Export task.
Appliance OS Configuration
Directory Server And Settings
Export Consul Configuration and Data
Cloud Utility AWS (if AWS Cloud Utility is configured and being used)
Backup Policy-Management
Policy Manager Web UI Settings
Export Gateway Configuration Files
Do not select the below option as part of this file export task
- Backup Policy-Management for Trusted Appliances Cluster without Key Store.
Important: Scheduled tasks are not backed up as part of file backup.
12.2.4.6 - Backup and Restore
Effective backup and restore procedures are crucial for ensuring data integrity and system reliability.
Below are the key backup and restore strategies to implement in the ESA environment:
Full OS
Description: Backup of the complete operating system including all configurations, applications, and user data in ESA. This is applicable only for on-prem environment.
Frequency: Recommended weekly or before and after significant changes such as upgrade.
Restore Steps: Boot into a System Restore Mode to restore to last backed up state.
For more information to perform full OS backup and restore, refer to Working with OS Full Backup and Restore.
Important: The Full OS Backup/Restore features of the Protegrity appliances is available only for the on-premise deployments. It is not available for virtual machines created using an OVA template and cloud-based virtual machines.
Cloud
Description: Create snapshots of ESA instances for disaster recovery. This is applicable only for cloud environment.
Frequency: Recommended weekly or before and after significant changes such as upgrade or changes to policy in ESA.
Restore Steps: Restore the snapshot by following the cloud provider-specific restore procedure.
File
Description: Ensure that ESA data is regularly backed up and stored securely. Automating the process using scheduled task in ESA will help maintain consistency and reduce manual intervention. The restore steps allow easy recovery of data, ensuring minimal disruption in case of failure.
Frequency: Recommended weekly or before and after significant changes such as upgrade or changes to policy in ESA. It must also be performed in case of changes made to any of the keys under Key Management menu in ESA Web UI.
Tools: Configure Scheduled task in ESA to use tools like rsync, scp to copy exported backup files from ESA to an external machine. Ensure backup files are created along with timestamp. For more information, refer to Back up Primary ESA data to file.
Restore Steps: Upload the required backed up matching the required timestamp to the ESA and initiate import. For more information about importing the backup file, refer to Importing Data/Configurations from a File.
Important: Scheduled tasks are not backed up as part of file backup.
Custom Files
The following custom files should be backed up and included as part of customer.custom to ensure they are replicated to all ESAs in the cluster during replication jobs:
Any custom files for td-agent.
Any custom files related to External HSM configurations, shared library files.
Any changes to rsyslog.
For more information about adding the required custom files as mentioned above, refer to Working with the custom files.
12.2.4.7 - Insight
Insight Analytics and Audit (Insight) leverages OpenSearch and OpenSearch Dashboard to perform analytics on audit events and log messages aggregated in the Audit Store. Both are distributed as Docker containers that can be hosted on ESAs.
ILM Export
This section outlines the ILM export configuration for various log and metric indices. The objective is to manage the lifecycle of these indices efficiently, ensuring data is archived or deleted as required.
| Index | ILM Export Configuration |
|---|---|
| Audit Log Index | Maximum size: 50 GB Maximum doc count: 50 million Maximum index age: 30 days |
| Protector Status Logs Index | Maximum size: 150 GB Maximum Doc count: 1 billion Maximum index Age: 365 days |
| Troubleshooting Logs Index | Maximum size: 150 GB Maximum Doc count: 1 billion Maximum index Age: 365 days |
| Policy Logs Index | Maximum size: 150 GB Maximum doc count: 1 billion Maximum index age: 365 days |
| Miscellaneous Index | Maximum size: 200 MB Maximum doc count: 3.5 million Maximum index age: 7 days |
| DSG Transaction Metrics Index | Maximum size: 1 GB Maximum doc count: 10 million Maximum index age: 1 day |
| DSG Error Metrics Index | Maximum size: 1 GB Maximum doc count: 3.5 million Maximum index age: 1 day |
| DSG Usage Metrics Index | Maximum size: 1 GB Maximum doc count: 3.5 million Maximum index age: 1 day |
ILM Export Configuration Considerations
Maximum size: Defines the maximum size an index can reach before getting exported.
Maximum doc count: Defines the maximum doc count an index can reach before getting exported.
Maximum index age: Defines the maximum age an index can reach before getting exported.
Conditions: ILM Export occurs when either of the above limits is reached where index entries from the index are removed and archived to a file.
For more information about configuring ILM Export, refer to ILM Multi Export.
ILM Delete
This section outlines the ILM export configuration for various log and metric indices. The objective is to manage the lifecycle of these indices efficiently, ensuring data is archived or deleted as required.
| Index | ILM Export Configuration |
|---|---|
| Miscellaneous Index | Maximum size: 1 GB |
| DSG Transaction Metrics Index | Maximum size: 14 GB Maximum doc count: 100 million Maximum index age: 30 days |
| DSG Error Metrics Index | Maximum size: 6 GB Maximum doc count: 50 million Maximum index age: 30 days |
| DSG Usage Metrics Index | Maximum size: 10 GB Maximum doc count: 75 million Maximum index age: 30 days |
ILM Export Configuration Considerations
Maximum size: Defines the maximum size an index can reach before getting deleted.
Maximum doc count: Defines the maximum doc count an index can reach before getting deleted.
Maximum age: Defines the maximum age an index can reach before getting deleted.
Conditions: Deletion occurs when either of the above limits is reached.
For more information about configuring ILM Delete, refer to ILM Multi Export.
Index Rollover
This section details the index rollover settings for various log and metric indices. Efficient rollover policies ensure high performance and manageability of the indices.
| Index | Index Rollover Configuration |
|---|---|
| Audit Log Index | Maximum size: 50 GB Maximum doc count: 50 million Maximum index age: 1 day |
| Protector Status Logs Index | Maximum size: 5 GB Maximum doc count: 200 million Maximum index age: 30 days |
| Troubleshooting Logs Index | Maximum size: 5 GB Maximum doc count: 200 million Maximum index age: 30 days |
| Policy Logs Index | Maximum size: 5 GB Maximum doc count: 200 million Maximum index age: 30 days |
| Miscellaneous Index | Maximum size: 200 MB Maximum doc count: 3.5 million Maximum index age: 7 days |
| DSG Transaction Metrics Index | Maximum size: 1 GB Maximum doc count: 10 million Maximum index age: 1 day |
| DSG Error Metrics Index | Maximum size: 1 GB Maximum doc count: 3.5 million Maximum index age: 1 day |
| DSG Usage Metrics Index | Maximum size: 1 GB Maximum doc count: 3.5 million Maximum index age: 1 day |
Index Deletion Configuration Considerations
Maximum size: Defines the maximum size an index can reach before rolling over.
Maximum doc count: Defines the maximum doc count an index can reach before rolling over.
Maximum age: Defines the maximum age an index can reach before rolling over.
Conditions: Index Rollover occurs when either of the limits is reached.
For more information about configuring Audit Index Rollover, refer to Audit Index Rollover.
Alerting
Create a scheduled task in all the ESAs to monitor and log spikes in CPU, memory, or disk usage that exceed configured thresholds. These logs must be systematically forwarded to the Insight within the ESA.
For more information about configuring alerts, refer to Working with alerts.
Requirements
Monitoring Metrics: The task should observe the following system metrics:
- CPU Usage
- Memory Usage
- Disk Usage
Threshold Configuration
- Define specific thresholds for CPU, memory, and disk usage.
- Ensure these thresholds can be adjusted as needed.
Log Generation
Generate detailed logs whenever a spike in CPU, memory, or disk usage exceeds the configured threshold.
Log Forwarding
Implement mechanisms to forward these logs to the Insight within the ESA.
Implementation Steps
Script Development
- Develop a script to monitor CPU, memory, and disk usage.
- Incorporate threshold parameters into the script.
Schedule the task using Task Scheduler.
For more information about creating scheduled task using task scheduler, refer to Creating a scheduled task.
Logging Mechanism
Use logger library to write logs to syslog.
Test and Validate
Conduct thorough testing to ensure the script accurately detects and logs spikes.
Validate that logs are correctly forwarded to and received by the Insight.
By implementing this scheduled task, the ability to monitor system health and respond proactively to potential issues is enhanced, thereby improving overall system stability and security compliance.
Audit Store Dashboards
It is recommended that default dashboards in ESAs are not modified or deleted.
For more information on Protegrity provided dashboards, refer to Working with Protegrity dashboards.
12.2.5 - Recommended Traffic Manager
The Global and Local Traffic Manager should be a Layer-4 Proxy/Load Balancer. Alternatively, it could also be a DNS Switch.
Layer-4 Proxy/Load Balancer
A Layer-4 proxy/load balancer operates at the transport layer, which means it handles traffic based on IP address and TCP/UDP ports. This type of load balancer is efficient for distributing traffic evenly across servers without inspecting the actual application data.
Examples
HAProxy: A reliable, high-performance TCP/HTTP load balancer.
Nginx: Can be configured to operate as a Layer-4 load balancer.
Configuration Example (HAProxy)
frontend tcp_in
    bind *:8443
    mode tcp
    default_backend esa_servers

backend esa_servers
    mode tcp
    balance first
    server esa1 192.168.1.2:8443 check
    server esa2 192.168.1.3:8443 check backup
    server esa2 192.168.1.4:8443 check backup
DNS Switch
A DNS switch changes the DNS records to direct traffic to different servers based on predefined rules. It can be used for simple load balancing or failover scenarios.
Examples
- Amazon Route 53: AWS’s scalable DNS and domain name registration service.
Configuration Considerations for DNS Switch
TTL Settings: Keep TTL low for quicker propagation of changes.
Health Checks: Ensure the DNS provider supports health checks and automatic failover.
Geo-routing: Use geographical routing to minimize latency for users.
Ports Eligible for Load Balancer/Proxy with Active and DR Flows
| Port | Service in ESA | Purpose | Active Flow | DR Flow |
|---|---|---|---|---|
| 8443 | Service Dispatcher | For v9.1.0.0 Protectors to download policy from ESA | Protector -> GTM -> LTM-1 -> ESA P1 | Protector -> GTM -> LTM-2 -> ESA S3 |
| 443 | Service Dispatcher | For Web UI | Protector -> GTM -> LTM-1 -> ESA P1 | Protector -> GTM -> LTM-2 -> ESA S3 |
| 25400 | RPP | For v10.0.0 Protectors to download package from ESA | Protector -> GTM -> LTM-1 -> ESA P1 | Protector -> GTM -> LTM-2 -> ESA S3 |
| 9200 | Insight | For protectors to forward logs to Insight in all 3 ESAs directly in the site in round robin fashion without External SIEM | Protector -> GTM -> LTM-1 -> ESA P1, ESA S1, ESA S2 | Protector -> GTM -> LTM-2 -> ESA S3, ESA S4, ESA S5 |
| 24224/24284 | TD-Agent | For protectors to forward logs to TD-Agent in all 3 ESAs in the site in round robin fashion with External SIEM | Protector -> GTM -> LTM-1 -> ESA P1, ESA S1, ESA S2 | Protector -> GTM -> LTM-2 -> ESA S3, ESA S4, ESA S5 |
| 389 | LDAP | For LDAP and REST API Basic Authentication for DSG(s) | Protector -> GTM -> LTM-1 -> ESA P1 | Protector -> GTM -> LTM-2 -> ESA S3 |
12.2.6 - Disaster Recovery
In the realm of Disaster Recovery, multiple ESA instances are organized into a TAC in different sites, that is, Primary site and DR site to ensure Disaster Recovery (DR). The following details outline how this system is configured and operates:
Cluster Configuration
Primary-Secondary Replication: Changes made on the Primary ESA P1 to files, configurations, and other data are replicated over a trusted channel to Secondary ESAs, ESA S1, S2, and S3 in the primary site. The same changes are also replicated to ESA S4, S5, and S6 in the DR site.
For more information about replicating primary ESA to secondary, refer to ESA Primary to Secondary Replication Job.
Failover Mechanism: If the Primary becomes unavailable, a Secondary can be promoted to Primary to maintain operational continuity.
For more information about promoting Secondary ESA to Primary ESA, refer to Promoting Secondary ESA to Primary ESA.
Back up Primary ESA P1 data to a file: Alternatively, backed up file from primary ESA P1 can also provide disaster recovery.
For more information, refer to Back up Primary ESA data to file.
12.2.6.1 - Promoting Secondary ESA to Primary ESA
Promoting Secondary ESA to Primary ESA
If there is a failover from Primary ESA P1 to Secondary ESA S3 in the DR Site, refer to Architecture Diagram. If the downtime of Primary ESA P1 is going to be for more than an hour, then it is recommended to perform the following steps:
Make secondary ESA S3 as Primary. Create a replication task to replicate the Policy Management and other required data from Secondary ESA S3 to Primary ESA P1.
As soon as the Primary ESA P1 is online, ensure to disable the replication task that is already created.
Perform the following steps for performing failover from Primary to DR Site and failback, that is, from DR site to Primary site:
Failover to DR site
Since ESA P1 in primary site is down, failover to DR site’s ESA, that is, ESA S3 happens.
Promote Secondary ESA to Primary in DR Site
Secondary ESA S3 is now promoted to Primary by enabling the TAC replication job to replicate from ESA S3 to all other ESAs.
Bring up ESA P1 in Site A as Secondary
Once ESA P1 in primary site is ready to be brought up, bring it up as secondary ESA.
As ESA S3 is already elevated to Primary, ESA P1 would start getting the latest updates from ESA S3 through replication.
This can be confirmed through the following steps:
a. Log in to ESA P1 Web UI.
b. Navigate to System > Task Scheduler.
c. Select the replication task.
d. Scroll down the page to view the details of the scheduled task.
e. Ensure that Exportimport command in the Command line shows the updated command as per Step 2.
Allow for replication tasks from ESA S3 to ESA P1 to happen for atleast 2 cycles.
Failback to Primary Site
After the original primary ESA P1 is replicated from primary ESA S3, then follow these steps to disable the replication task in ESA S3 to other ESAs.
a. Log in to web UI of ESA S3.
b. Disable the replication task to replicate data from ESA s3 to other ESAs.
Perform the following steps to enable replication task in ESA P1:
a. Log in to web UI of original primary ESA P1.
b. Enable the replication task to replicate data from ESA P1 to ESA S3.
c. Restore GTM to point to primary site.
d. Validate that all the pepserver node entry in the ESA P1 is GREEN.
12.2.7 - Fault Tolerance
The Fault Tolerance strategy encompasses measures to ensure that the ESA infrastructure remains robust against failures and continues to operate optimally under various failure conditions. The key aspects include the following.
ESA Redundancy
Achieve network redundancy by utilizing multiple network paths to prevent single points of failure in the network infrastructure for ESA, that is, having GTM/LTM architecture.
Load Balancing
Deploying load balancers not only aids in disaster recovery but also ensures balanced distribution of traffic specially for forwarding logs to prevent any single ESA from becoming a bottleneck.
Regular Testing
Periodically test failover mechanisms to ensure that they work correctly when needed.
Conduct regular DR drills to verify that the transition from primary to DR site occurs smoothly without service disruption.
Proactive Monitoring
Continuously monitor ESA performance and health metrics to detect issues early and take corrective actions before they escalate into major problems. This can be done by configuring alerts to monitor system monitoring metrics. For more information, refer to Alerting.
12.2.8 - Security
These guidelines are intended to enhance the overall security posture, safeguard sensitive information, and mitigate potential risks. By adhering to these recommendations, organizations can ensure a more secure and resilient environment for their operations.
12.2.8.1 - Open Ports
For information about the list of ports that needs to be configured to access the features and services on the Protegrity Products, refer to Open listening ports.
12.2.8.2 - Certificate Requirements
The following table outlines the certificate requirements for various components within the ESA infrastructure:
The following table provides an example of the recommended deployment architecture in the Model Architecture section.
12.2.8.3 - FIPS Compliance Requirements
It is recommended to enable FIPS mode in all the ESAs.
For more information about configuring FIPS mode in ESA, refer to FIPS Mode.
12.2.8.4 - Users and Password Policy
A robust users and password policy is essential to ensure the security of the system by controlling access and maintaining the integrity of user accounts.
The following guidelines outline the key requirements for managing users and passwords within the system:
Password Creation
Enforce strong password creation policies.
- Minimum length: 8 characters
- Complexity: Must include uppercase letters, lowercase letters, numbers, and special characters.
Prohibit the use of common passwords and passwords from known data breaches.
Employ mechanisms to prevent the reuse of previous passwords such as, history of 5 previous passwords.
Password Protection
Use multi-factor authentication (MFA) to provide an additional layer of security.
Password Change Requirements
Require users to change their passwords at regular intervals, for example, every 90 days.
Force password changes immediately if a compromise or suspicion of compromise is detected.
Provide mechanisms for users to securely reset their passwords.
Account Lockout Policies
ESA is configured with account lockout after 3 unsuccessful login attempts.
If an external account manager is used:
Implement account lockout after a specified number of failed login attempts, for example, locking out after 3 unsuccessful attempts.
Define a lockout duration or require administrative intervention to unlock accounts.
For more information about password policy for appliance users, refer to Password Policy for all appliance users.
12.2.8.5 - File Integrity Monitoring
Ensure File Integrity Monitoring scheduled task is enabled in ESA.
For more information about the file integrity monitoring, refer to Working with File Integrity.
12.2.8.6 - Delete Default System Certificates
To enhance the security of your system, it is strongly recommended that all default system certificates must be deleted after the application of custom certificates. This is outlined in the Certificate Requirements. Implementing the custom certificates ensures that the encryption credentials are unique to your organization and align with your specific security protocols.
12.2.8.7 - Uninstall Consul
For enhanced security, it is advisable to uninstall Consul from the ESA. Consul necessitates the inclusion of ’localhost’ in the Subject Alternative Name (SAN) field of certificates, which can introduce potential vulnerabilities.
To maintain a secure environment and adhere to best practices, TAC can be configured without integrating with Consul.
For more information about configuring TAC without consul, refer to Configuring a Trusted Appliance Cluster (TAC) without Consul Integration.
12.2.9 - Data Security Gateway (DSG)
The DSG is a flexible platform that applies security operations on the network to protect sensitive data in various environments, including on-premises, virtualized, and cloud. It safeguards data across SaaS applications, web interfaces, APIs, and file transfers using Configuration over Programming (CoP) profiles.
Architecture diagram for DSG v4.0.0
Architecture diagram for ESA v10.2.0 with v4.0.0
Architecture diagram for DSG v4.0.0 in TAC
| Component | Active Flow | Failover Flow |
|---|---|---|
| Deployment of Rulesets from ESA | _____ | - - - - - - |
| Package Download | _____ | - - - - - - |
| Forwarding of Audit Events to ESA | _____ | - - - - - - |
Communication Flow
DSG-1: DSG node configured during DSG patch installation in ESA.
DSG-2 to DSG-n: Other DSGs in TAC
The following table describes communication flows as depicted in diagrams above.
| Flow | Request Initiator | Destination | Port | Protocol | Flow Description | Configuration |
Deployment of Rulesets from ESA | ESA P1 | DSG-1 | 443 | TLS | Step-1: ESA P1 initiates HTTPs request to DSG-1 directly, without GTM/LTM, to send command for DSGs to pull rulesets from ESA P1. If DSG-1 is down, then ESA P1
connects to any of the DSGs i.e. DSG-2 to DSG-n. | Primary Active Flow: Sticky to ESA P1 with other ESAs as standby ESA P1 -> DSG-1 DR Flow: Sticky to ESA S3 with other ESAs as standby ESA S3 -> DSG-1. |
| DSG node registered in ESA | All other DSGs in TAC | 8300 | TLS | Step-2: DSG forwards the command to pull rulesets to all other DSGs in TAC. | Not Applicable | |
| All DSGs in TAC | GTM | 443 | TLS | Step-3: All DSGs in TAC pulls rulesets from ESA P1 in parallel. | Primary Active Flow: Sticky to ESA P1 with other ESAs as standby All DSGs in TAC ->GTM-> LTM-1-> ESA P1. DR Flow: Sticky to ESA S3 with other ESAs as standby. All DSGs in TAC -> GTM -> LTM-2 -> ESA S3 | |
Package Download | RPP in the DSG node | RPP in ESA | 25400 | TLS |
| Primary Active Flow: Sticky to ESA P1 with other ESAs as standby. DSG -> GTM -> LTM-1 -> ESA P1 DR Flow: Sticky to ESA S3 with other ESAs as standby. DSG ->GTM -> LTM-2 -> ESA S3 |
Forwarding of Audit Events to ESA | Log Forwarder in the protector node | Insight in ESA | 9200 | TLS |
| Primary Active Flow: Routed to all ESAs in the Primary
Site. DSG -> GTM ->LTM-1 ->ESA P1, S1, S2 DR Flow: Routed to all ESAs in the DR Site. DSG -> GTM -> LTM-2 -> ESA S3, S4, S5 |
Forwarding of Audit Events to External SIEM using the ESA. | Log Forwarder in the DSG node | TD-Agent in ESA | 24224/ 24284 | Non-TLS/TLS |
| Primary Active Flow: Routed to all ESAs in the Primary Site. DSG -> GTM -> LTM-1 -> ESA P1, S1, S2 -> External SIEM DR Flow: Routed to all ESAs in the DR Site. DSG -> GTM -> LTM-2 -> ESA S3, S4, S5 -> External SIEM |
12.2.9.1 - Installing and Configuring DSG
Before you begin
Before you begin installing and configuring DSG, consider the following.
Assumptions
This section assumes that
There is no prior installation of DSG. Installation of DSG is happening from the beginning..
GTM and LTM are provisioned and installed. For information about prescribed configurations for GTM or LTM, refer to Recommended Traffic Manager.
Prerequisites
Ensure there is good network connectivity between the machine where DSG is going to be installed and all the ESAs, and they can communicate with each other.
Ensure ESAs in both the Primary site, ESA P1, S1, S2, and the DR site, ESA S3, S4, S5, are up and running.
Ensure that ESAs in both sites are in a TAC.
Ensure that PIM is initialized on all the ESAs.
Ensure that ESAs in Primary site are in an Audit Store Cluster and ESAs in DR site are in a separate Audit Store Cluster.
Ensure all ESAs and DSGs are in the cluster, and that they themselves are reachable using hostname or FQDN.
Installing and Configuring the DSGs.
Install DSGs v4.0.0.
For more information about installing DSG v4.0.0, refer to Installing the DSG.
Create a TAC. Create a TAC in one of the DSGs installed in the previous step.
Join DSGs to the TAC. Join the rest of the DSGs to the TAC created in the previous step.
Upload and Install DSG Management Server Certificates. Upload and install DSG Management Server certificates in each of the DSGs individually. Ensure the SAN field in each of the certificates has the hostname and FQDN of the DSG node it is going to be installed in.
Perform ESA Communication.
Perform ESA communication from all the DSGs. For all the options in ESA communication, provide GTM IP, hostname, or FQDN as applicable.
For more information about performing set ESA communication, refer to Setting up ESA communication.
Install DSG patch on all the ESAs in the Primary and DR site.
Install DSG v4.0.0 patch on all ESAs in both sites, that is, ESA P1, S1, S2 in the primary site and ESA S3, S4, S5 in the DR site.
Register DSG with ESA.
During the prompt for DSG details during DSG registration, provide any of the DSG’s FQDN/hostname in TAC. Ensure the same DSG FQDN or hostname is provided during DSG registration in all other ESAs.
Upload and apply DSG Admin Tunnel Certificates.
Upload and apply DSG Admin tunnel certificates from Web UI in ESA P1.
For more information regarding uploading and applying DSG Admin tunnel certificates, refer to Upload Certificate/Keys.
Create and Deploy DSG Tunnels and Ruleset.
Create Tunnels and Ruleset.
Create tunnels and rulesets from the Web UI in ESA P1.
For more information related to creating tunnels, refer to Tunnels.
For more information related to creating rulesets, refer to Ruleset Reference.
Deploy Rulesets.
Click on the Deploy button from the DSG’s Cluster page in ESA P1 to deploy rulesets in all the DSGs present in the TAC.
For more information related to deploying rulesets, refer to Deploying configurations to the cluster.
Check Health Status of DSGs under Cluster Page.
After the deployment of rulesets is successful, check the health status of DSGs in TAC from the DSG’s Cluster page in ESA P1. All the DSGs should show health status as green.
Ensure TAC Replication Job includes DSG configuration.
Ensure that the TAC replication job also includes the DSG configuration. This configuration must be replicated from the Primary ESA P1 to all Secondary ESAs, S1, S2, S3, S4, and S5.
Make sure to follow these steps meticulously to ensure a seamless installation and configuration process.
12.2.9.2 - Upgrading ESA with DSG
This section describes the steps to upgrade ESAs with DSG (Data Security Gateway) installed. To ensure compatibility and leverage new features, security fixes, and enhancements, both ESAs and DSGs must be upgraded to the latest version.
Prerequisites
Before proceeding with the upgrade, ensure the following requirements are met:
- All ESAs must be on v9.1.0.0 or above.
- All DSGs must be on v3.1.0.0 or above.
- Ensure network connectivity between the DSG installation machine and all ESAs.
- Ensure ESAs in both Primary site (ESA P1, S1, S2) and Disaster Recovery (DR) site (ESA S3, S4, S5) are operational.
- Ensure all ESAs and DSGs in the cluster are reachable using hostname or FQDN.
- Ensure all ESAs and DSGs are using common CA.
- Review the before you begin section.
Related Documentation
If DSGs are installed along with other v9.1.0.0 protectors, refer to Upgrading ESA with DSGs and Protectors.
Upgrade Approaches
There are two upgrade approaches available for DSG, a canary upgrade and an in-place upgrade.
The canary upgrade reimages DSG instances to the newer version using ISO or cloud images. Refer to Canary Upgrade for instructions.
The in-place upgrade is for upgrading existing instances using patches. Refer to In-place Upgrade for instructions.
Select the appropriate upgrade approach based on organizational requirements, infrastructure constraints, and operational considerations.
Important: Both upgrade approaches will incur DSG downtime during the upgrade process. Plan accordingly to minimize impact on production operations.
Canary Upgrade
The canary upgrade involves reimaging existing DSG instances to the newer version using ISO or cloud images. This can be performed by reusing the same instance or spawning a new instance for DSG and terminating the older version DSGs.
Important: DSG downtime will occur during upgrade. However, downtime can be minimized by spawning fresh DSGs v4.0.0 in parallel to upgrading ESAs.
Phase 1: DR Site Upgrade
For backing up ESAs, refer to Backup all ESAs.
Disable TAC replication job from Primary ESA P1.
For disabling TAC replication, refer to Disable TAC replication job from Primary ESA P1.
Ensure all the prerequisites are followed before proceeding with the upgrade of each ESA.
For more information about the prerequisites, refer to Prerequisites.
Upgrade ESAs S3, S4 and S5 at the DR site parallely.
For upgrading DR site ESAs, refer to Upgrade ESAs S3, S4 and S5 at the DR site.
Validate DR site ESAs post upgrade.
For validating DR site ESAs, refer to Validate DR Site ESAs Post Upgrade.
Stop Application Traffic to DSGs.
Ensure to stop the Application Traffic to any of the DSGs.
- Remove all existing DSGs from the TAC before proceeding with further upgrade steps.
- Stop all existing DSGs to minimize the downtime impact.
Phase 2: Primary Site Upgrade
Upgrade ESAs P1, S1 and S2 at the Primary site parallely.
For upgrading primary site ESAs, refer to Upgrade ESAs P1, S1 and S2 at the Primary site.
Validate Primary Site ESAs post upgrade.
For validating primary site ESAs, refer to Validate Primary Site ESAs post upgrade.
Create fresh DSGs v4.0.0. Perform this step in parallel to upgrading ESAs in Primary Site to minimize DSG downtime. Create DSGs v4.0.0 using ISO or cloud image as applicable.
For more information, refer to Installing the DSG.
Create a new TAC with reimaged DSGs. Starting with DSG v3.3.0.0, ESAs and DSGs should be in separate TACs. Create a new TAC with DSGs reimaged in the preceding step.
Upload and install DSG Management Server certificates in each DSG individually. Ensure the SAN field in each certificate contains the hostname and FQDN of the DSG node where it will be installed.
Install DSG patch on all ESAs.
Install DSG v4.0.0 patch on all ESAs in both Primary and DR sites, that is, ESA P1, S1, S2, S3, S4, and S5.
Perform ESA communication from all DSGs. For all options in ESA communication, provide GTM IP, hostname, or FQDN as applicable. For more information, refer to Setting up ESA communication.
During the prompt for DSG details, provide the FQDN or hostname of any running DSG in the TAC. Ensure the same DSG FQDN or hostname is provided during DSG node registration in all ESAs, that is, P1, S1, S2, S3, S4, and S5.
Verify that all installed DSGs are listed under Cloud Gateway > Cluster page in ESA P1.
Click the Deploy button from the DSG Cluster page in ESA P1 to deploy rulesets to all DSGs present in the TAC. For more information, refer to Deploying configurations to the cluster.
After successful deployment of rulesets, verify the health status of DSGs in the TAC from the DSG Cluster page in ESA P1. All DSGs should show health status as green.
- Confirm that DSGs can perform data security operations post-upgrade.
- Verify that audit events are being forwarded successfully to the ESAs.
Phase 3: Post-Upgrade Tasks
Enable Scheduler tasks in Primary site ESAs.
For enabling scheduler tasks, refer to Enable Scheduler tasks in Primary site ESAs.
Migrate Audit logs from DR site ESAs to Primary site ESAs.
When the traffic from protectors was redirected to the DR site ESAs, audit logs will be generated in those ESAs. Those audit logs need to be migrated to Primary site ESAs. For migrating audit logs, refer to Migrate Audit logs from DR site ESAs to Primary site ESAs.
With successful upgrade of DSGs and validation of operations, terminate all older version DSGs that were stopped in Pre-Upgrade Steps for DSG to free up resources.
In-place Upgrade
The in-place upgrade involves upgrading existing DSG instances to the newer version sequentially using patches.
Phase 1: DR Site Upgrade
For backing up ESAs, refer to Backup all ESAs.
Disable TAC replication job from Primary ESA P1.
For disabling TAC replication, refer to Disable TAC replication job from Primary ESA P1.
Ensure all the pre-requisites are followed before proceeding with the upgrade of each ESA.
For more information about the prerequisites, refer to Prerequisites.
Upgrade ESAs S3, S4 and S5 at the DR site parallely.
For upgrading DR site ESAs, refer to Upgrade ESAs S3, S4 and S5 at the DR site.
Validate DR Site ESAs post upgrade.
For validating DR site ESAs, refer to Validate DR Site ESAs Post Upgrade.
Stop Application Traffic to DSGs.
Ensure to stop the Application Traffic to any of the DSGs.
Adjust configurations to redirect the GTM to point to LTM2. This ensures that DSG nodes, after upgrade, communicate with the upgraded ESAs at the DR site.
Important: At this stage, do not add any new DSG nodes. Also, do not make any changes to ESA or DSG configurations or rulesets. The validations mentioned in the following steps must be performed using existing DSG nodes.
Install DSG Patch on DR Site ESAs.
Install DSG v4.0.0 patch on all ESAs in the DR site, that is, ESA S3, S4, and S5.
Upgrade the DSGs by applying the patch. For more information, refer to Upgrading to DSG 4.0.0.
- For DSG v3.3.0.1 or later, DSGs can be upgraded in parallel.
- For DSG versions prior to v3.3.0.1, upgrade DSGs one at a time.
Perform post upgrade steps in DSG. For more information, refer to Post Upgrade Steps.
Upload and install DSG Management Server certificates in each DSG individually. Ensure the SAN field in each certificate contains the hostname and FQDN of the DSG node where it will be installed.
- Choose one of the upgraded DSGs as a primary DSG.
- Restore DSG TACs from the designated primary DSG that were earlier a part of TAC.
- On the CLI Manager, navigate to Tools > Restore DSG-DSG TAC.
- Enter the appropriate user credentials and select OK.
- All the DSGs that were a part of a TAC and upgraded, are now restored.
Perform ESA communication from all DSGs. For all options in ESA communication, provide GTM IP, hostname or FQDN as applicable. For more information, refer to Setting up ESA communication.
During the prompt for DSG details, provide the FQDN or hostname of any running DSG in the TAC. Ensure the same DSG FQDN or hostname is provided during DSG node registration in all ESAs, that is, S3, S4, and S5.
Verify that all installed DSGs are listed under Cloud Gateway > Cluster page in ESA S3.
Click the Deploy button from the DSG Cluster page in ESA S3 to deploy rulesets to all DSGs present in the TAC. For more information, refer to Deploying configurations to the cluster.
After successful deployment of rulesets, verify the health status of DSGs in the TAC from the DSG Cluster page in ESA S3. All DSGs should show health status as green.
- Confirm that DSGs can perform data security operations post upgrade.
- Verify that audit events are being forwarded successfully to the DR site ESAs.
Phase 2: Primary Site Upgrade
Upgrade ESAs P1, S1 and S2 at the Primary site parallely.
For upgrading primary site ESAs, refer to Upgrade ESAs P1, S1 and S2 at the Primary site.
Validate Primary Site ESAs post upgrade.
For validating primary site ESAs, refer to Validate Primary Site ESAs post upgrade.
Install DSG Patch on Primary Site ESAs.
Install DSG v4.0.0 patch on all ESAs in the Primary site, that is, ESA P1, S1, and S2.
During the prompt for DSG details, provide the FQDN or hostname of any running DSG in the TAC. Ensure the same DSG FQDN or hostname is provided during DSG node registration in all ESAs, that is P1, S1, and S2.
Adjust the configurations to redirect the GTM to point to LTM1. This ensures that DSG nodes communicate with the upgraded ESAs at the Primary site.
Verify that all installed DSGs are listed under Cloud Gateway > Cluster page in ESA P1.
Click the Deploy button from the DSG Cluster page in ESA P1 to deploy rulesets to all DSGs present in the TAC. For more information, refer to Deploying configurations to the cluster.
After successful deployment of rulesets, verify the health status of DSGs in the TAC from the DSG Cluster page in ESA P1. All DSGs should show health status as green.
- Confirm that DSGs can perform data security operations.
- Verify that audit events are being forwarded successfully to the ESAs in the Primary site.
Phase 3: Post Upgrade Tasks
Enable Scheduler tasks in Primary site ESAs.
For enabling scheduler tasks, refer to Enable Scheduler tasks in Primary site ESAs.
Migrate Audit logs from DR site ESAs to Primary site ESAs.
When the traffic from protectors is redirected to the DR site ESAs, audit logs are generated in these ESAs. These audit logs must be migrated to Primary site ESAs.
For migrating audit logs, refer to Migrate Audit logs from DR site ESAs to Primary site ESAs.
Additional Considerations
Documentation: Maintain detailed records of the upgrade procedure for future reference.
Troubleshooting: Have contingency plans in place to address potential issues during the upgrade. For more information on troubleshooting, refer to Troubleshooting.
Support: Utilize Protegrity support services for guidance or troubleshooting assistance as needed. For assistance, contact Protegrity Support at
support@protegrity.com.
12.2.10 - Upgrading ESA with 9.1.0.0/10.x Protectors
This section describes the steps to upgrade ESAs with 9.1.0.0/10.x protectors already installed (excluding DSGs). To ensure compatibility and leverage new features, security fixes, and enhancements, it is necessary to upgrade the ESA to the latest version. This section outlines the required steps for upgrading from a previous version, applicable to both on-premise and cloud platforms.
Prerequisites
Before proceeding with the upgrade, refer to Before you begin to ensure all prerequisites are met.
Related Documentation
- If DSGs are installed with other protectors, refer to Upgrading ESA with DSGs and Protectors
- If only DSGs are installed, refer to Upgrading ESA with DSG
Important: The steps in this section ensure zero downtime of protectors during ESA upgrade.
Upgrade Steps
Phase 1: Disaster Recovery (DR) Site Upgrade
For backing up ESAs, refer to Backup all ESAs.
For disabling TAC replication, refer to Disable TAC replication job from Primary ESA P1.
For more information about the prerequisites, refer to Prerequisites.
For upgrading DR site ESAs, refer to Upgrade ESAs S3, S4 and S5 at the DR site.
For validating DR site ESAs, refer to Validate DR Site ESAs Post Upgrade.
Adjust configurations to redirect the GTM so that it points to LTM2. This ensures that protectors communicate with the upgraded ESAs at the DR site.
Important: At this stage, do not add any new protectors. The validations mentioned in the steps below must be performed using existing protectors.
For v9.1.0.0 Protectors:
- Log in to ESA S3 Web UI.
- Navigate to Policy Management and verify:
- All protector registrations in Data Stores show as GREEN or Ok.
- Policy Deploy Status shows as GREEN or Ok.
For v10.x Protectors:
- Log in to ESA S3 Web UI.
- Navigate to Audit Store > Dashboard. Verify the protector status in Protector Status Dashboard is shown as GREEN or OK.
- Confirm that protectors can perform data security operations after upgrading the ESAs.
- Verify that audit events are being forwarded successfully to the ESAs.
Phase 2: Primary Site Upgrade
For upgrading primary site ESAs, refer to Upgrade ESAs P1, S1 and S2 at the Primary site.
For validating primary site ESAs, refer to Validate Primary Site ESAs post upgrade.
Reconfigure the GTM to point back to LTM1, allowing protectors to resume communication with the ESAs at the primary site.
At this point, Nodes Connectivity Status of some or all nodes may show as red (Error) or yellow (Warning) under Policy Management > Data Stores in ESA P1 Web UI.
To reset node status to green (OK), follow these steps:
- Log in to ESA P1 Web UI.
- Navigate to Policy Management > Data Stores.
- Select nodes showing red (Error) or yellow (Warning) status and click the delete button to remove the entry.
Important: If there are many pepserver nodes registered, delete the nodes in batches of 200.
After deleting the registered nodes, pepserver nodes will re-register with ESA and the status will become green (OK).
For 9.1.0.0 Protectors: - Follow the same verification steps as in Phase 1, Step 3. Refer step 1 for steps.
For 10.x Protectors: - Follow the same verification steps as in Phase 1, Step 3. Refer step 1 for steps.
- Confirm that protectors can perform data security operations post-upgrade.
- Verify that audit events are being forwarded successfully to the ESAs.
Phase 3: Post-Upgrade Tasks
For enabling scheduler tasks, refer to Enable Scheduler tasks in Primary site ESAs.
When the traffic from protectors was redirected to the DR site ESAs, audit logs will be generated in those ESAs. Those audit logs need to be migrated to Primary site ESAs. For migrating audit logs, refer to Migrate Audit logs from DR site ESAs to Primary site ESAs.
Additional Considerations
Documentation: Maintain detailed records of the upgrade procedure for future reference.
Troubleshooting: Have contingency plans in place to address potential issues arising during the upgrade. For more information on troubleshooting, refer to Troubleshooting.
Support: Utilize Protegrity support services for guidance or troubleshooting assistance as needed. For assistance, contact Protegrity Support at
support@protegrity.com.
12.2.11 - Upgrading ESA with DSGs and 9.1.0.0/10.x Protectors
This section describes the steps to upgrade ESAs and DSGs with running v9.1.0.0 protectors in backward compatibility mode or v10.x protectors.
Upgrade Approaches for DSG
Two upgrade approaches are available for the DSG upgrade process:
- Canary Upgrade - Reimaging DSG instances to the newer version using ISO or cloud images.
- In-place Upgrade - Upgrading existing DSG instances using patches.
Select the most appropriate upgrade approach based on organizational requirements, infrastructure constraints, and operational considerations.
Important Notes
The steps in this section ensure zero downtime of v9.1.0.0 or v10.x Protectors during ESA upgrade.
Both upgrade approaches will incur DSG downtime during the upgrade process. Plan accordingly to minimize impact on production operations.
Canary Upgrade
The canary upgrade involves reimaging existing DSG instances to the newer version using ISO or cloud images. This can be performed by reusing the same instance or spawning a new instance for DSG and terminating the older version DSGs.
Important: DSG downtime will occur during upgrade. However, downtime can be minimized by spawning fresh DSGs v4.0.0 in parallel to upgrading ESAs.
Phase 1: DR Site Upgrade
For backing up ESAs, refer to Backup all ESAs.
Disable TAC replication job from Primary ESA P1.
For disabling TAC replication, refer to Disable TAC replication job from Primary ESA P1.
Ensure all the prerequisites are followed before proceeding with the upgrade of each ESA.
For more information about the prerequisites, refer to Prerequisites.
Upgrade ESAs S3, S4 and S5 at the Disaster Recovery (DR) site parallely.
For upgrading DR site ESAs, refer to Upgrade ESAs S3, S4 and S5 at the DR site.
Validate DR Site ESAs Post upgrade.
For validating DR site ESAs, refer to Validate DR Site ESAs Post Upgrade.
Stop Application Traffic to DSGs.
Ensure to stop the Application Traffic to any of the DSGs.
- Remove all existing DSGs from the TAC before proceeding with further upgrade steps.
- Stop all existing DSGs to minimize downtime impact.
Redirect Protector Traffic to DR Site.
Adjust configurations to redirect the GTM to point to LTM2. This ensures that protectors communicate with the upgraded ESAs at the DR site.
Important: At this stage, do not add any new protectors. The validations mentioned in the following steps must be performed using existing protectors.
For verifying protector status, refer to Verify Protector Status.
Validate v9.1.0.0 or v10.x Protector Operations.
For protector validation, refer to Validate Protector Operations.
Phase 2: Primary Site Upgrade
Upgrade ESAs P1, S1 and S2 at the Primary site parallely.
For upgrading primary site ESAs, refer to Upgrade ESAs P1, S1 and S2 at the Primary site.
Validate Primary Site ESAs post upgrade.
For validating primary site ESAs, refer to Validate Primary Site ESAs post upgrade.
Installing and configuring the DSGs.
For installing and configuring DSGs, refer to Install and Configure DSGs.
Install DSG Patch on All ESAs.
Install DSG v4.0.0 patch on all ESAs in both Primary and DR sites, that is, ESA P1, S1, S2, S3, S4, and S5.
Redirect Protector Traffic to Primary Site.
Adjust configurations to redirect the GTM to point to LTM1. This allows protectors to resume communication with the ESAs at the Primary site.
Reset Node Status for only the v9.1.0.0 Protectors.
For resetting node status at primary site ESA P1, refer to Reset Node Status for 9.1.0.0 Protectors Only.
For verifying protector status at primary site ESA P1, refer to Verify Protector Status.
Validate v9.1.0.0 or v10.x Protector Operations.
For protector validation, refer to Validate Protector Operations.
Perform ESA communication from all DSGs. For all options in ESA communication, provide GTM IP, hostname or FQDN as applicable. For more information, refer to Setting up ESA communication.
During the prompt for DSG details, provide the FQDN or hostname of any running DSG in the TAC. Ensure the same DSG FQDN/hostname is provided during DSG node registration in all ESAs, that is, P1, S1, S2, S3, S4, and S5.
Verify DSG Cluster Page in ESA.
Verify that all installed DSGs are listed under Cloud Gateway > Cluster page in ESA P1.
Click the Deploy button from the DSG Cluster page in ESA P1 to deploy rulesets to all DSGs present in the TAC. For more information, refer to Deploying configurations to the cluster.
Check Health Status of DSGs from Cluster Page.
After successful deployment of rulesets, verify the health status of DSGs in the TAC from the DSG Cluster page in ESA P1. All DSGs should show health status as green.
For validating DSG operations, refer to Validate DSG Operations.
Phase 3: Post-Upgrade Tasks
For enabling scheduler tasks, refer to Enable Scheduler tasks in Primary site ESAs.
With successful upgrade of DSGs and validation of operations, terminate all older version DSGs that were stopped in Pre-Upgrade Steps for DSG to free up resources.
Migrate Audit Logs from DR Site ESAs to Primary Site ESAs.
When the traffic from protectors is redirected to the DR site ESAs, audit logs are generated in these ESAs. These audit logs need to be migrated to Primary site ESAs. For migrating audit logs, refer to Migrate Audit logs from DR site ESAs to Primary site ESAs.
In-place Upgrade
The in-place upgrade involves upgrading existing DSG instances to the newer version sequentially using patches.
Phase 1: DR Site Upgrade
For backing up ESAs, refer to Backup all ESAs.
Disable TAC replication job from Primary ESA P1.
For disabling TAC replication, refer to Disable TAC replication job from Primary ESA P1.
Ensure all the prerequisites are followed before proceeding with the upgrade of each ESA.
For more information about the prerequisites, refer to Prerequisites.
Upgrade ESAs S3, S4 and S5 at the DR site in parallel.
For upgrading DR site ESAs, refer to Upgrade ESAs S3, S4 and S5 at the DR site.
Validate DR Site ESAs Post Upgrade.
For validating DR site ESAs, refer to Validate DR Site ESAs Post Upgrade.
Stop Application Traffic to DSGs.
Ensure to stop the Application Traffic to any of the DSGs.
Redirect Protector Traffic to the DR Site.
Adjust configurations to redirect the GTM to point to LTM2. This ensures that protectors communicate with the upgraded ESAs at the DR site.
Important: At this stage, do not add any new protectors. The validations mentioned in the following steps must be performed using existing protectors.
For verifying protector status, refer to Verify Protector Status.
Validate Protector Operations.
For validating protector operations, refer to Validate Protector Operations.
For installing DSG patch on DR site ESAs, refer to Install DSG Patch on DR Site ESAs.
For upgrading DSG nodes, refer to Upgrade DSG Nodes.
Restore DSG TAC from the first DSG.
For restore DSG TAC, refer to Restore DSG TAC.
For configuring ESA communication, refer to Configure ESA Communication.
For registering DSG nodes with DR ESAs, refer to Register DSG Node with ESA.
For verifying DSG cluster at ESA S3, refer to Verify DSG Cluster.
For deploying rulesets from ESA S3, refer to Deploy Rulesets.
For verifying DSG health status at ESA S3, refer to Verify DSG Health Status.
For validating DSG operations, refer to Validate DSG Operations.
Phase 2: Primary Site Upgrade
Upgrade ESAs P1, S1 and S2 at the Primary site in parallel.
For upgrading primary site ESAs, refer to Upgrade ESAs P1, S1 and S2 at the Primary site.
Validate Primary Site ESAs post upgrade.
For validating primary site ESAs, refer to Validate Primary Site ESAs post upgrade.
For installing DSG patch on primary site ESAs, refer to Install DSG Patch on Primary Site ESAs.
For registering DSG nodes with primary ESAs, refer to Register DSG Node with ESA.
Redirect Protector Traffic to Primary Site.
Adjust configurations to redirect the GTM to point to LTM1. This allows protectors to resume communication with the ESAs at the Primary site.
Reset Node Status only on the v9.1.0.0 Protectors.
For resetting node status at primary site ESA P1, refer to Reset Node Status (9.1.0.0 Protectors Only).
For verifying protector status at primary site ESA P1, refer to Verify Protector Status.
Validate v9.1.0.0 or v10.x Protector Operations.
For protector validation, refer to Validate Protector Operations.
Verify DSG Cluster Page in ESA.
Verify that all installed DSGs are listed under Cloud Gateway > Cluster page in ESA P1.
Click the Deploy button from the DSG Cluster page in ESA P1 to deploy rulesets to all DSGs present in the TAC. For more information, refer to Deploying configurations to the cluster.
Check Health Status of DSGs from Cluster Page.
After successful deployment of rulesets, verify the health status of DSGs in the TAC from the DSG Cluster page in ESA P1. All DSGs should show health status as green.
For validating DSG operations, refer to Validate DSG Operations.
Phase 3: Post-Upgrade Tasks
Enable Scheduler tasks in Primary site ESAs..
For enabling scheduler tasks, refer to Enable Scheduler tasks in Primary site ESAs.
Migrate Audit logs from DR site ESAs to Primary site ESAs.
When the traffic from protectors was redirected to the DR site ESAs, audit logs will be generated in those ESAs. Those audit logs need to be migrated to Primary site ESAs. For migrating audit logs, refer to Migrate Audit logs from DR site ESAs to Primary site ESAs.
Additional Considerations
Documentation: Maintain detailed records of the upgrade procedure for future reference.
Troubleshooting: Have contingency plans in place to address potential issues during the upgrade. For more information on troubleshooting, refer to Troubleshooting.
Support: Utilize Protegrity support services for guidance or troubleshooting assistance as needed. For assistance, contact Protegrity Support at
support@protegrity.com.
12.2.12 - Standard Protectors
The Standard Protectors are designed to provide robust data protection capabilities using APIs and User-Defined Functions (UDFs).
These Standard Protectors include:
SDK Protectors
Database Protectors
Datawarehouse Protectors
Bigdata Protectors
The following are the various package deployment approaches in v10.0.0:
Dynamic Package Deployment
DevOps Package Deployment
This document covers the primary package deployment approaches for Standard protectors. Dynamic Package Deployment is the primary package deployment for Standard protectors.
The architecture diagram for Standard Protectors v10.0.0 showing dynamic package deployment approach is shown below.
The architecture diagram for Standard Protectors v9.1.0.0 to help understand the architecture changes in v10.0.0 as compared to v9.1.0.0 is shown below.
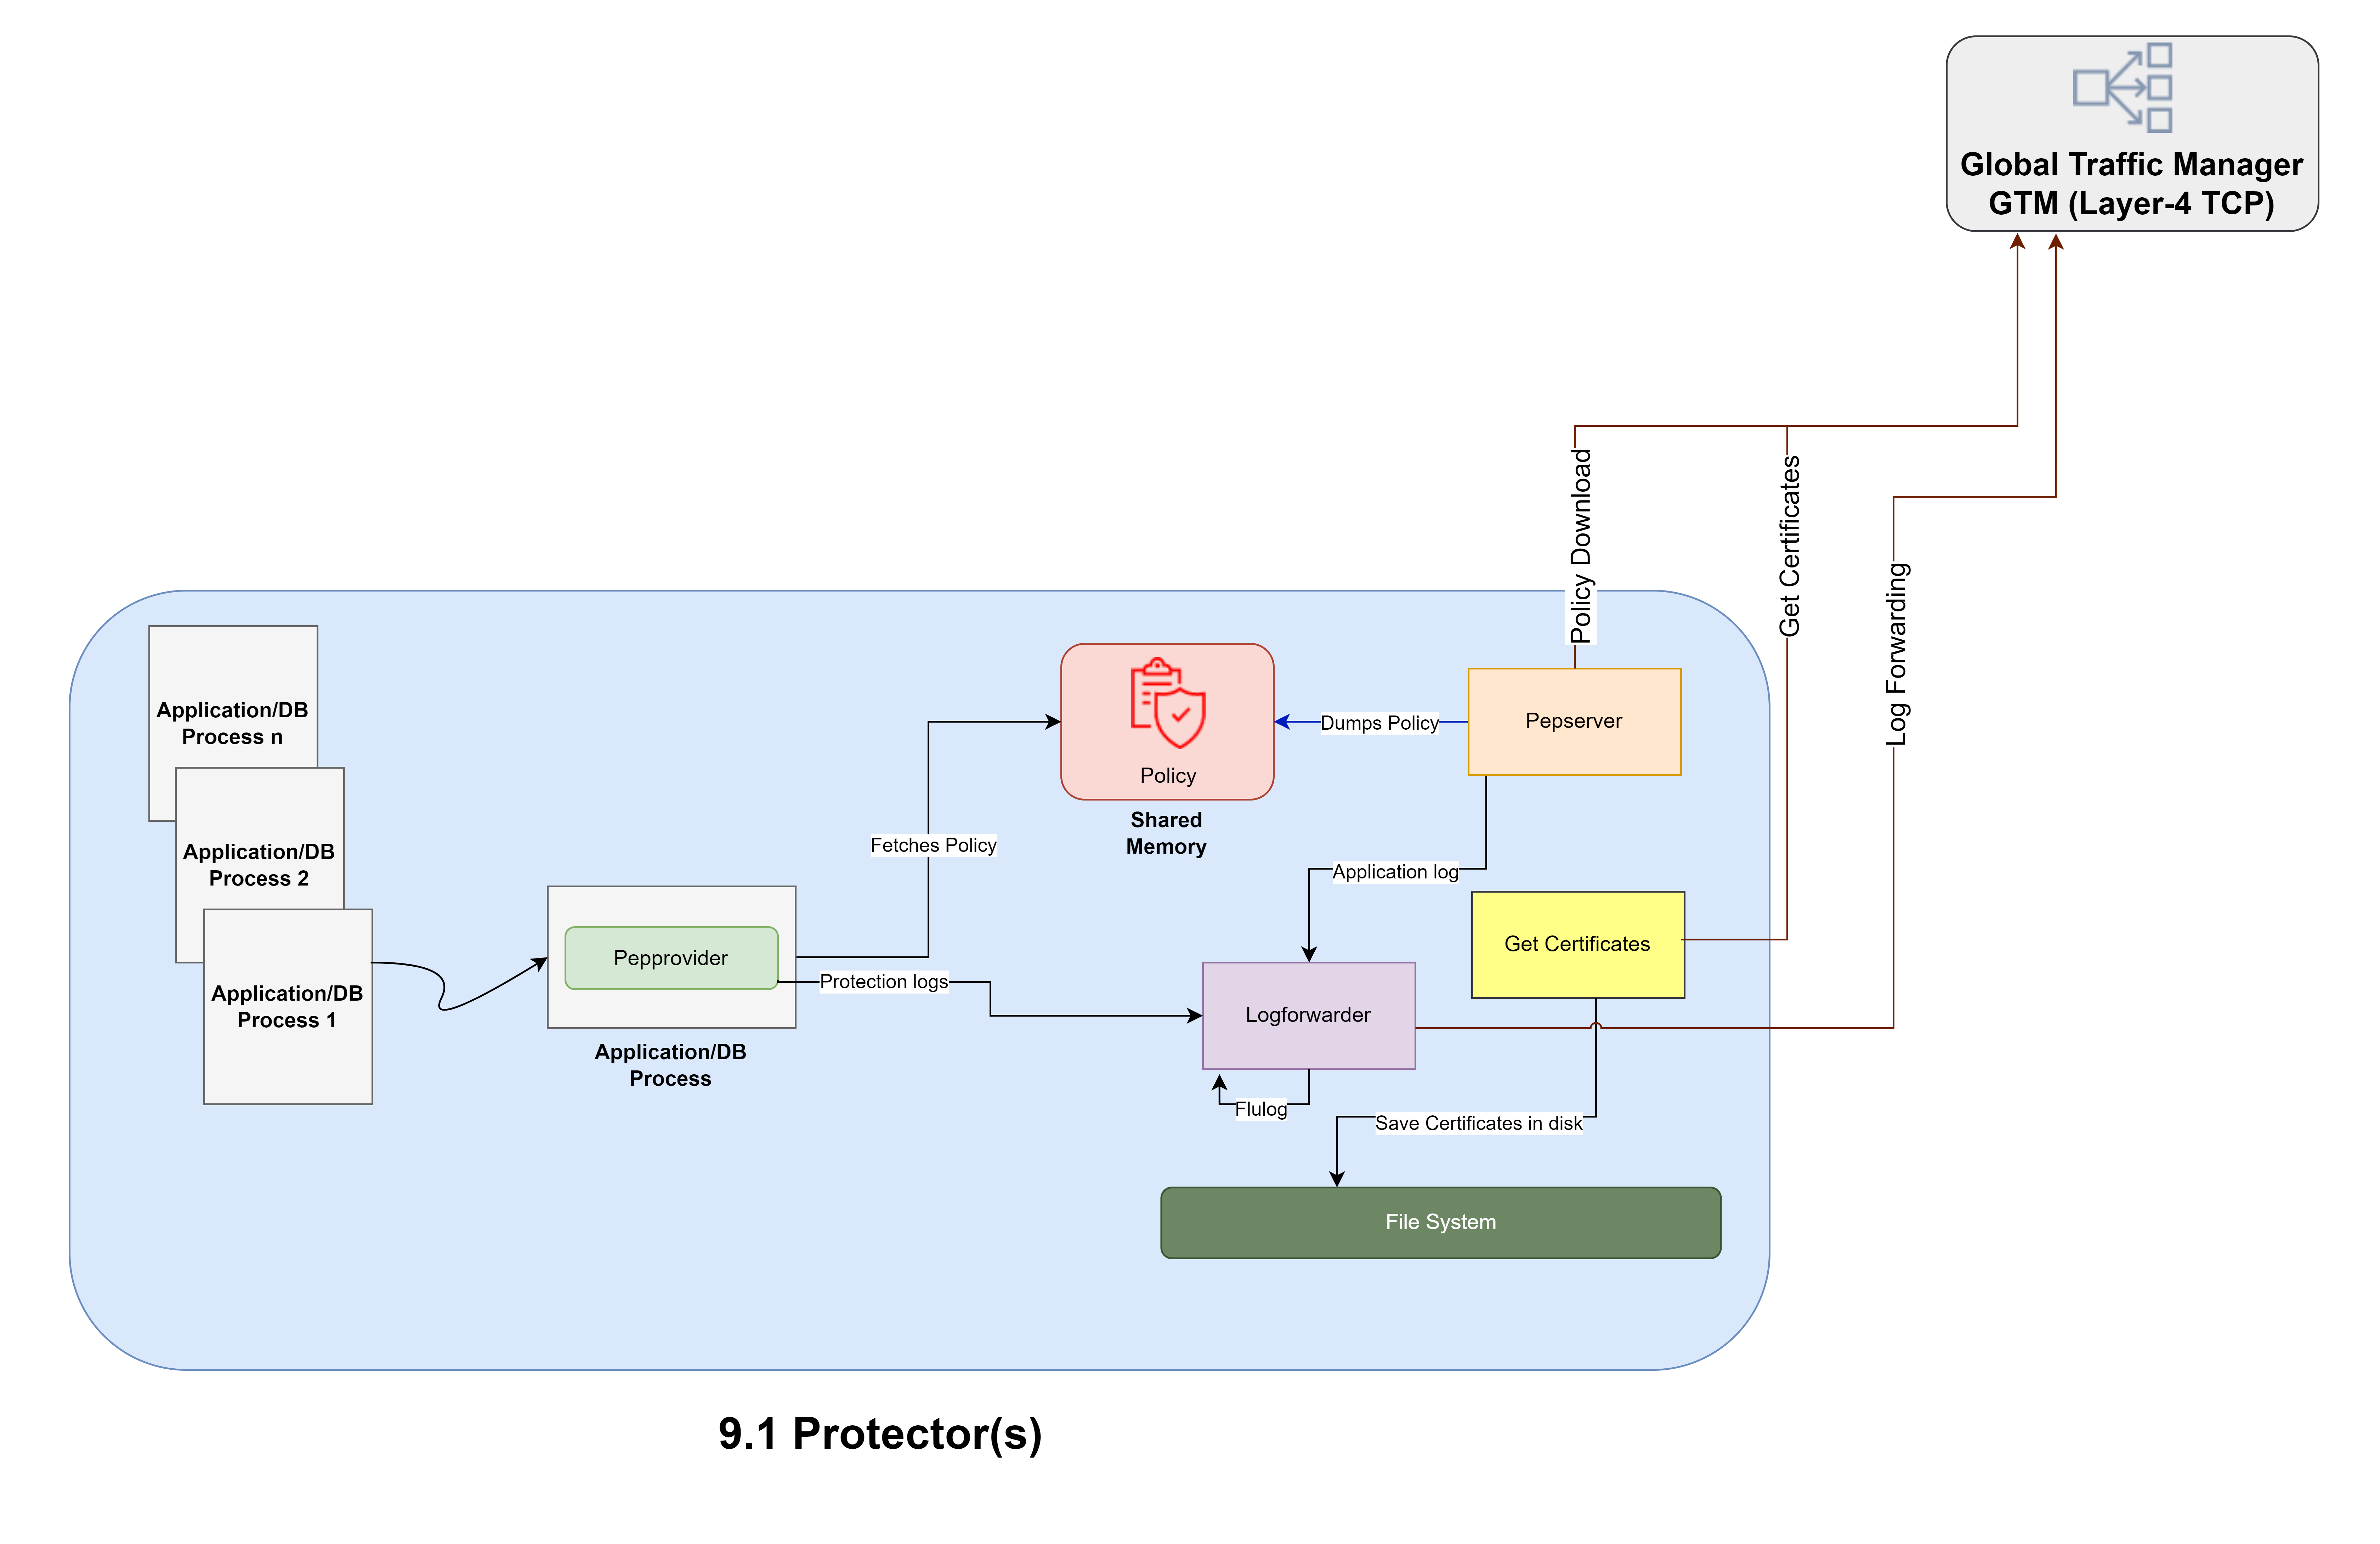
Security Recommendations
Securing the Protector installation directory
The new certificate implementation removes scrambling of the password used to derive a key used to protect the client certificate key. Instead, the key is in clear text and stored in a file called secret.txt.
As part of the Protector installation process, a file named secrets.txt is generated. This file stores the passphrase essential for decrypting the Management Client certificate key. It is imperative to ensure that this file is adequately secured to maintain the integrity and security of the system.
Action Items
File Permissions: Restrict access to the
secrets.txtfile to authorized personnel only. Apply appropriate file permissions to prevent unauthorized access or modifications. If the group-read bit is not necessary for the system to work properly, it is recommended that the user changes the file permission as mentioned below-chmod g-r <PROTECTOR_INSTALLATION_DIR>/rpagent/data/secret.txtIf the group-read bit is necessary, review that the group contains appropriate users able to read the
secret.txt. Note that when running the RPAgent or RPProxy, thesecret.txtaccess can be isolated to the user running the RPAgent or RPProxy.Monitoring: Implement monitoring so that access logs can be regularly monitored to detect any unauthorized attempts to access the
secrets.txtfile.
By following these guidelines, significantly enhance the security posture of protector installation and ensure the confidentiality and integrity of critical security information.
ESA Communication Flow
Package Traffic: Protector should be configured to download package from GTM to ensure high availability and disaster recovery.
Active Flow: Protector -> GTM -> LTM-1 -> ESA P1
Passive Flow: Protector -> GTM -> LTM-1 -> ESA S1 or ESA S2
DR Flow: Protector-> GTM -> LTM-2 -> ESA S3 or ESA S4 or ESA S5
Log Forwarding Traffic: Protector should be configured to forward logs through GTM to maintain high availability and disaster recovery.
Active Flow: Protector -> GTM -> LTM-1 -> ESA P1, ESA S1, and ESA S2
DR Flow: Protector -> GTM -> LTM-2 -> ESA S3, ESA S4, and ESA S5
12.2.13 - Forwarding Logs to External SIEM
It is advised that if logs from the ESA and Protectors need to be forwarded to an External SIEM, they should first be directed to the ESA. Utilizing the td-agent within ESA, these logs can then be forwarded concurrently to both the Insight in ESA and the external SIEM. This approach ensures a unified and efficient log management process while maintaining comprehensive audit trails and enhancing security monitoring capabilities.
For more information related to forwarding logs to External SIEM, refer to Sending logs to an external security information and event management (SIEM).
For a comprehensive understanding of the communication flows, refer to the architecture diagram Deployment with Audit logging flow to External SIEM. This diagram explains how logs are forwarded between Protectors, ESA, and the External SIEM.